Downloaded 136 times


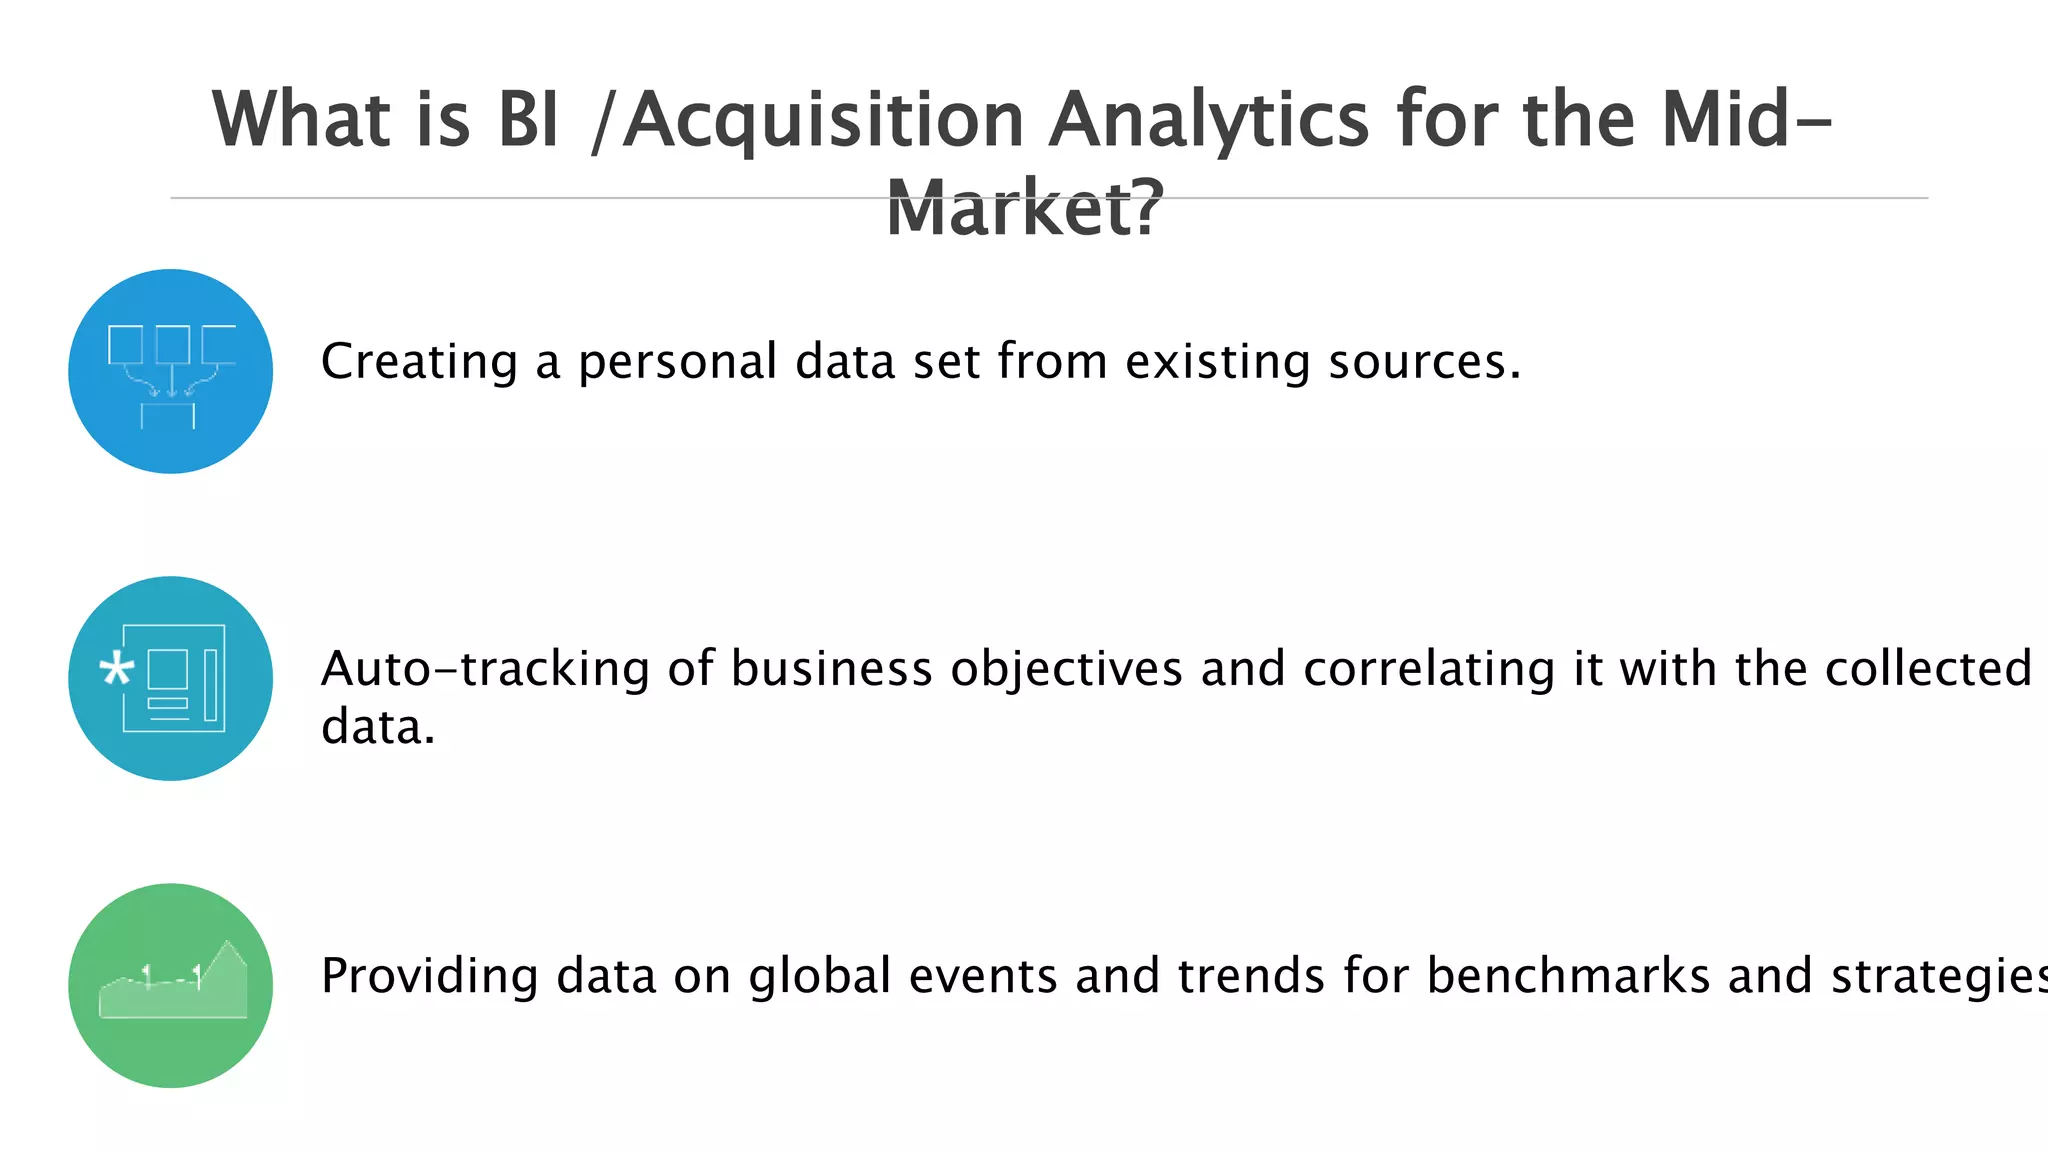


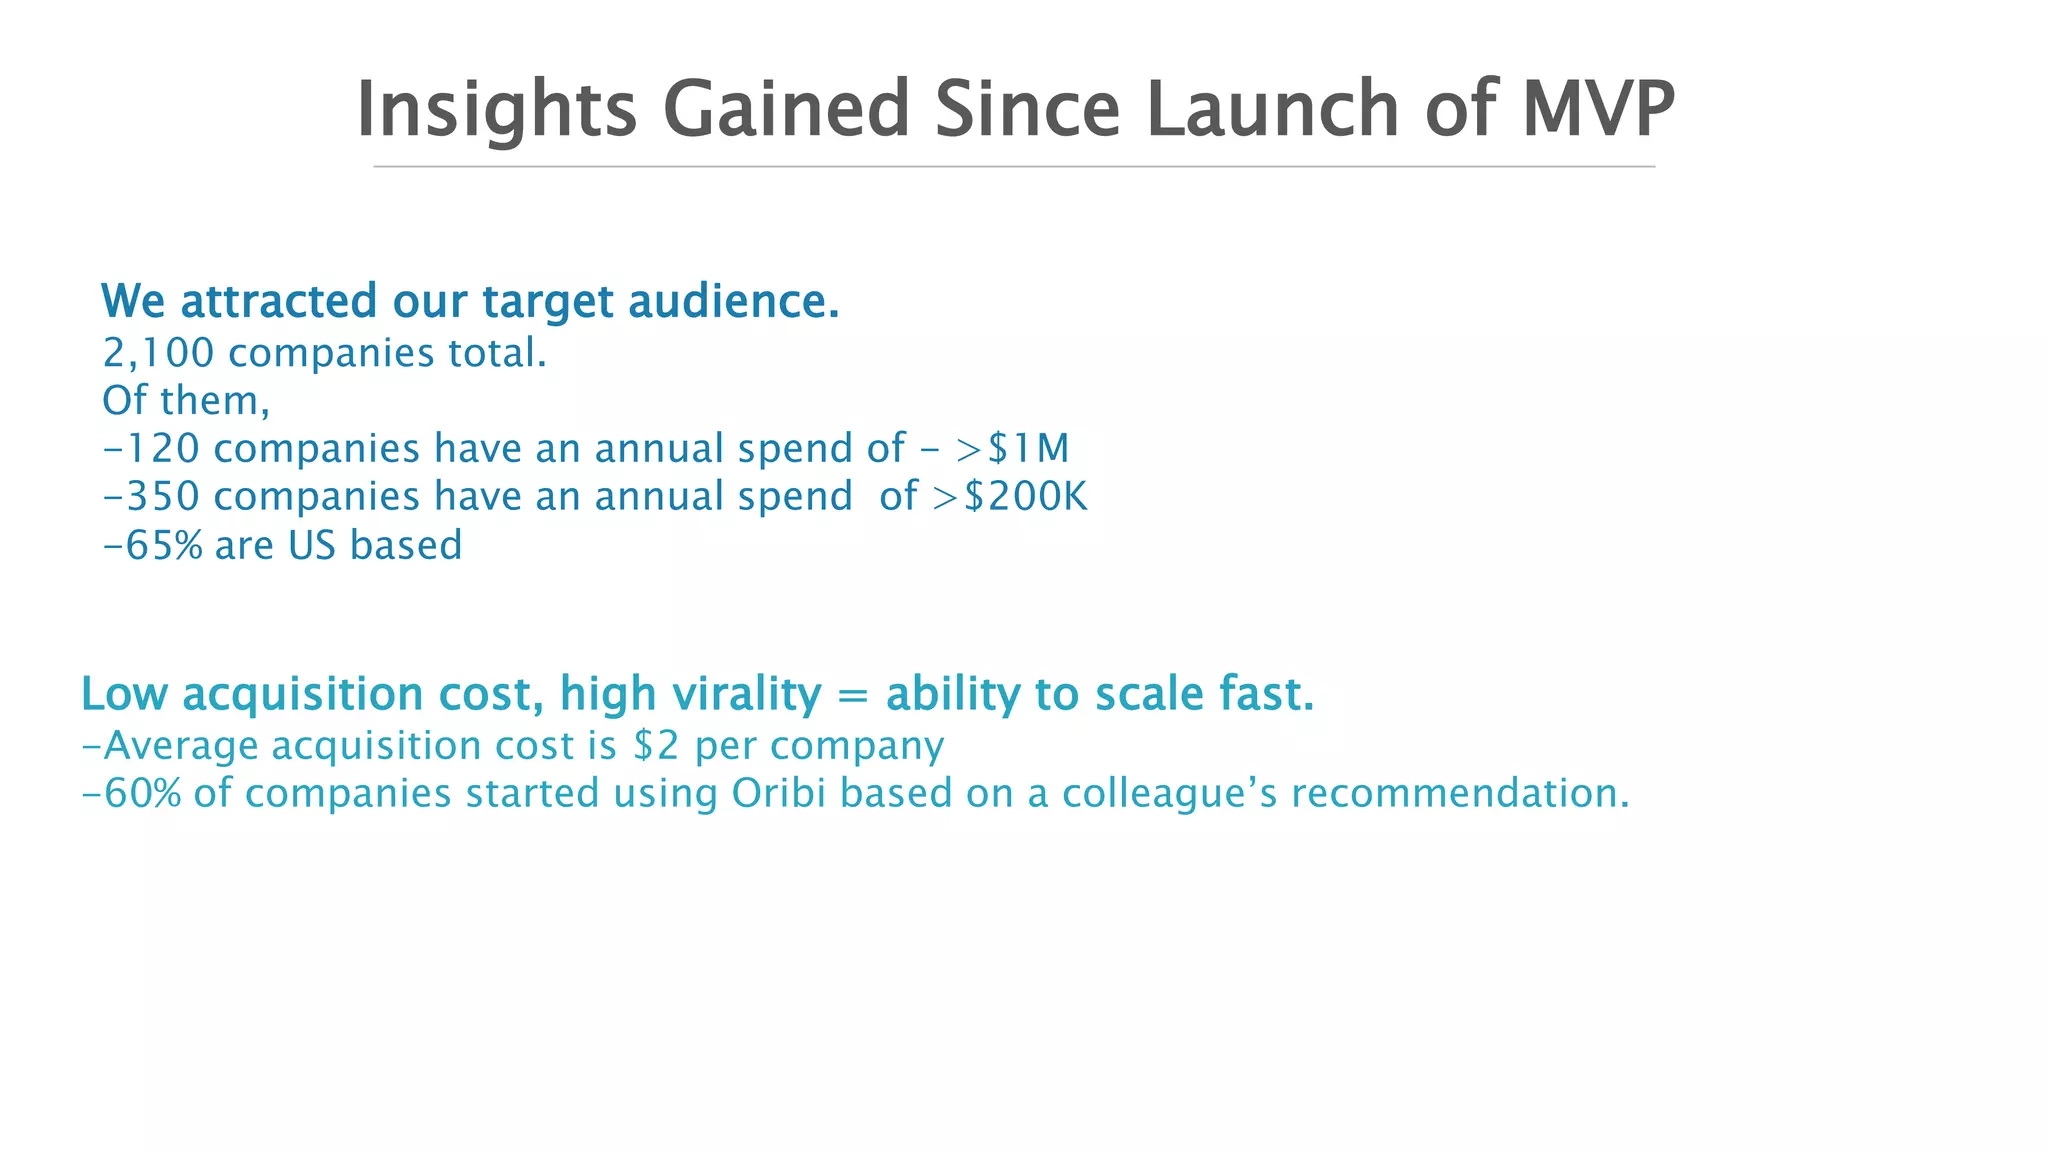


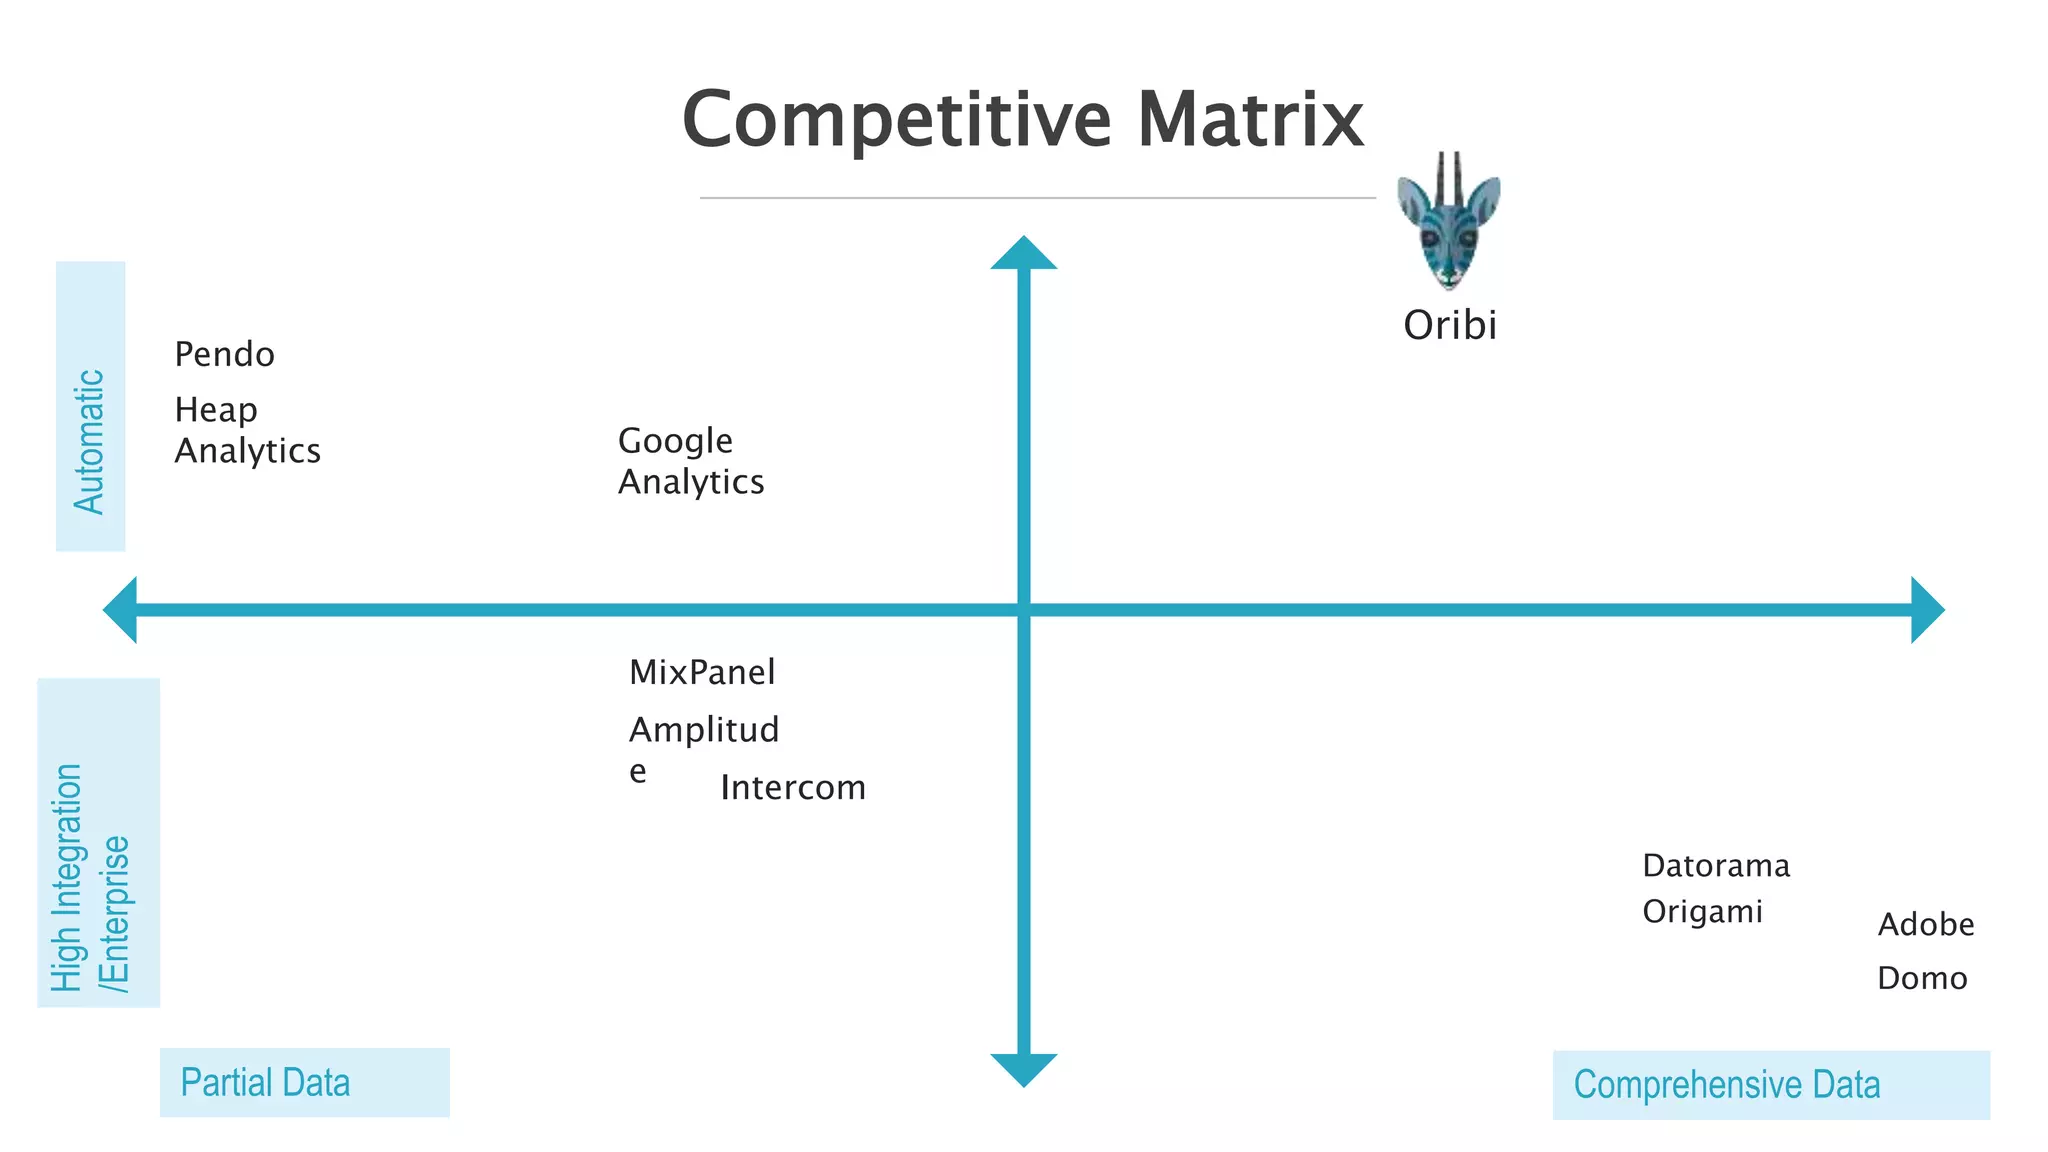


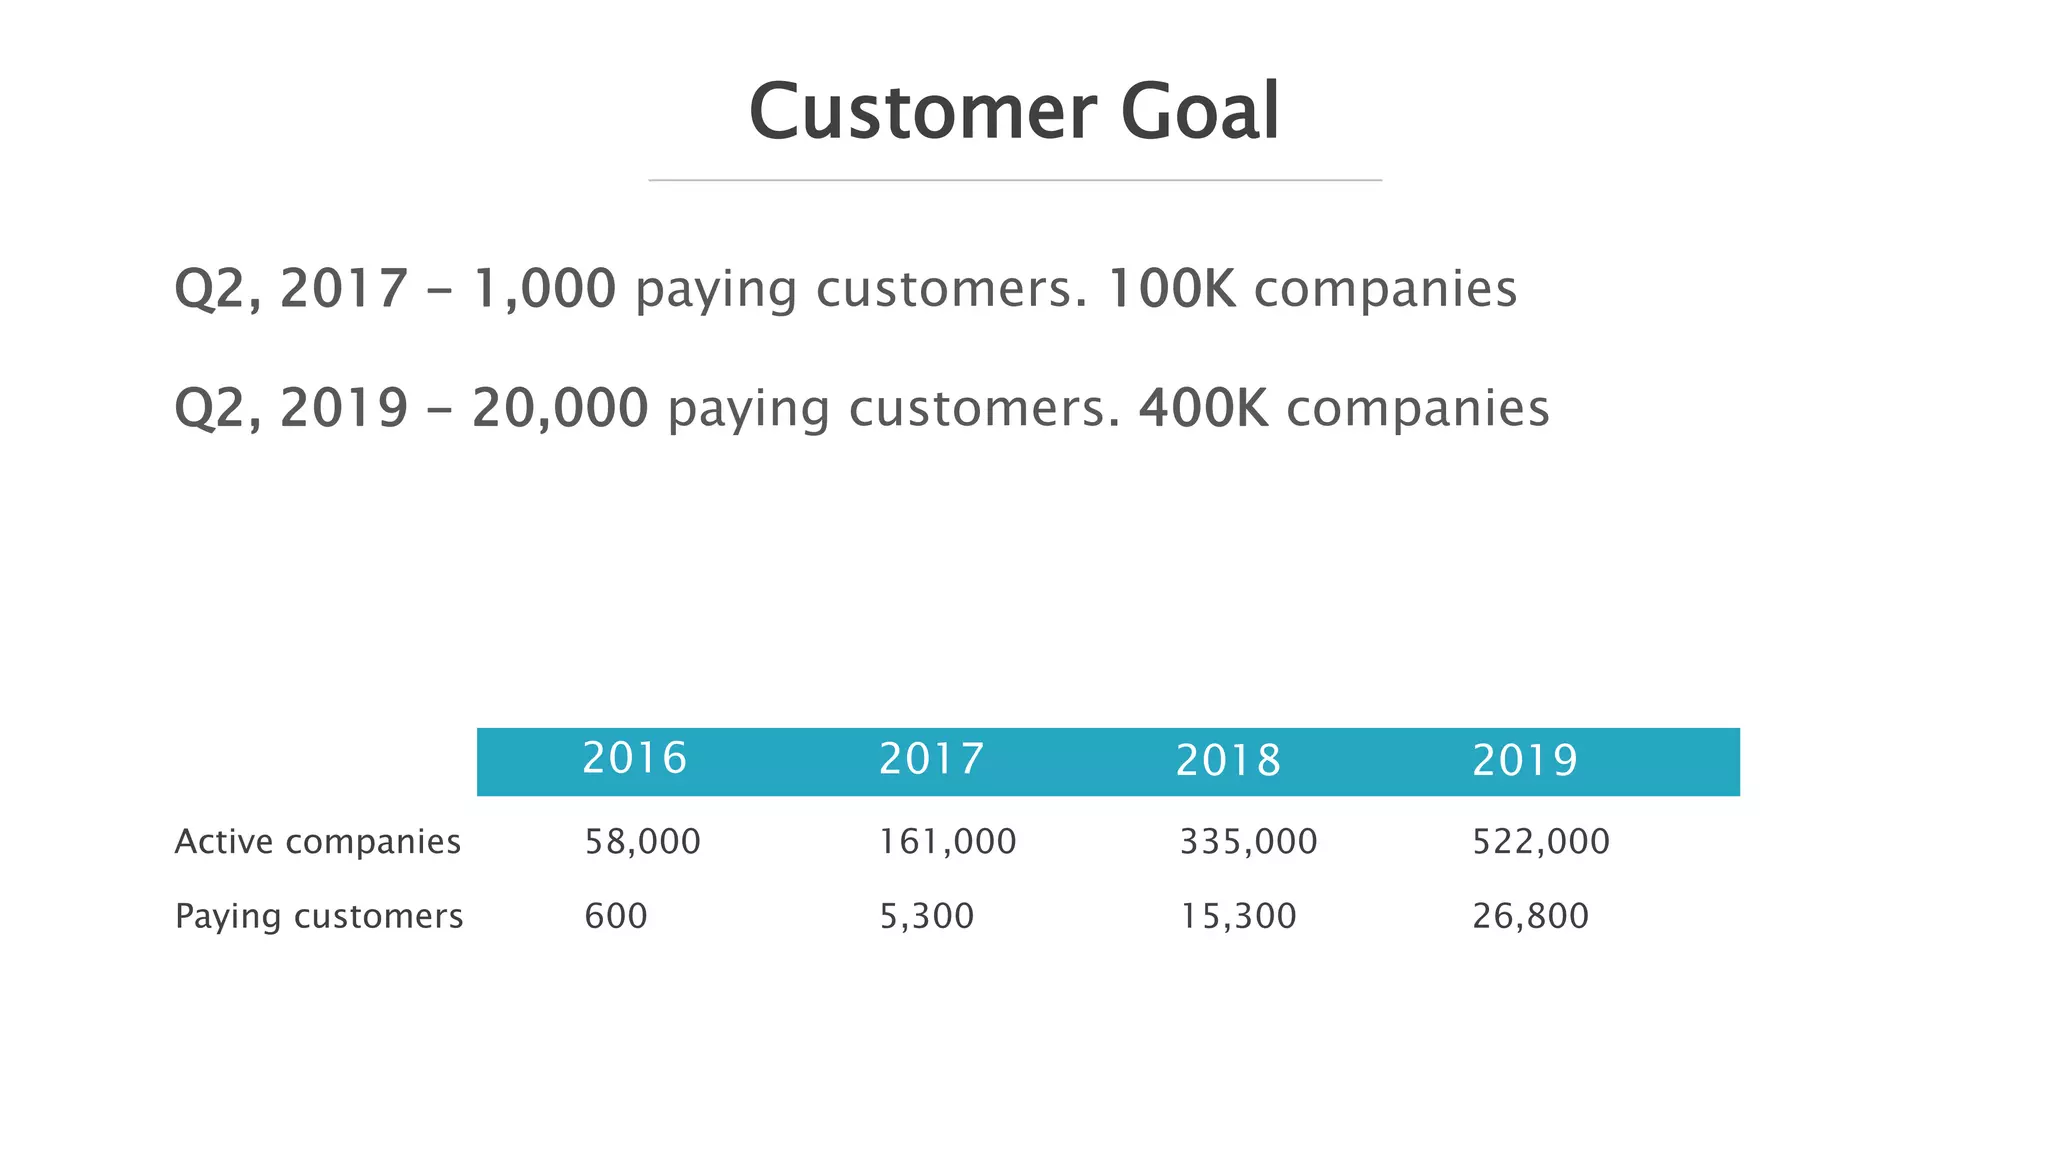
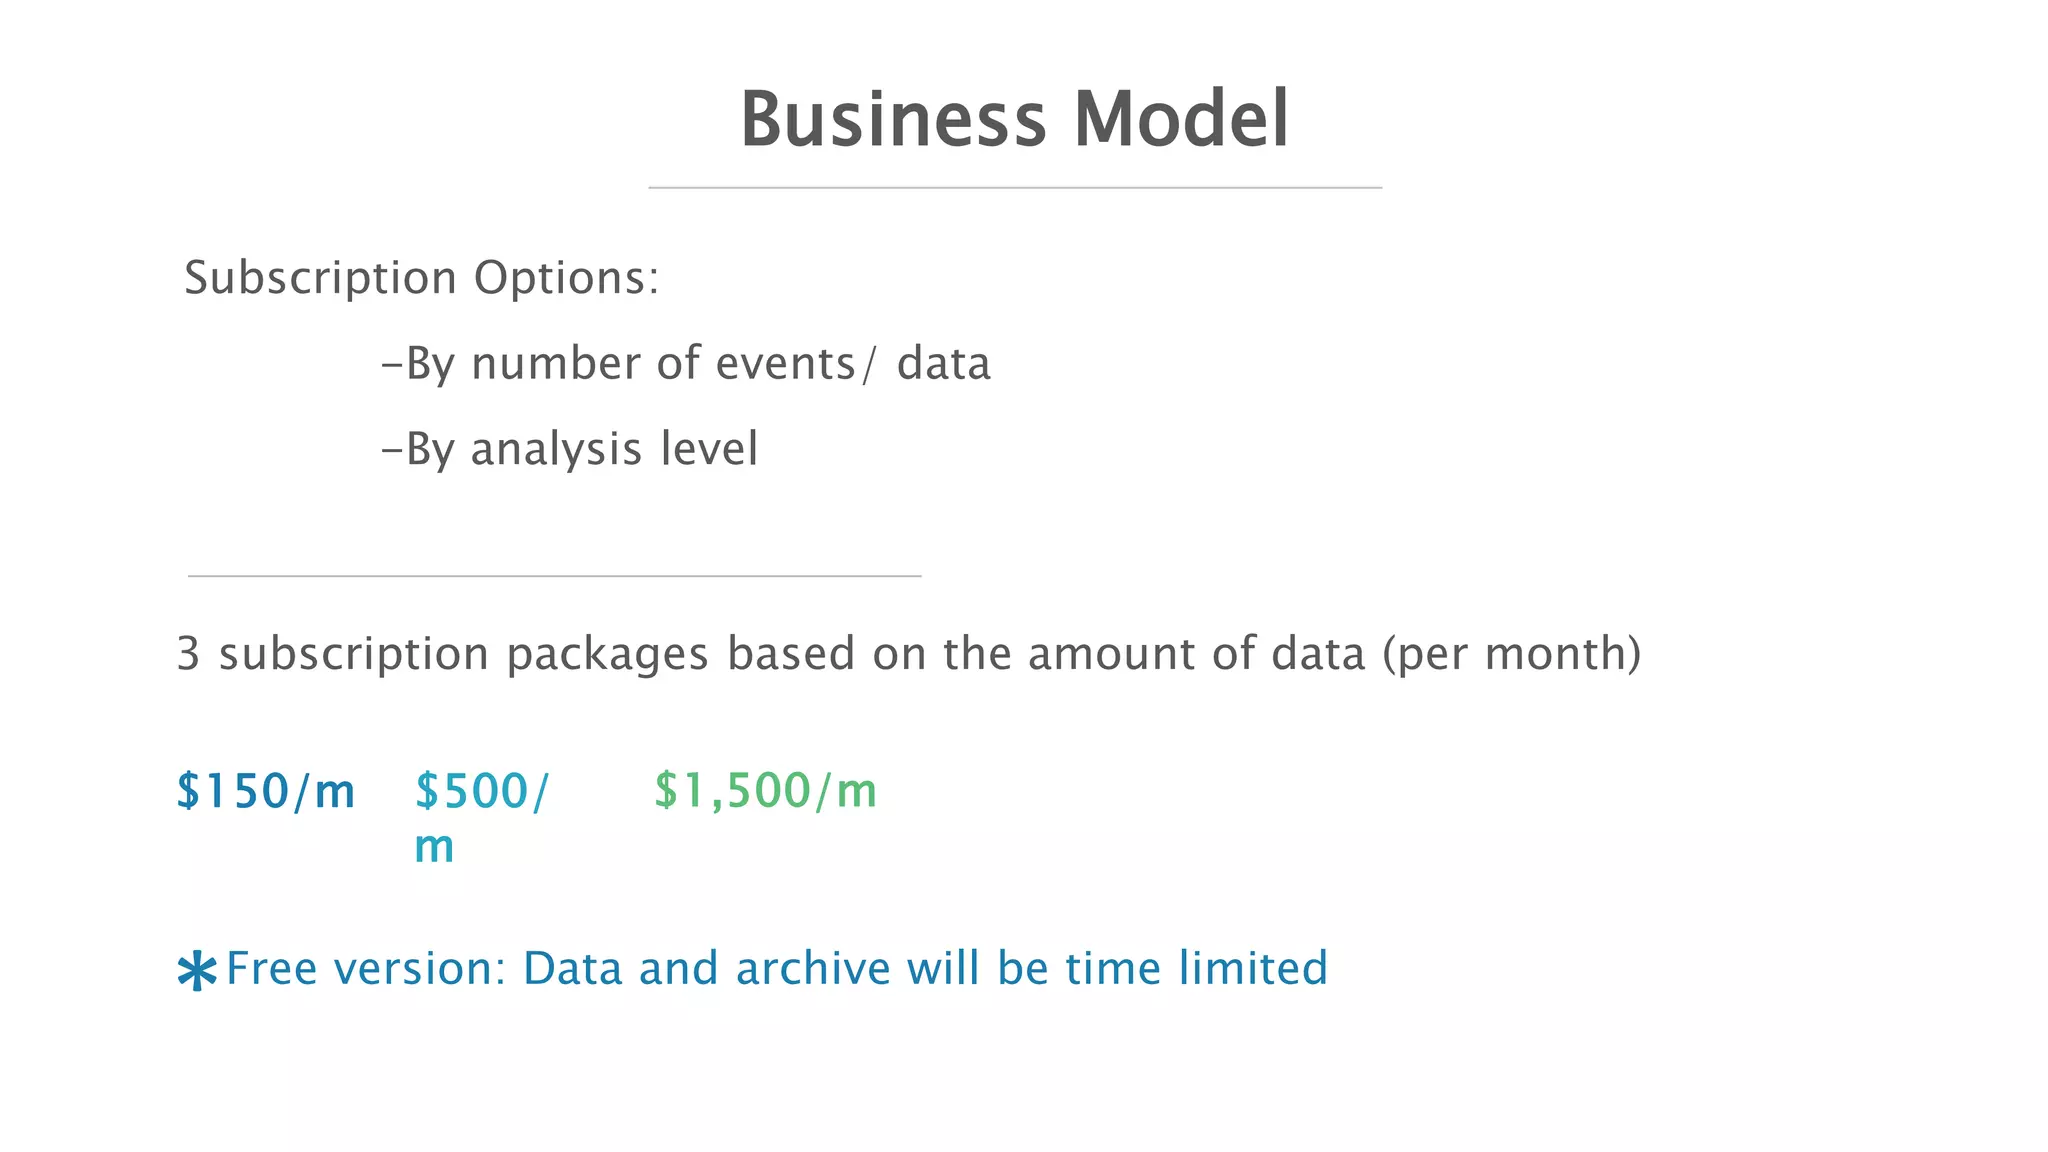


Oribi is a data analytics platform that provides enterprise-level analytics capabilities to mid-sized companies. Founded in 2015, Oribi currently has over 2,100 customers and tracks over 2 million data events. The platform automatically collects and analyzes customer data from sources like Facebook and Google Analytics to provide insights without requiring developers. Oribi's MVP product focused on Facebook advertising data and received positive feedback, with customers indicating a need for more comprehensive data analytics. Oribi plans to expand its data sources and analytics capabilities while growing its customer base to over 1,000 paying customers by mid-2017.


![Seo report [template]](https://cdn.slidesharecdn.com/ss_thumbnails/seoreporttemplate-190701074952-thumbnail.jpg?width=640&height=640&fit=bounds)


