Download as PDF, PPTX
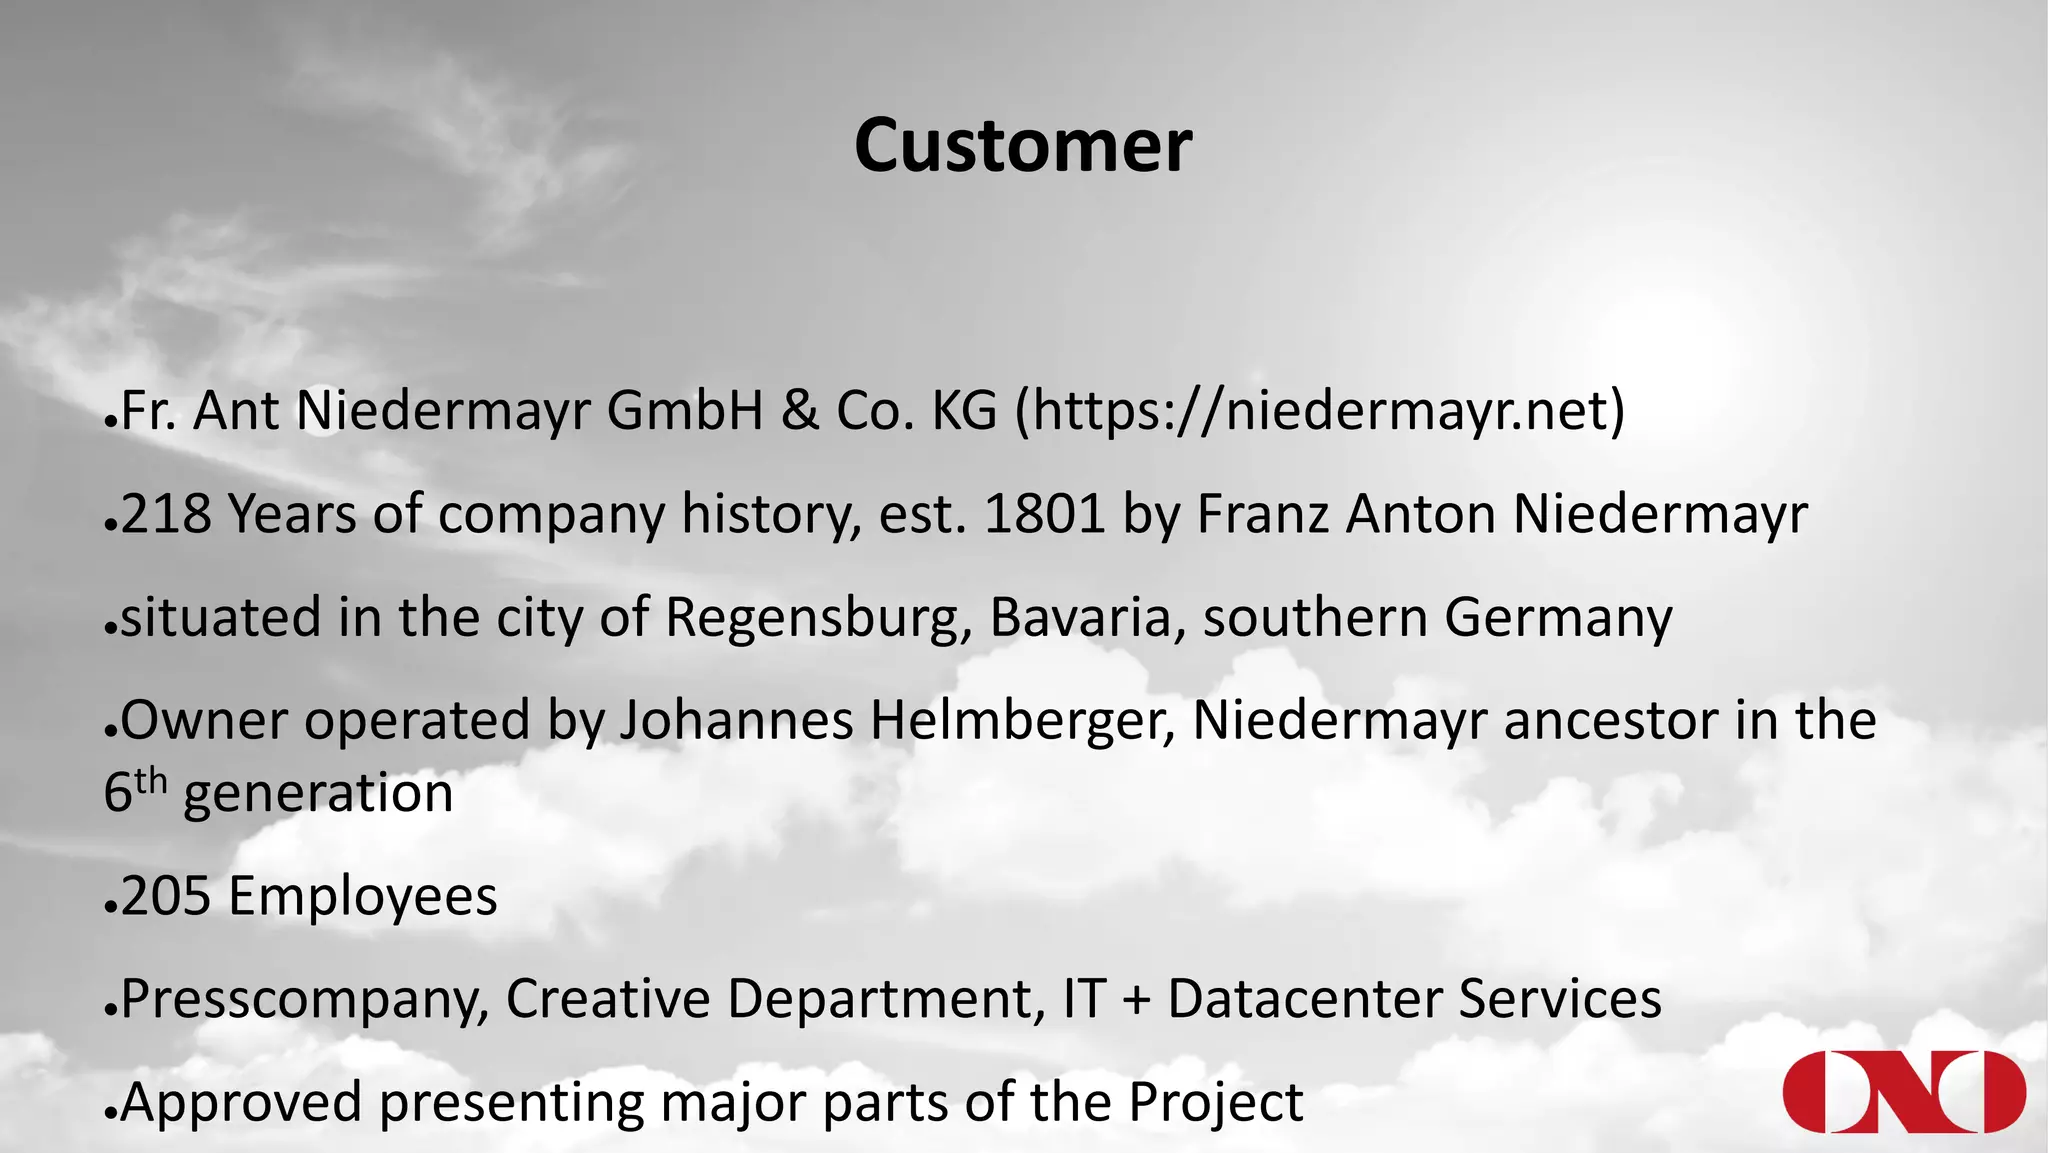
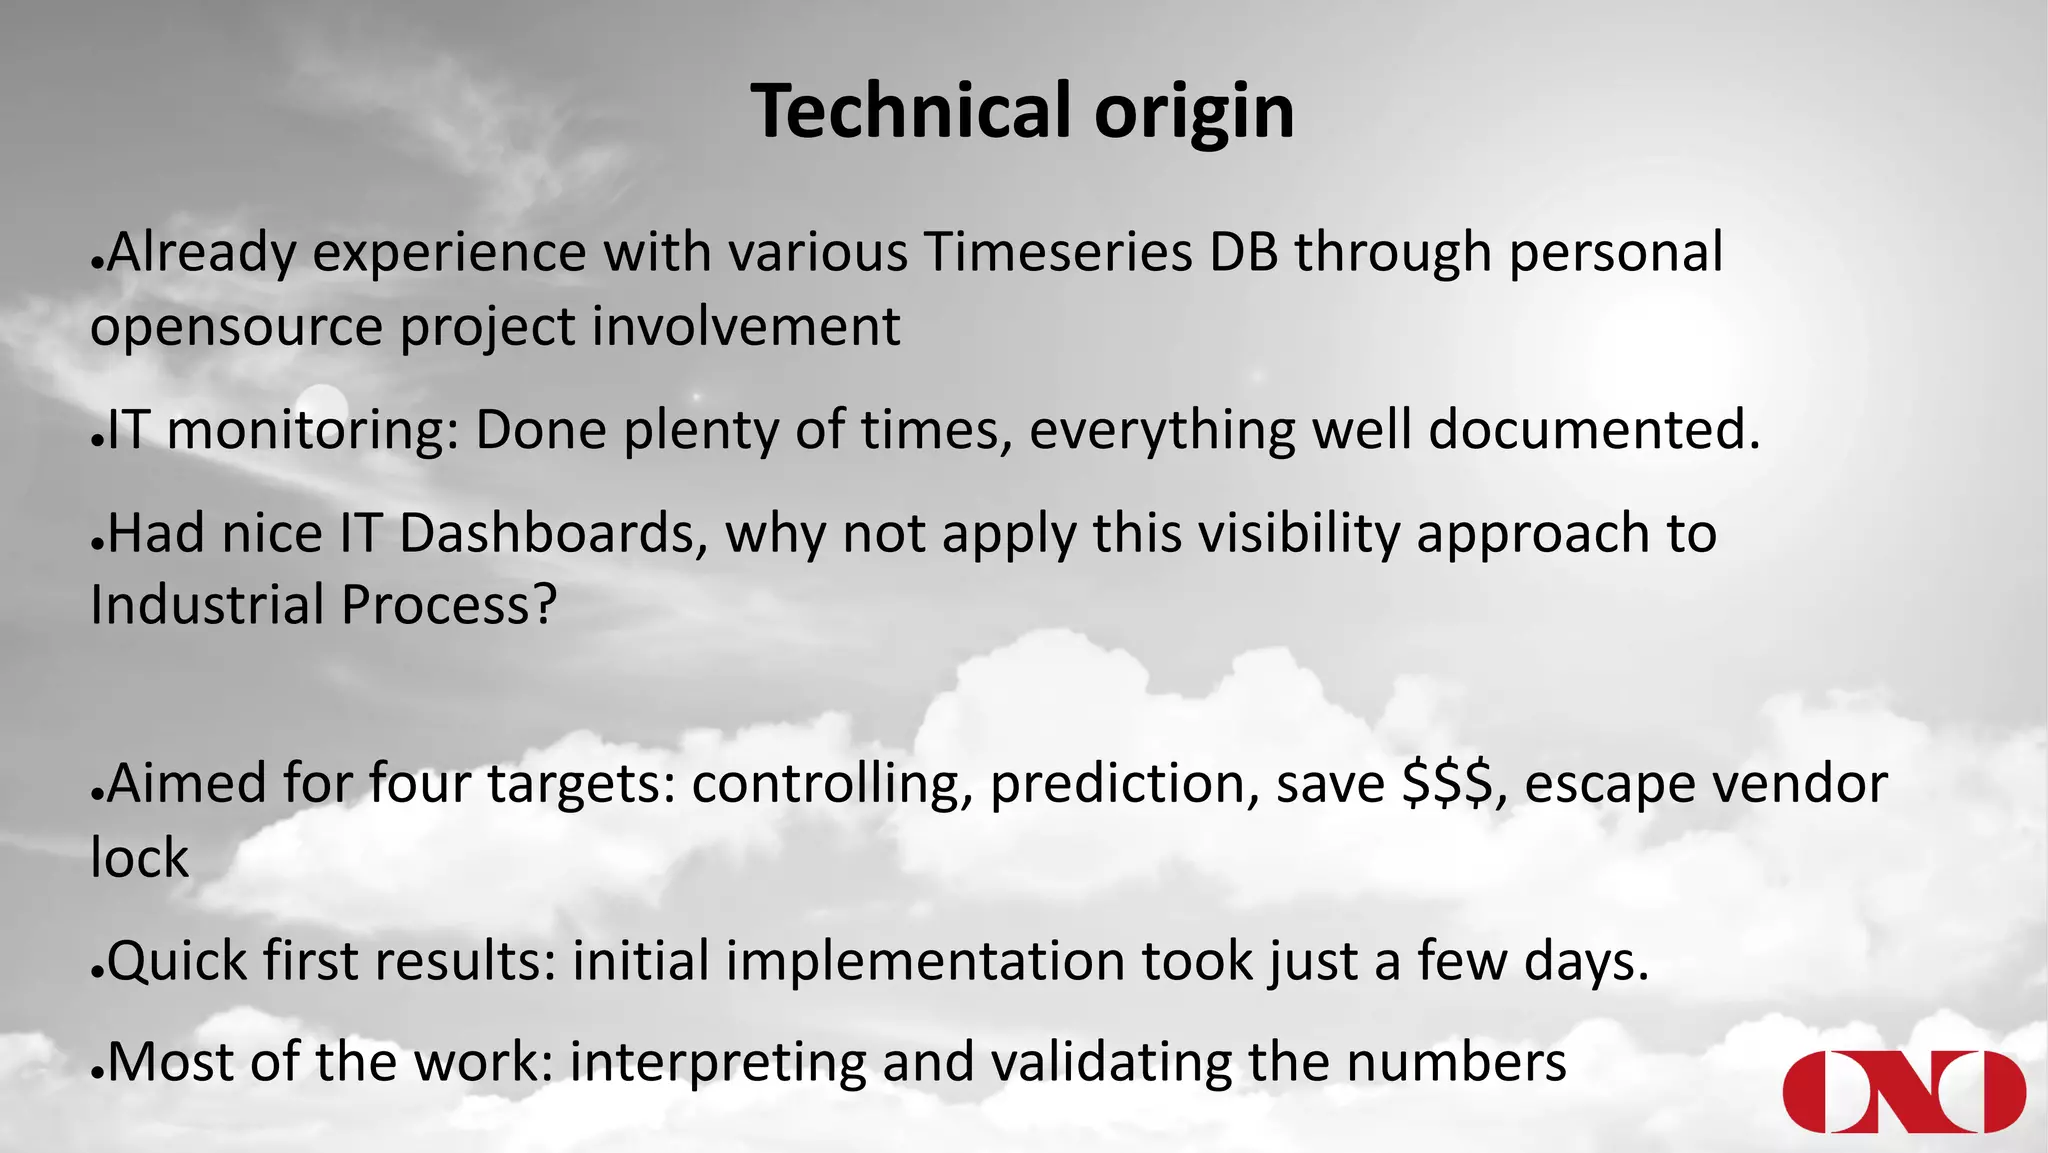
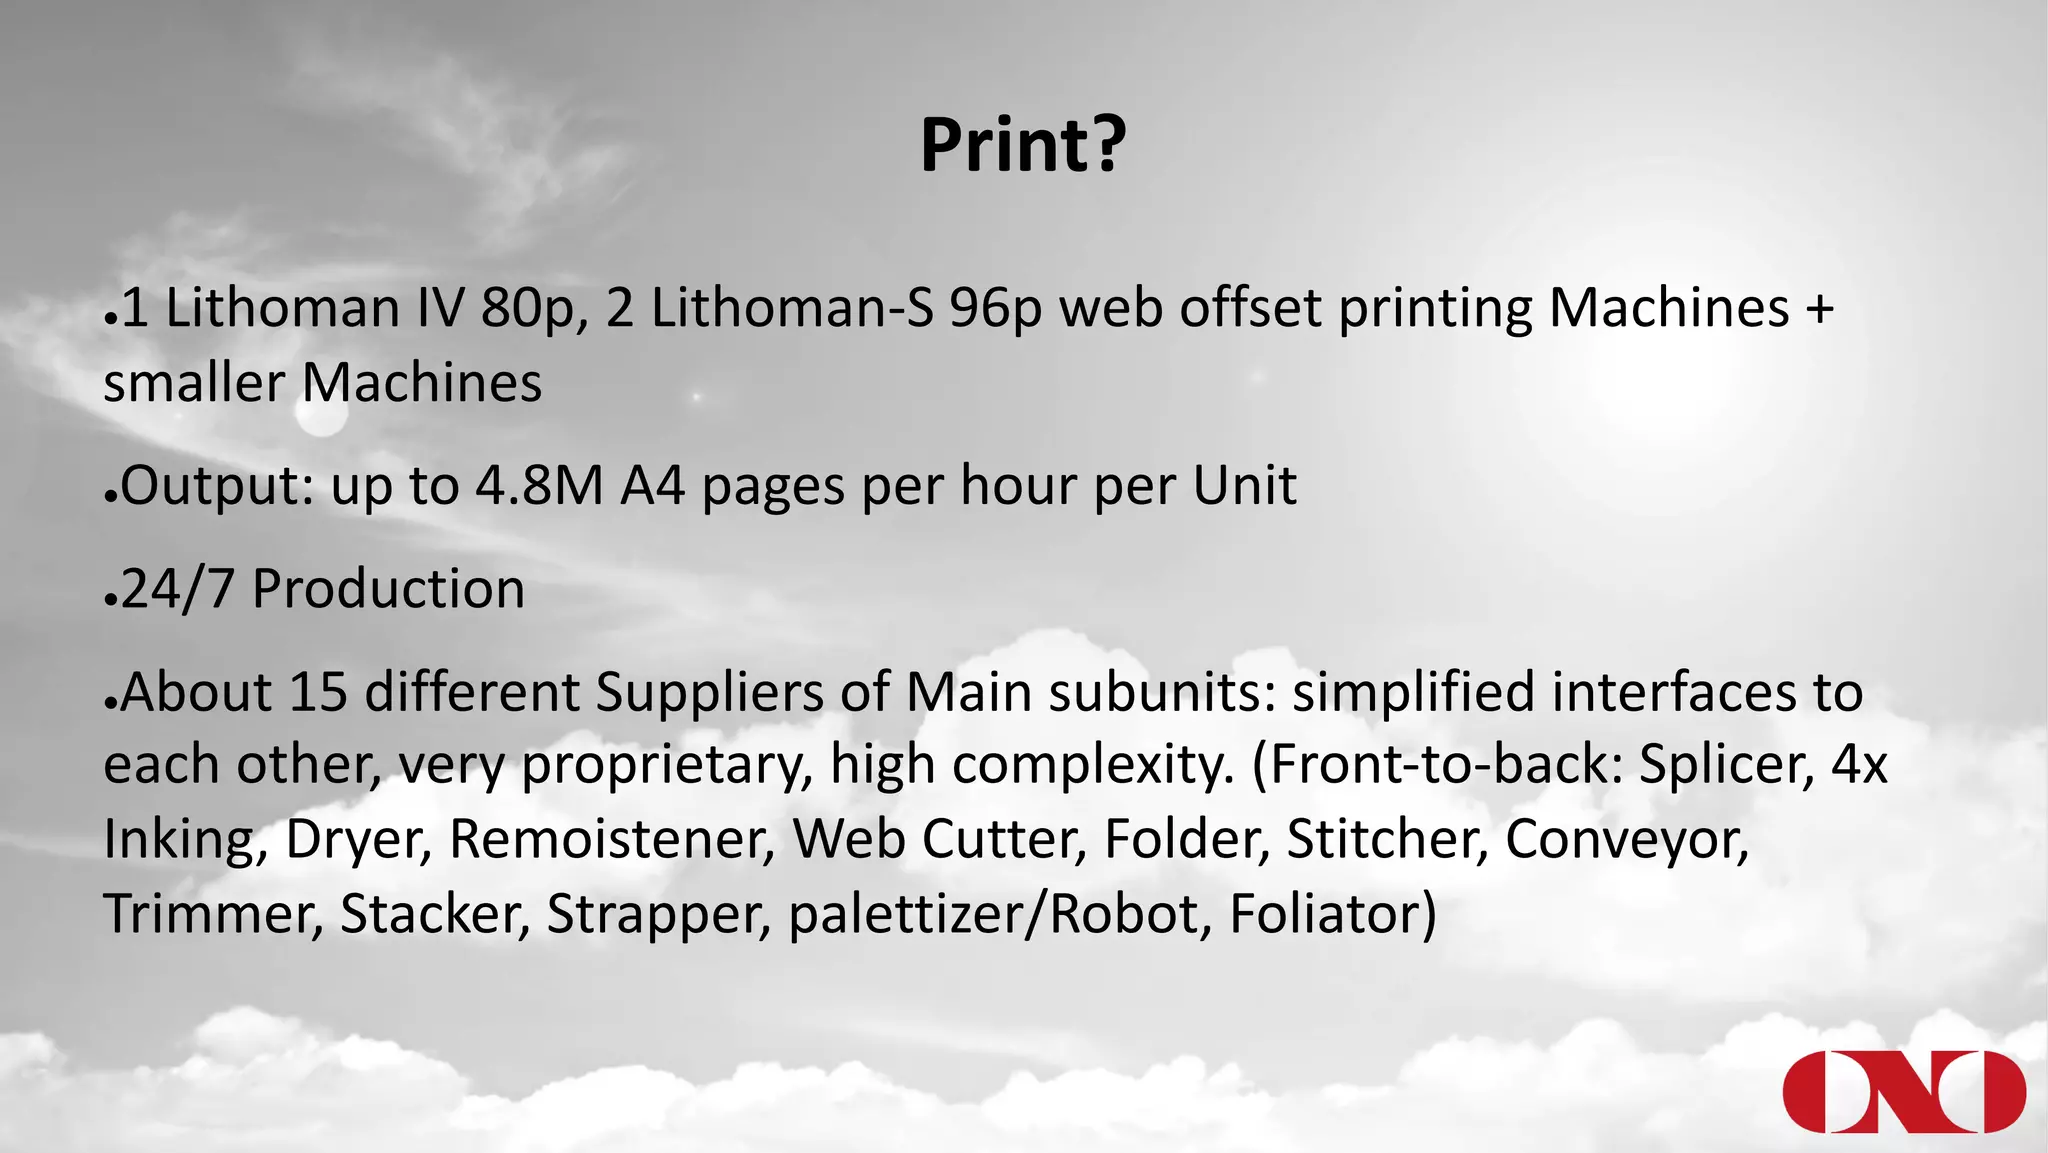
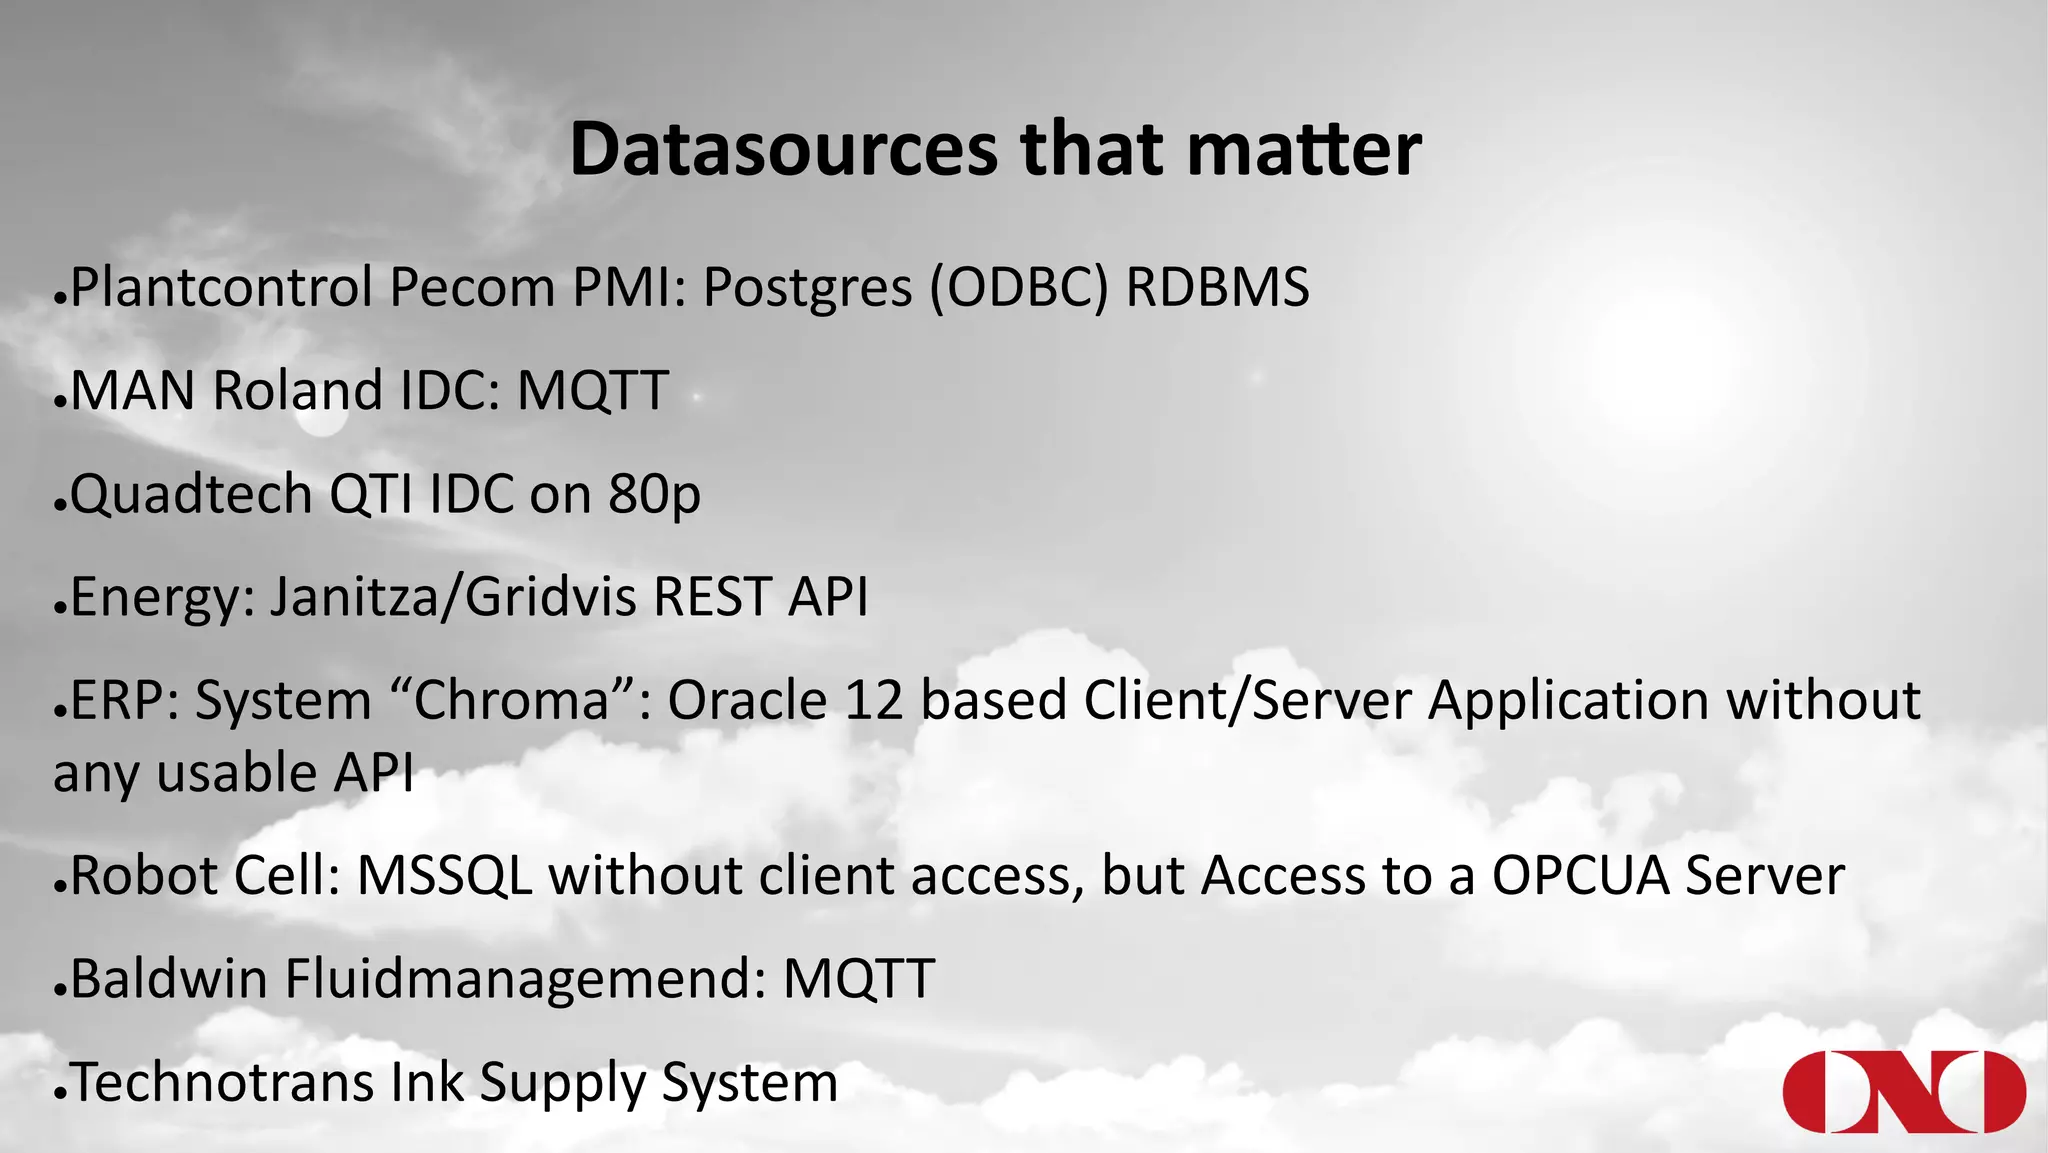
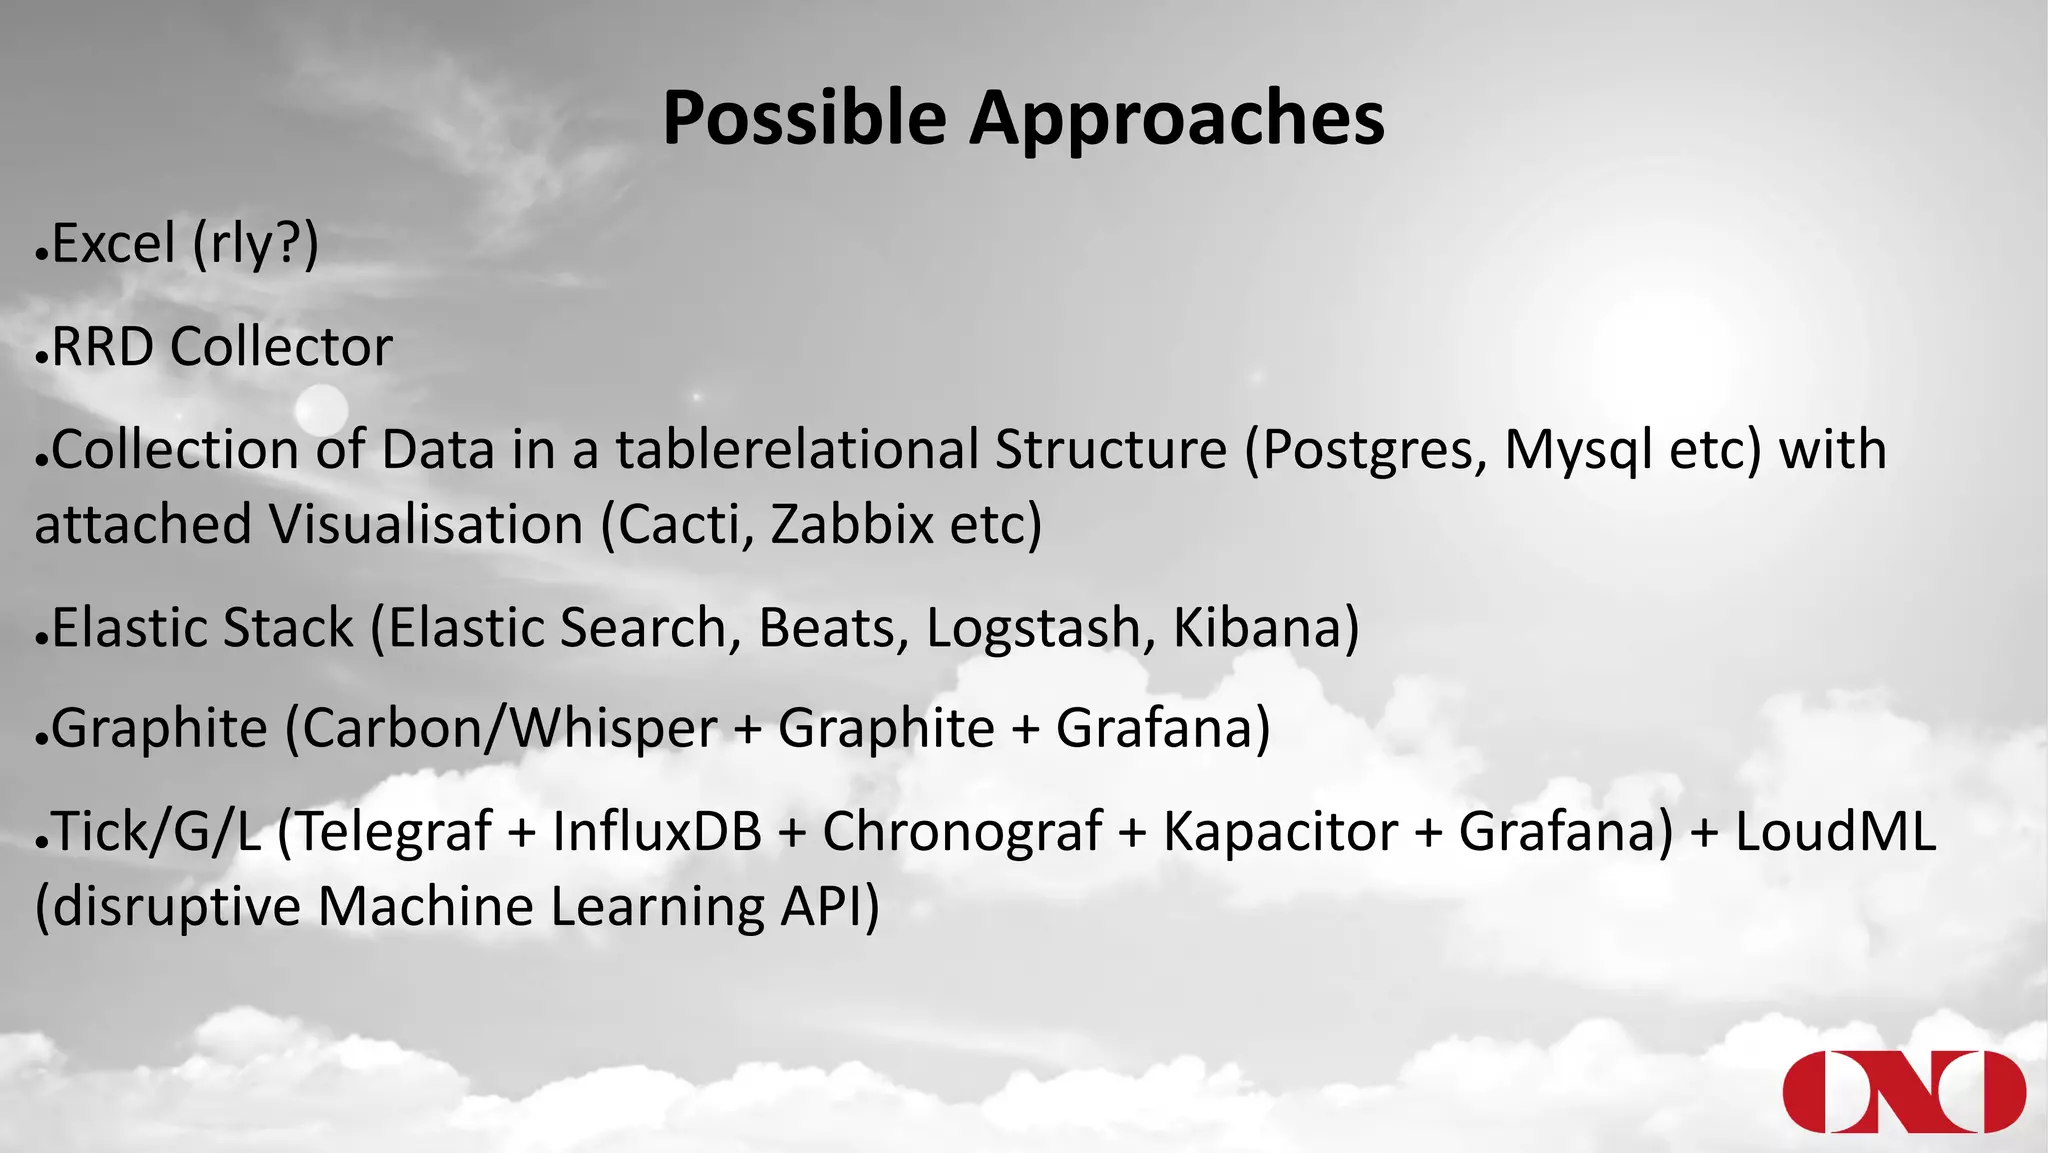
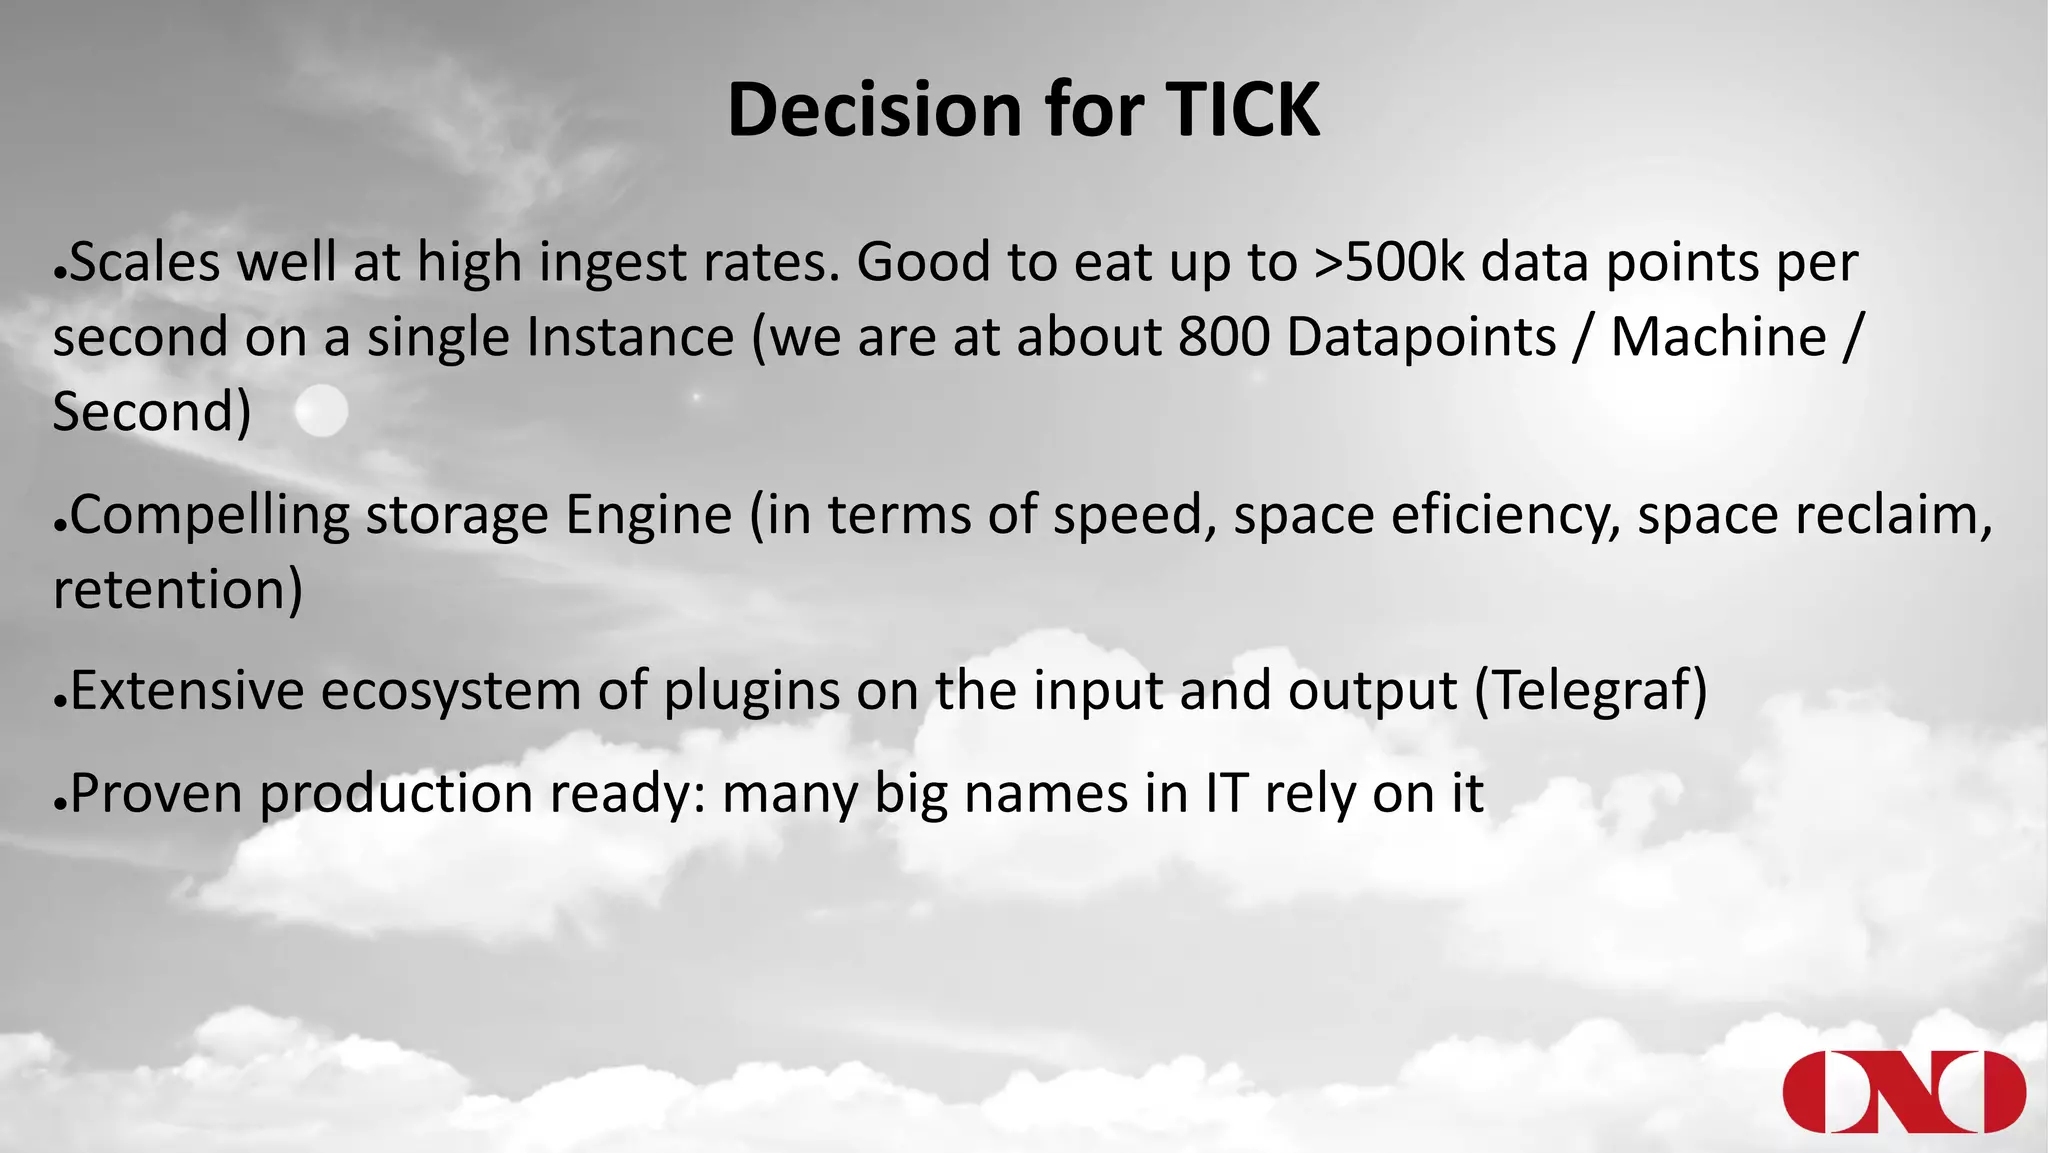
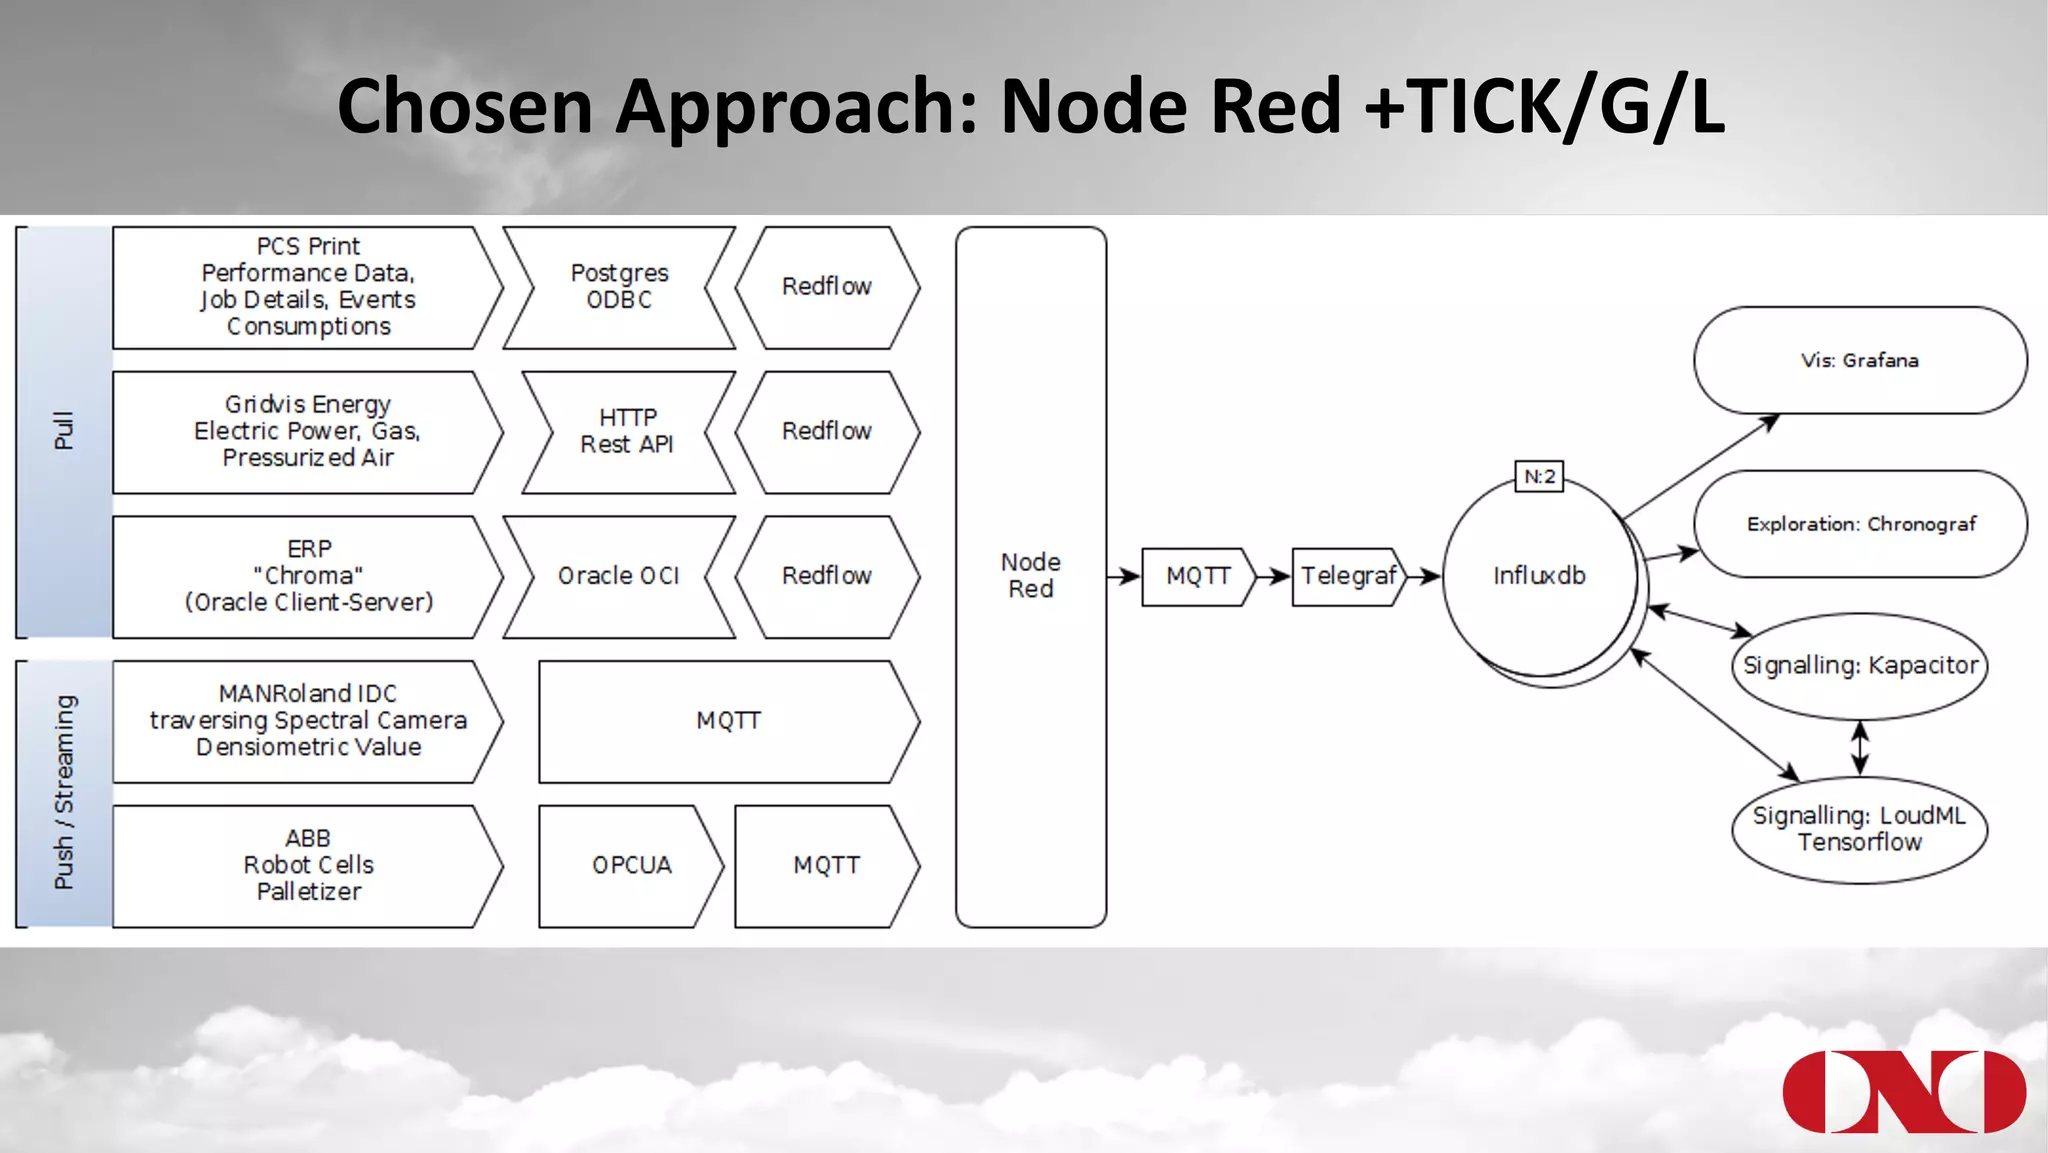
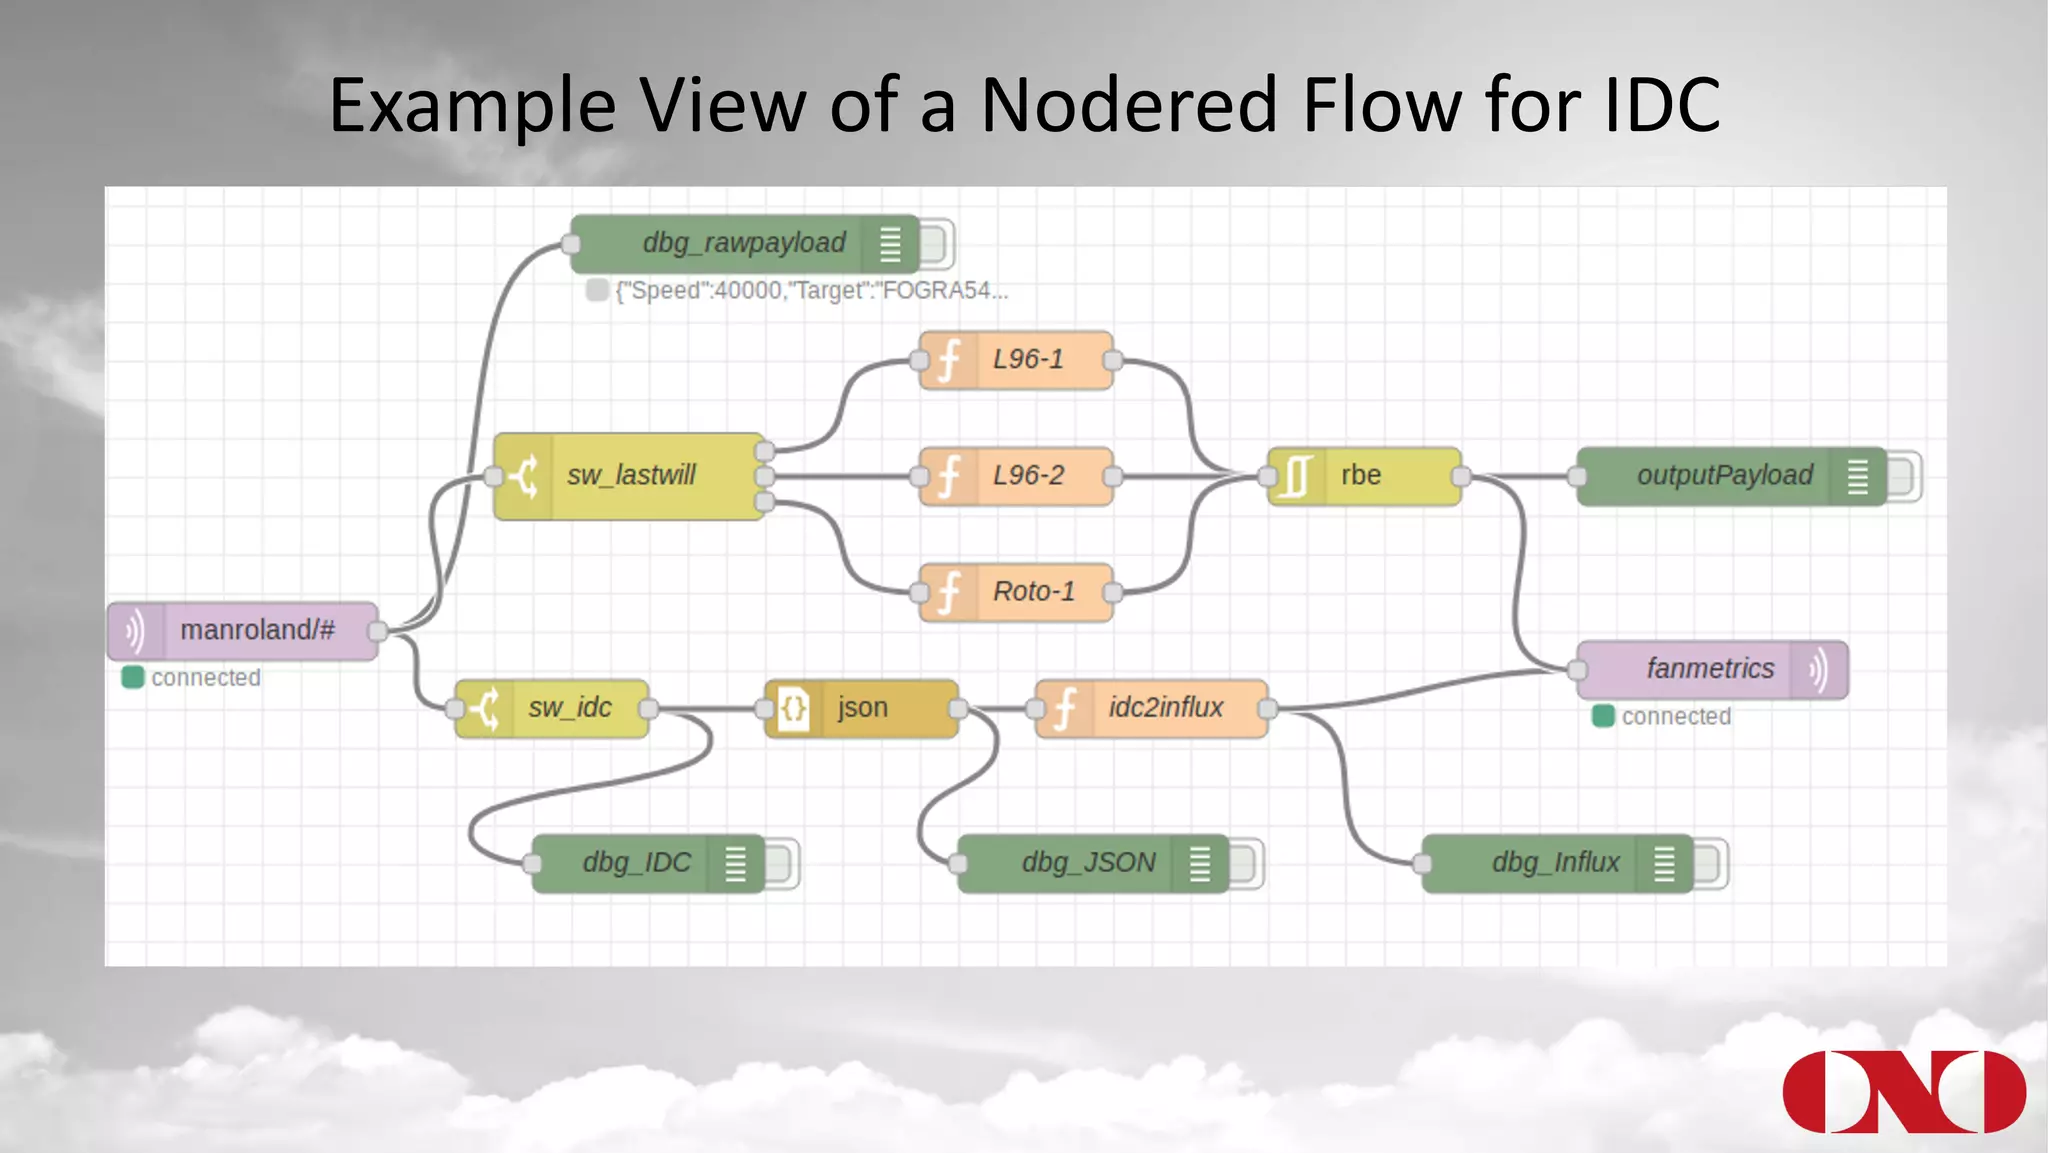
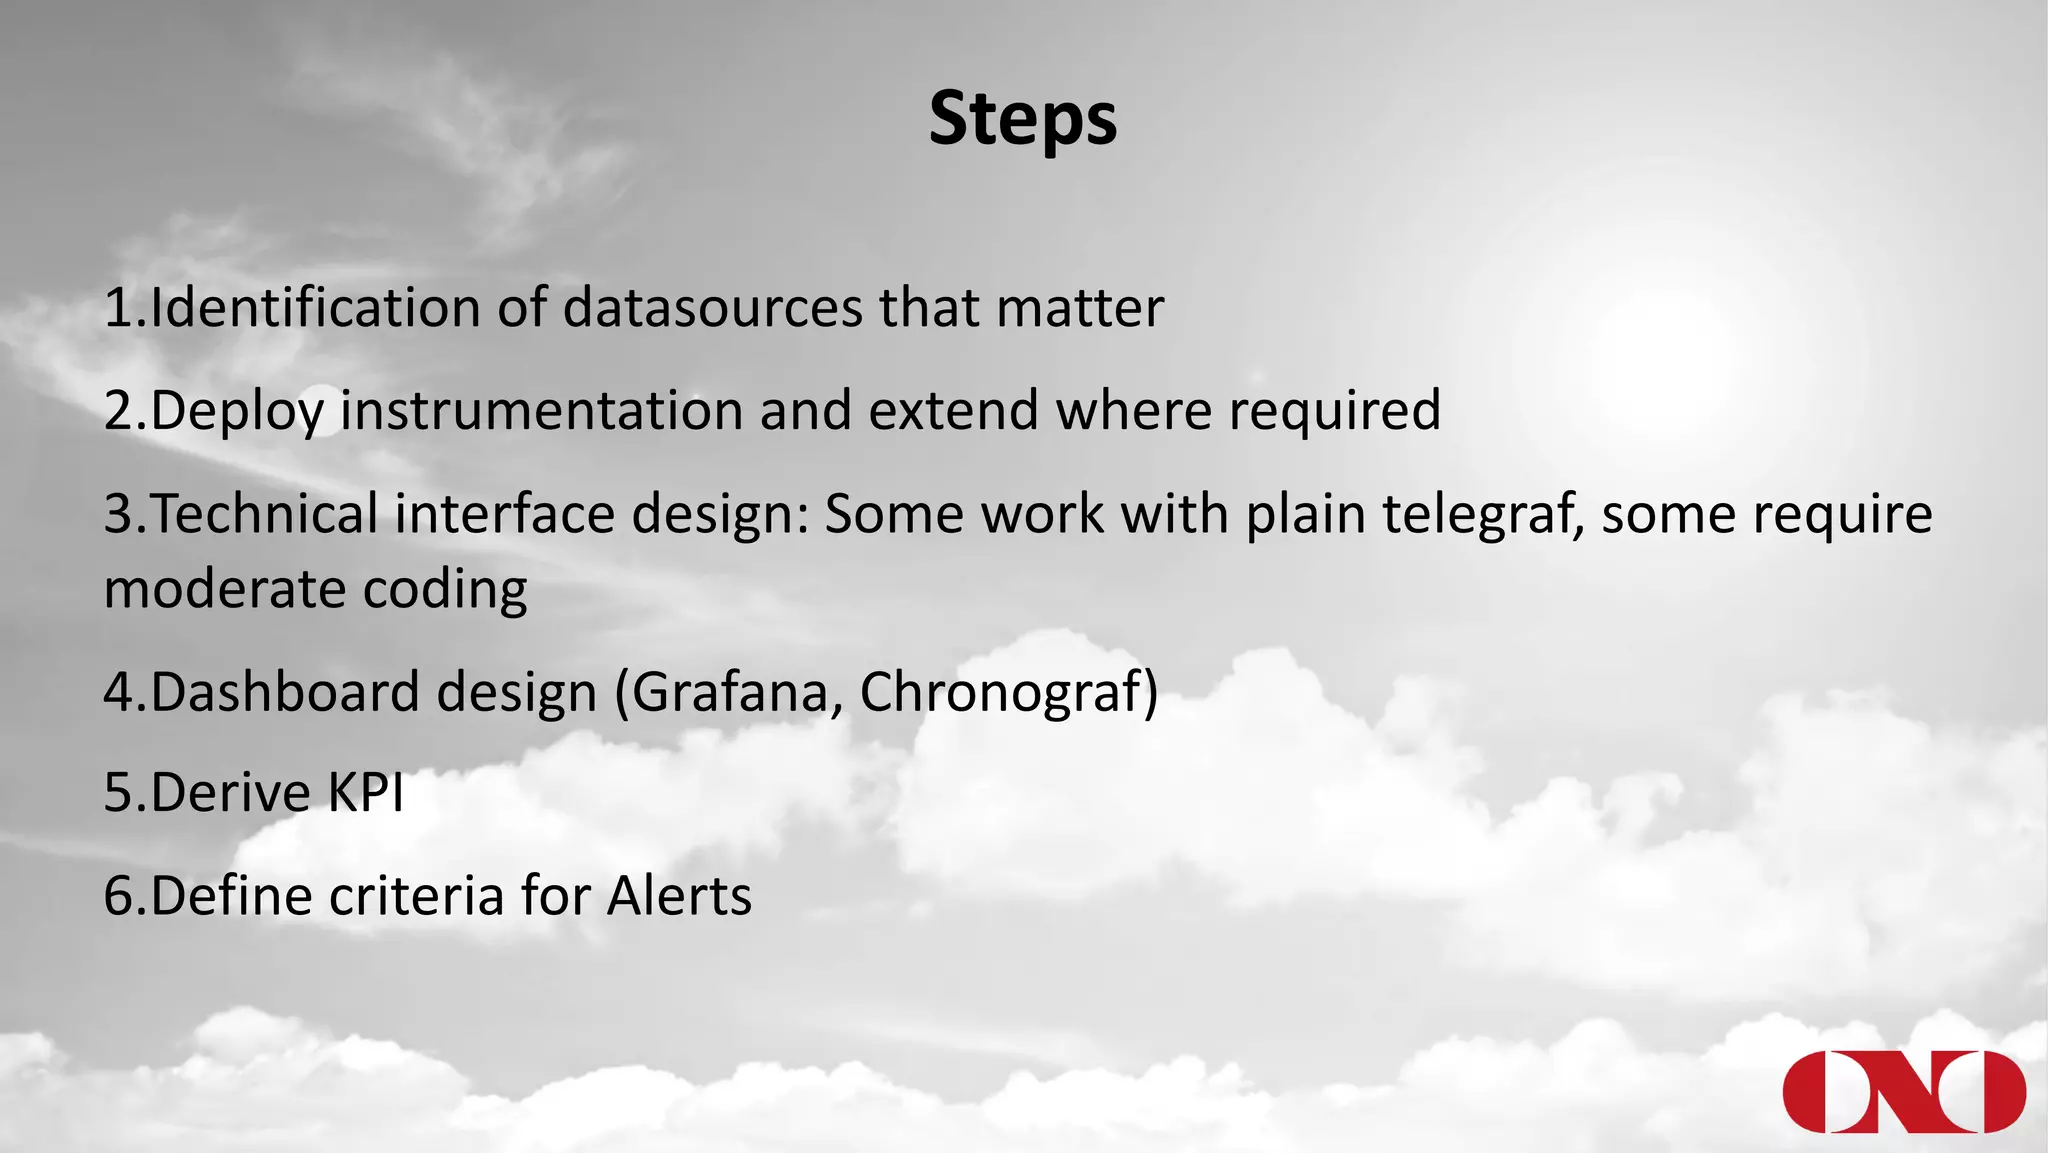
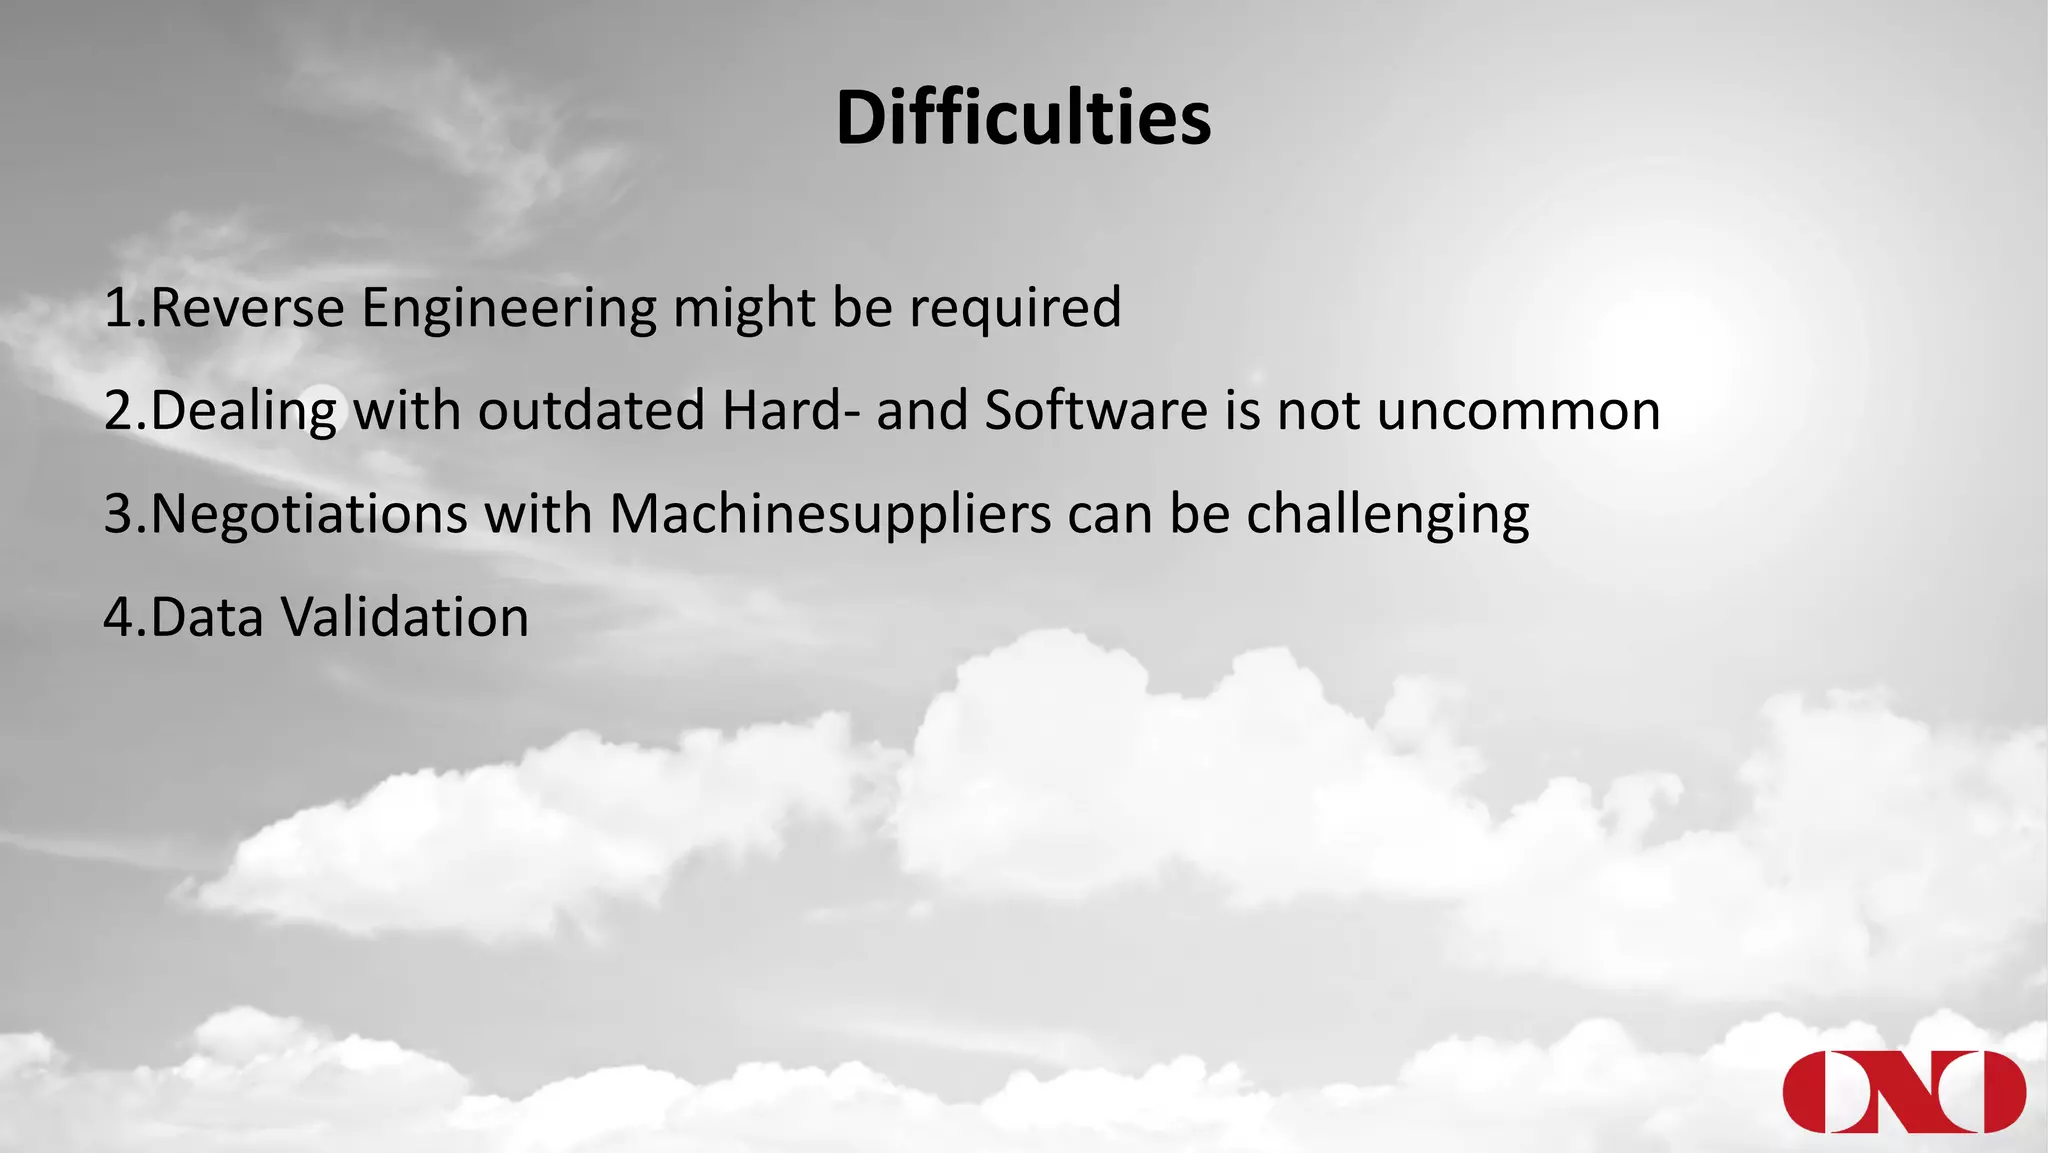
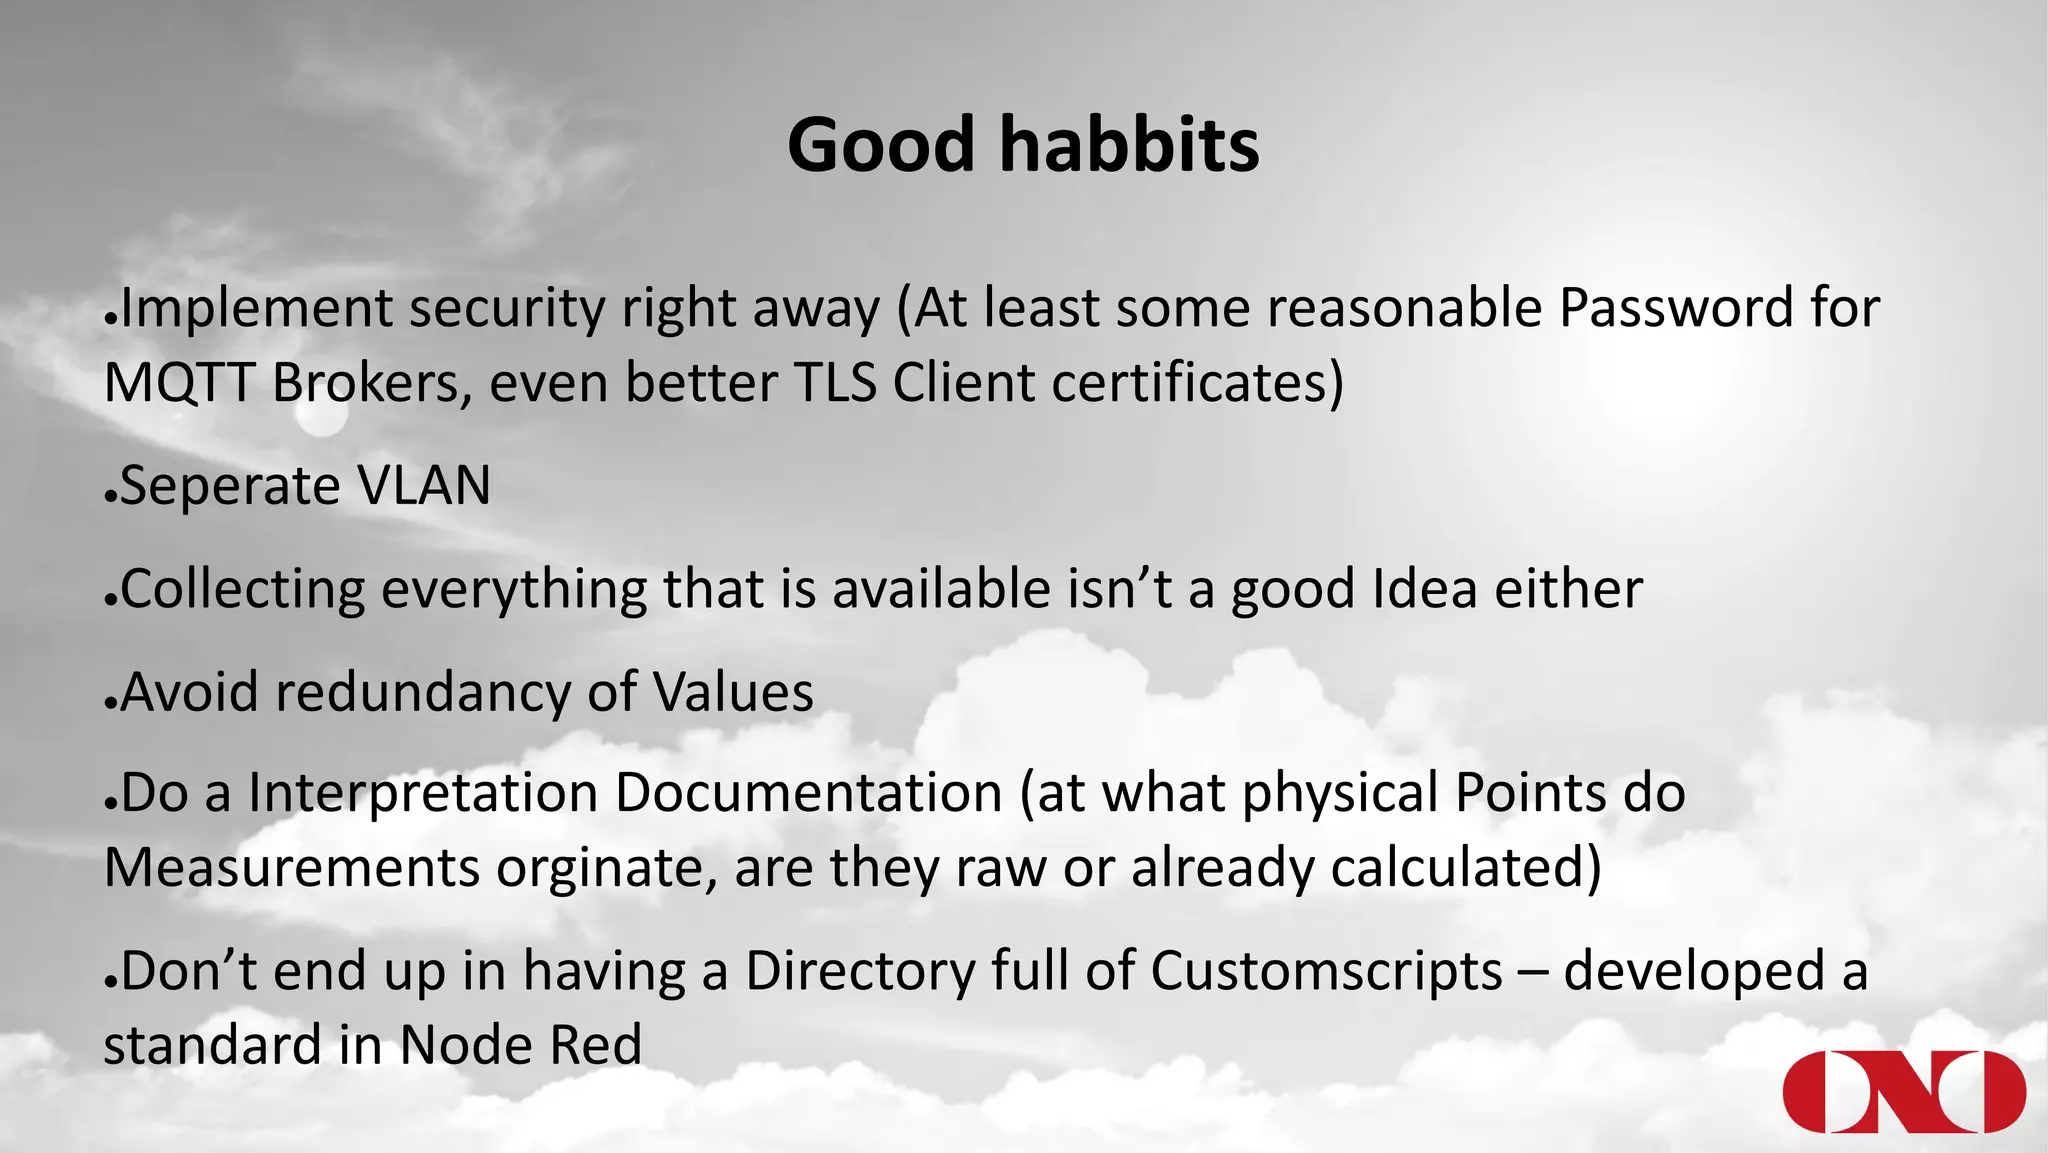
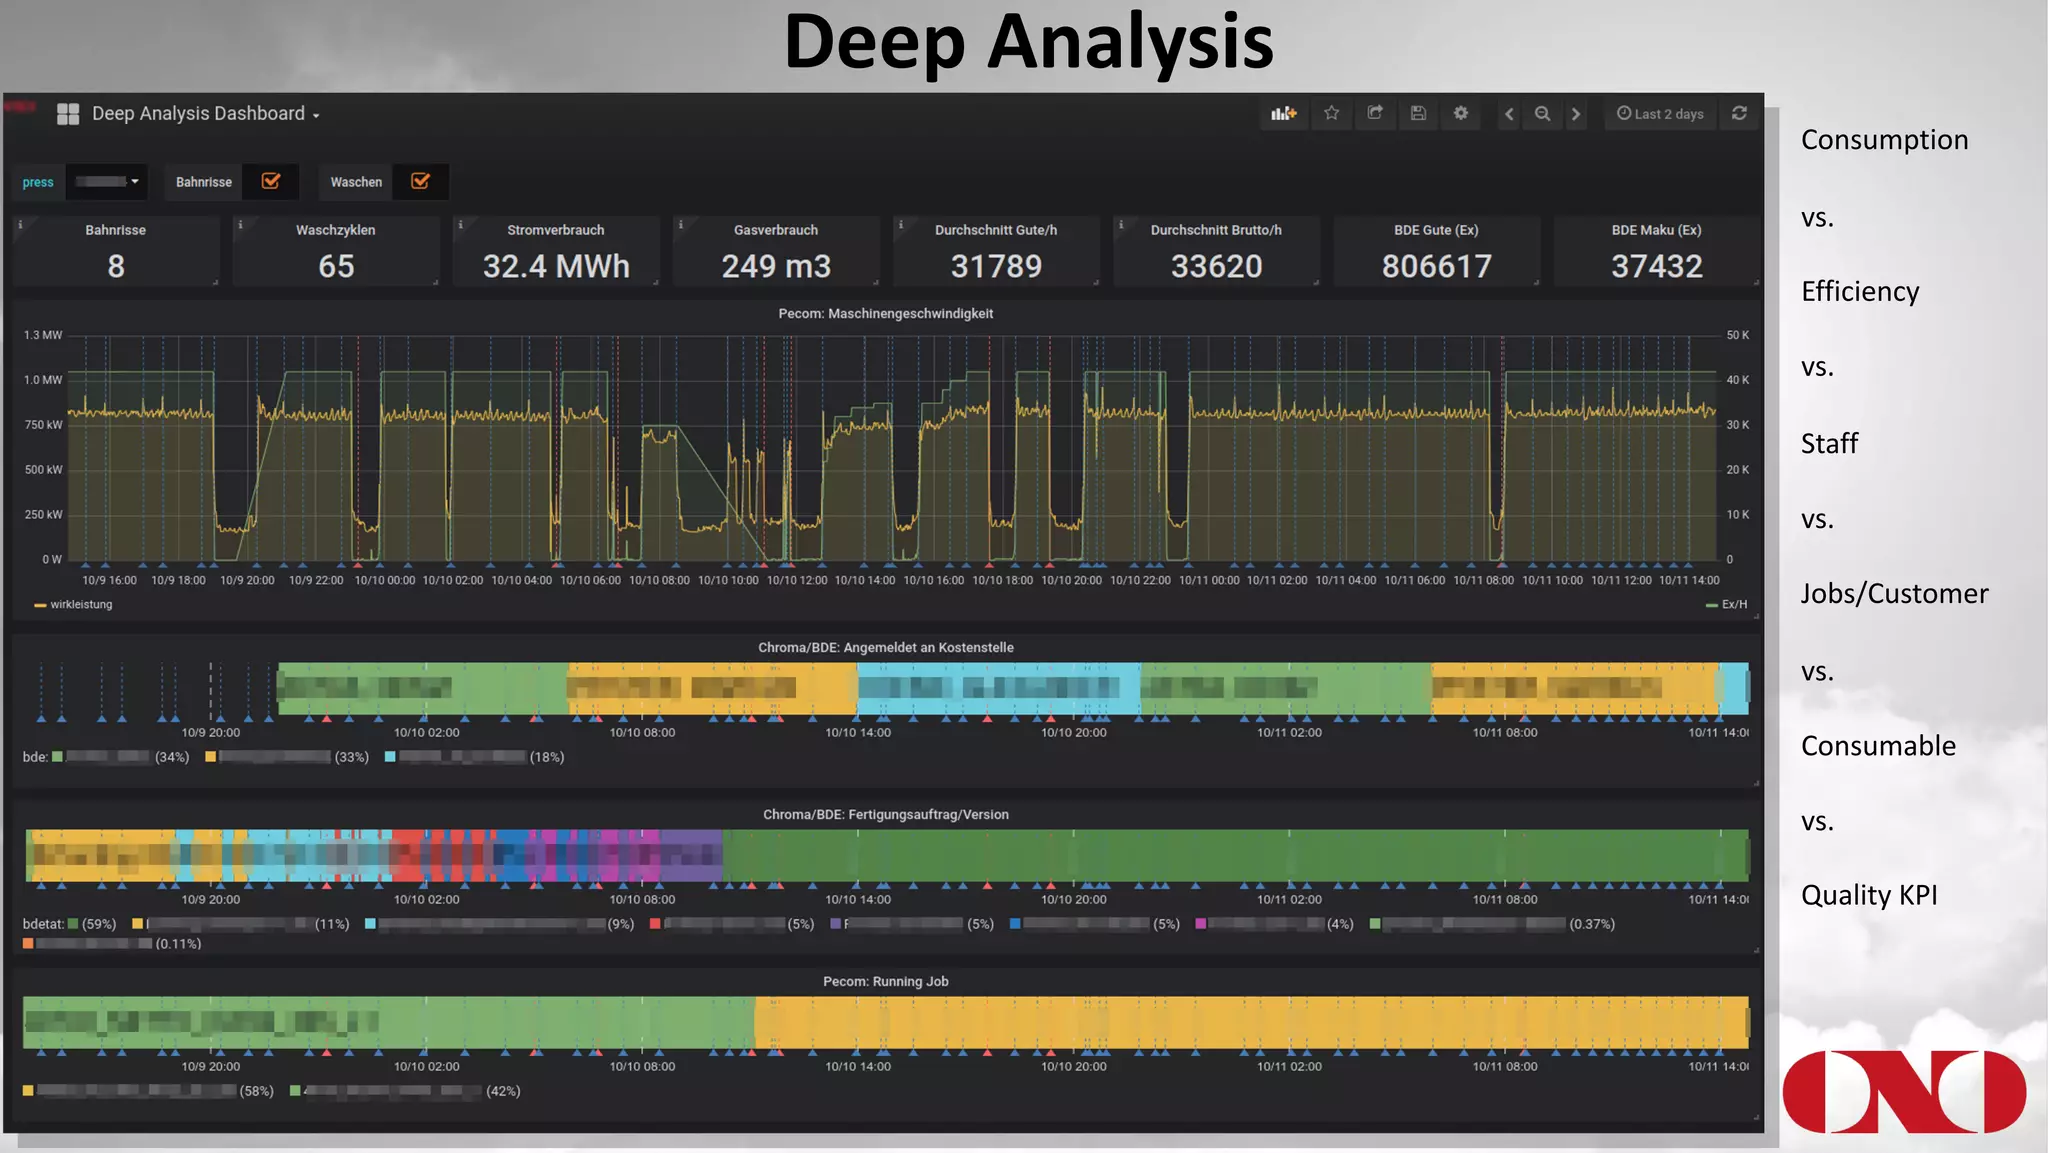
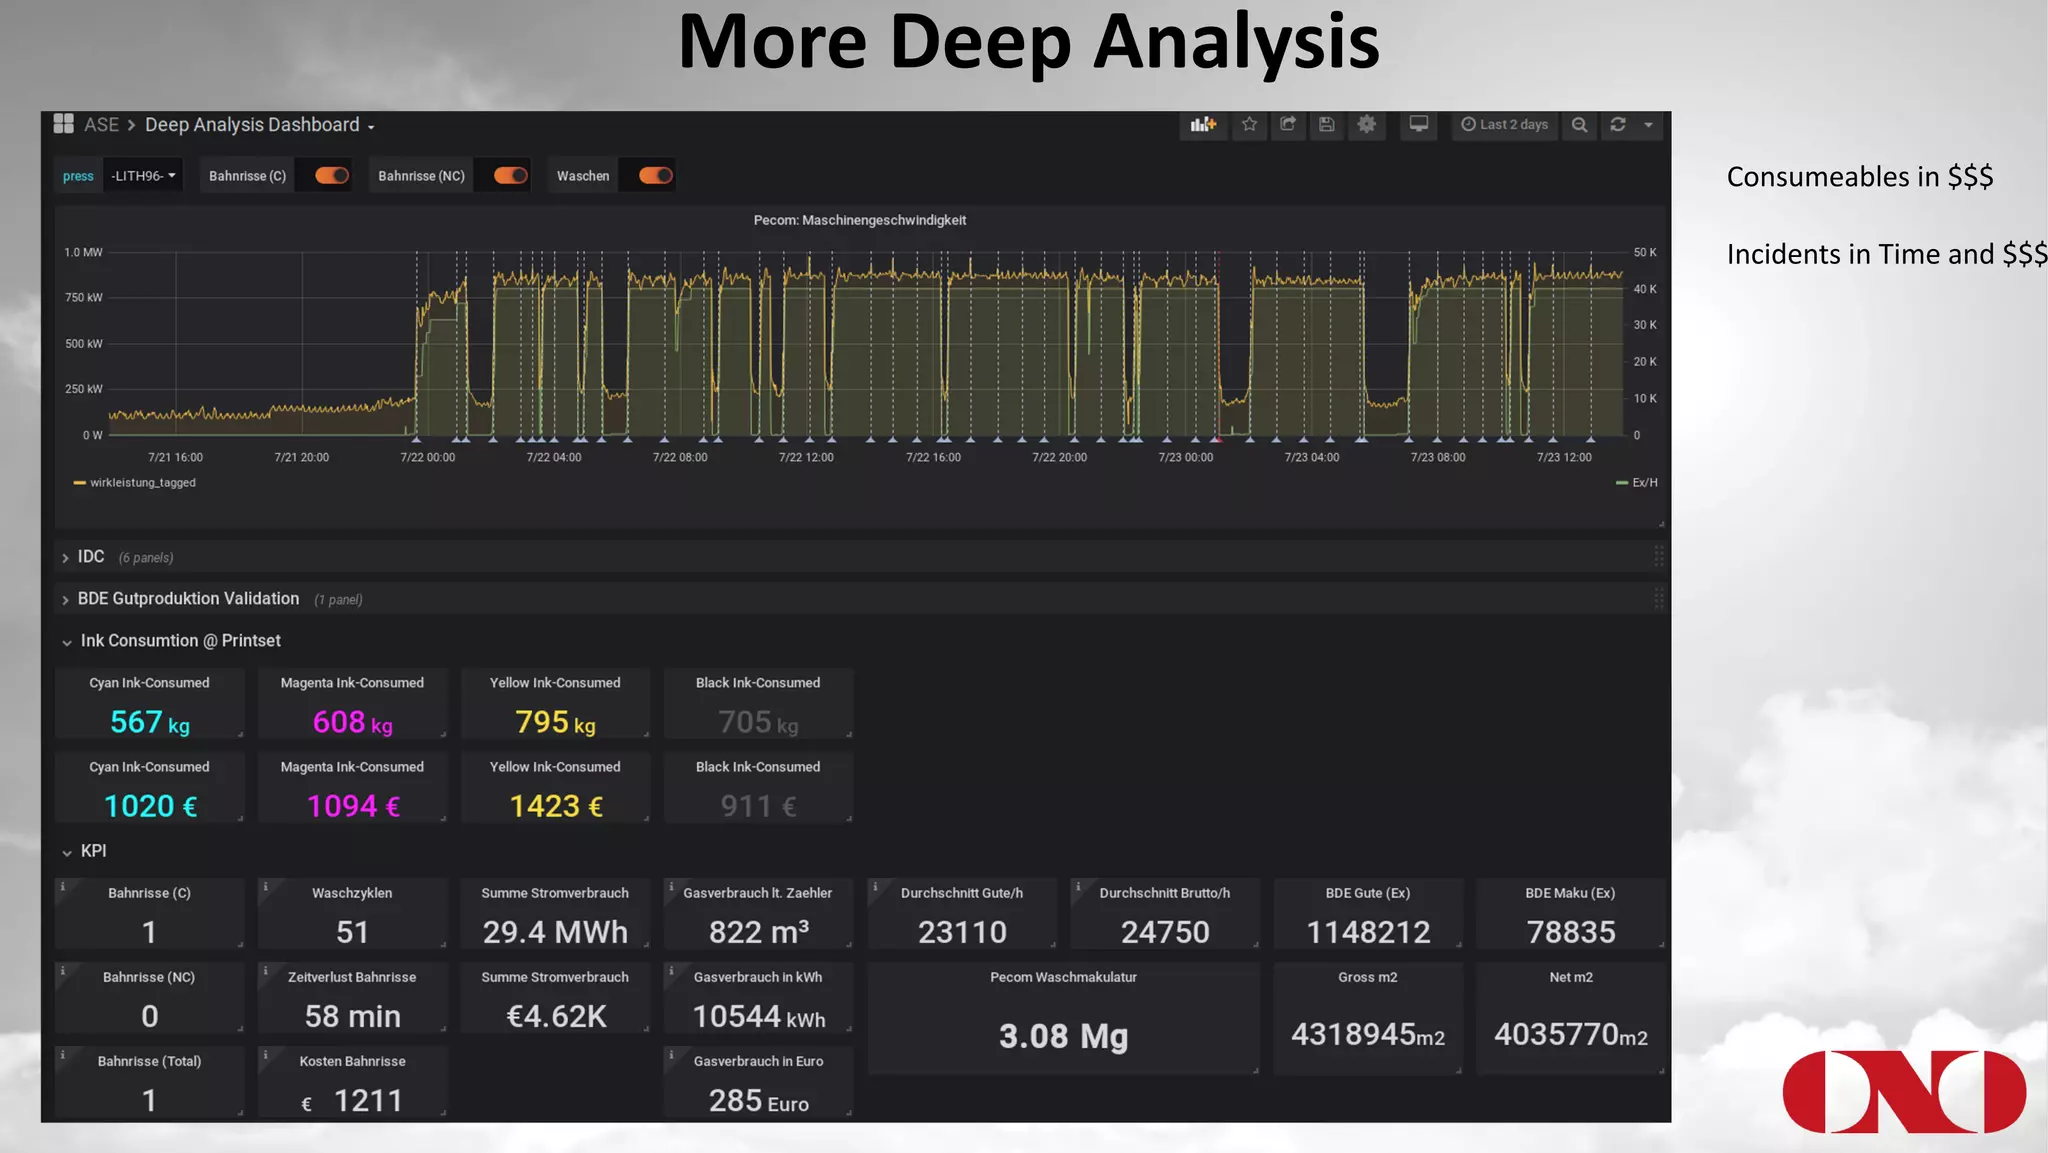
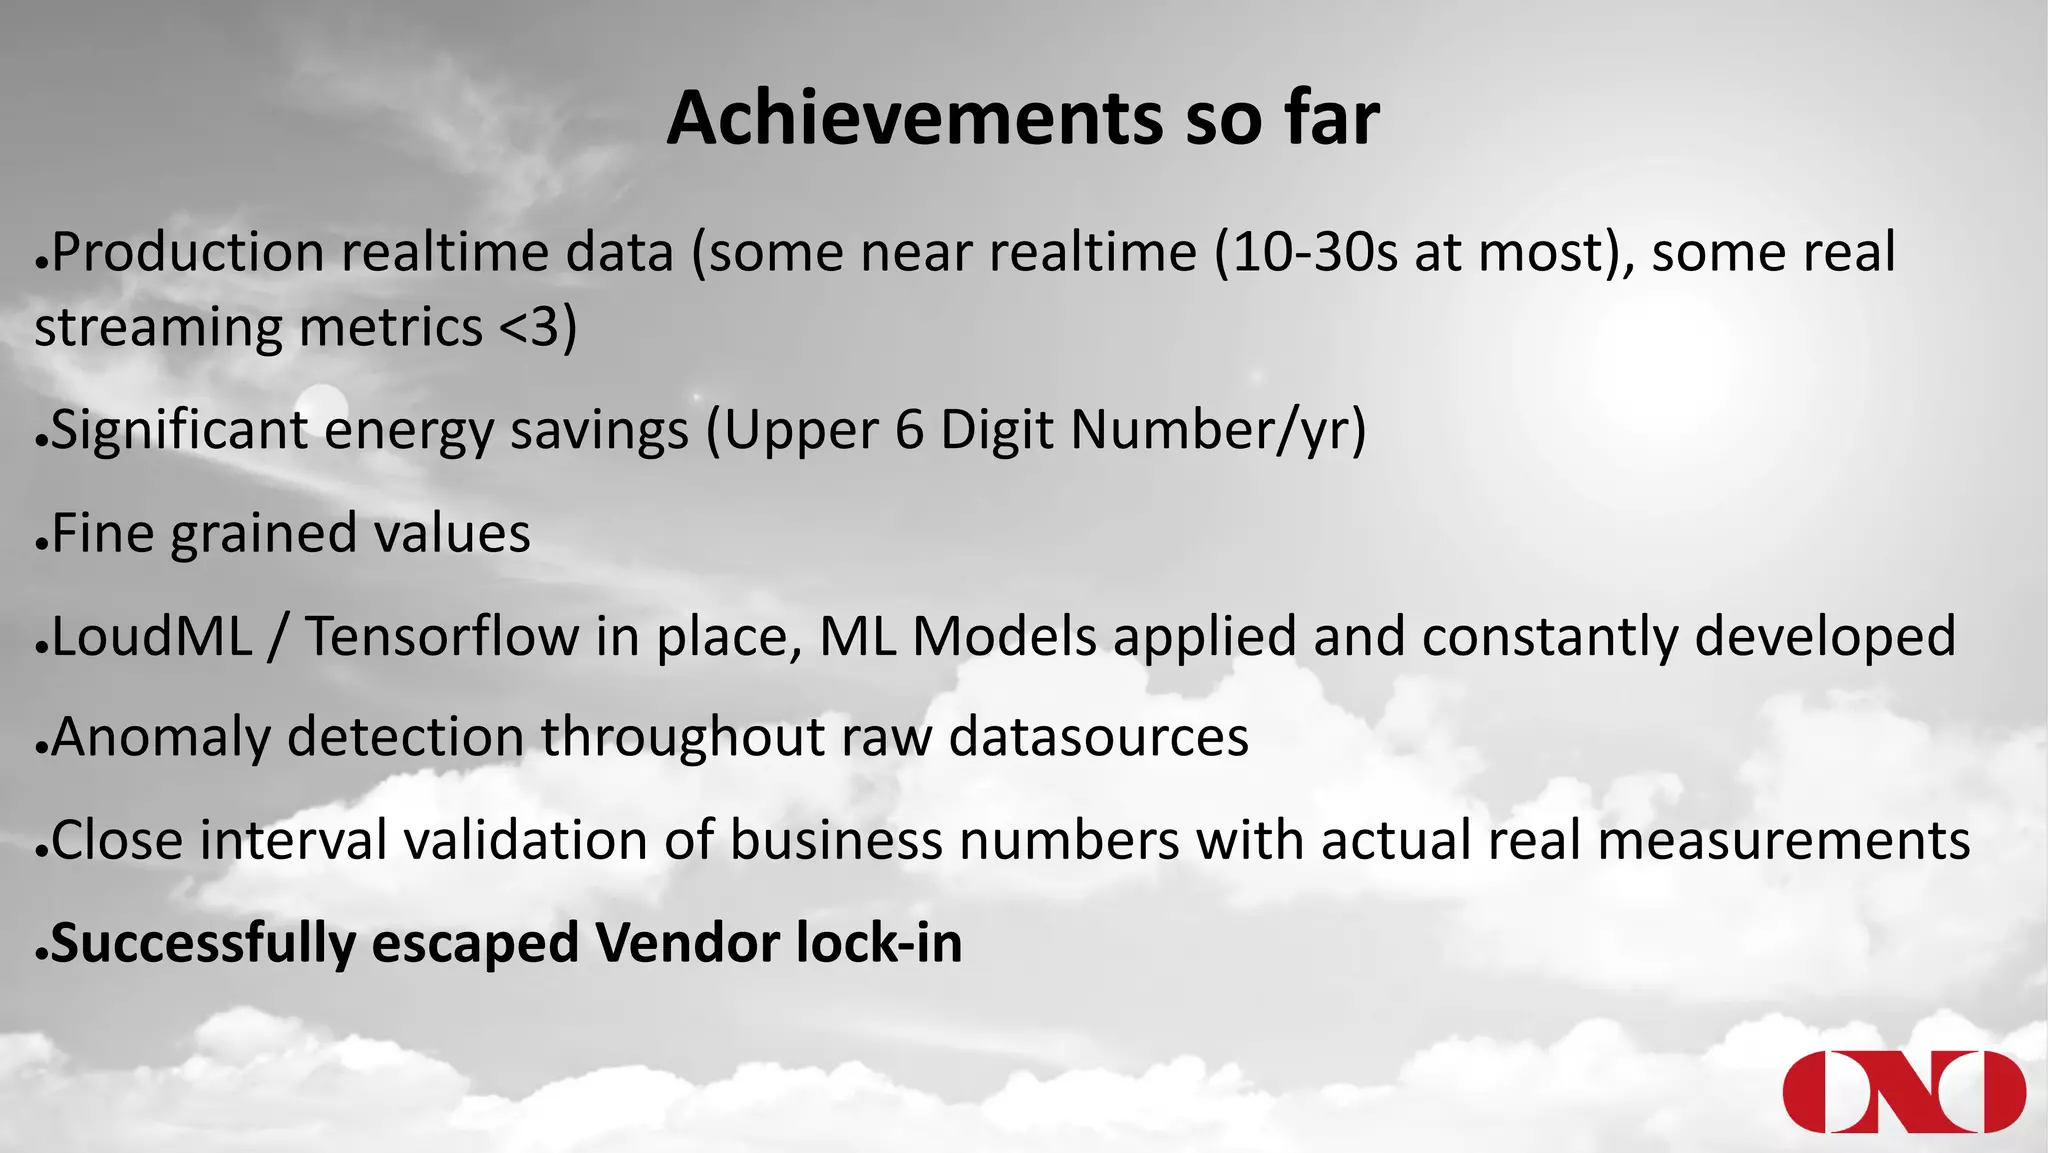
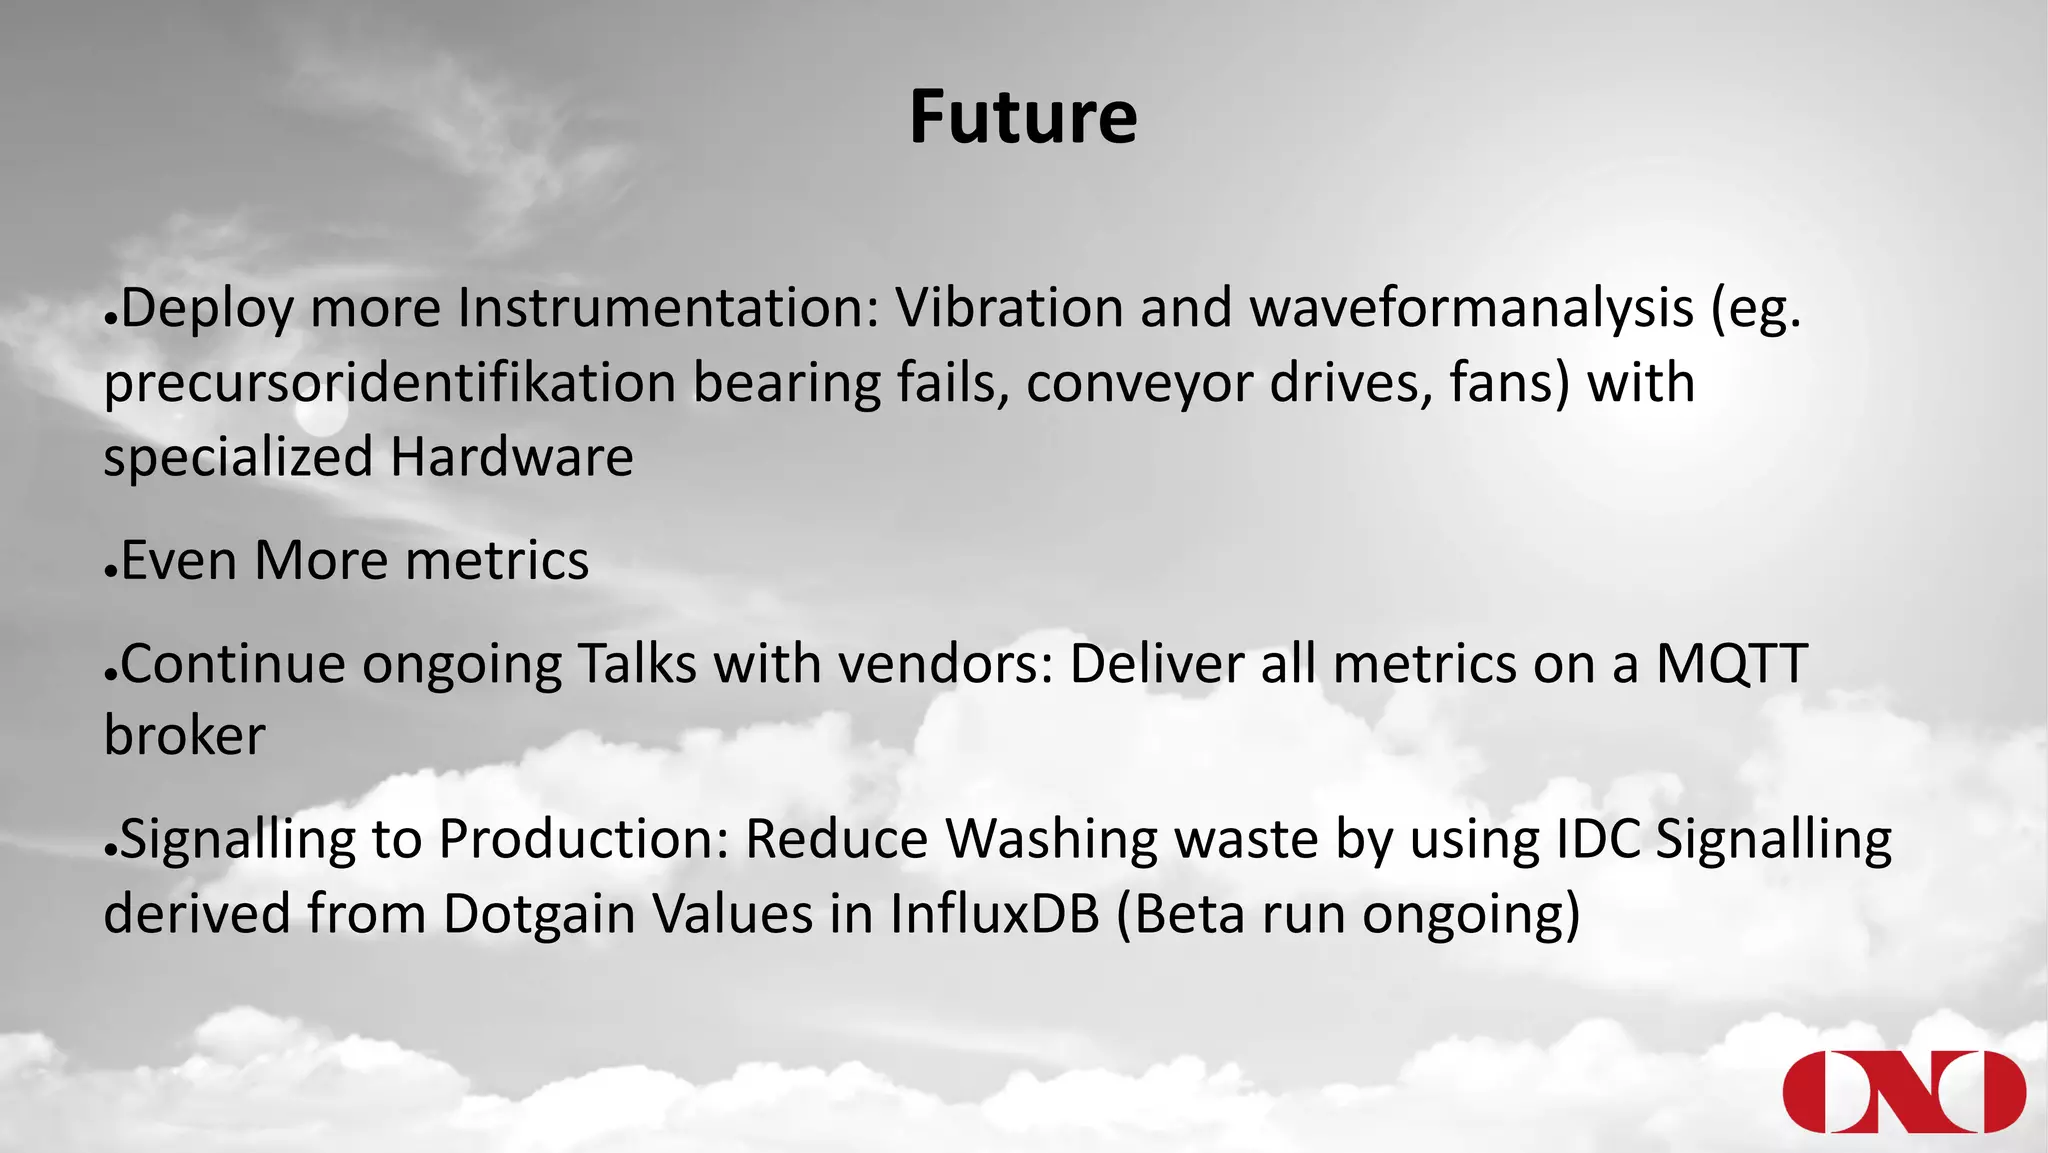

The document details a project by Fr. Ant Niedermayr GmbH & Co. KG that implements telemetry-driven production to enhance visibility and efficiency in their printing operations. Key goals included controlling processes, predicting outcomes, and cost savings, with emphasis on overcoming challenges posed by heterogeneous data sources and outdated technologies. A successful approach using the TICK stack has resulted in significant energy savings, improved data accuracy, and an ongoing plan for further instrumentation and metric analysis.


![Vasilis Papavasiliou [Mist.io] | Integrating Telegraf, InfluxDB and Mist to M...](https://cdn.slidesharecdn.com/ss_thumbnails/vasilispapavasiliouslides-210511200808-thumbnail.jpg?width=640&height=640&fit=bounds)


![Brian Gilmore [InfluxData] | Use Case: IIoT Overview | InfluxDays 2022](https://cdn.slidesharecdn.com/ss_thumbnails/usecaseiiot-gilmorereviewed-221020213120-a1d11a74-thumbnail.jpg?width=640&height=640&fit=bounds)


![Ward Bowman [PTC] | ThingWorx Long-Term Data Storage with InfluxDB | InfluxDa...](https://cdn.slidesharecdn.com/ss_thumbnails/influxdays-221027185325-5d2f430b-thumbnail.jpg?width=640&height=640&fit=bounds)
![Scott Anderson [InfluxData] | New & Upcoming Flux Features | InfluxDays 2022](https://cdn.slidesharecdn.com/ss_thumbnails/influxdays2022-fluxupdates-scott-221021210238-9d323cba-thumbnail.jpg?width=640&height=640&fit=bounds)
![Steinkamp, Clifford [InfluxData] | Closing Thoughts | InfluxDays 2022](https://cdn.slidesharecdn.com/ss_thumbnails/influxdays2022closingthoughtsday2-221020220104-abde55ea-thumbnail.jpg?width=640&height=640&fit=bounds)
![Steinkamp, Clifford [InfluxData] | Welcome to InfluxDays 2022 - Day 2 | Influ...](https://cdn.slidesharecdn.com/ss_thumbnails/influxdays2022welcometoday2-221020215815-c8463942-thumbnail.jpg?width=640&height=640&fit=bounds)
![Steinkamp, Clifford [InfluxData] | Closing Thoughts Day 1 | InfluxDays 2022](https://cdn.slidesharecdn.com/ss_thumbnails/influxdays2022closingthoughtsday1-221020215301-f8040e1f-thumbnail.jpg?width=640&height=640&fit=bounds)


![Vibe Coding vs. Spec-Driven Development [Free Meetup]](https://cdn.slidesharecdn.com/ss_thumbnails/vibecodingvsspecdrivendevelopment-251209105622-43f455e7-thumbnail.jpg?width=640&height=640&fit=bounds)


