Download to read offline
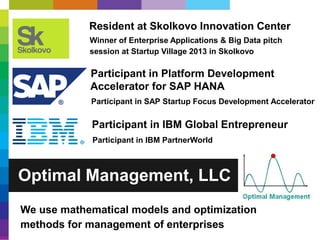

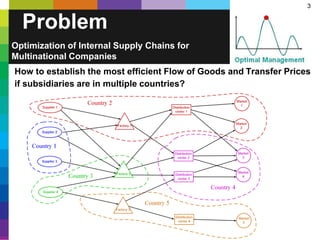


Optimal Management provides optimization services for multinational companies' internal supply chains to maximize after-tax profits. They use mathematical models and big data tools to simultaneously optimize product flows and transfer prices, increasing profits by 5-10%. Their team has expertise in optimization, supply chain management, and working with SAP and IBM. They are developing