
Recommended
Recommended
More Related Content
Similar to Optimal location of relief facility.pptx
Similar to Optimal location of relief facility.pptx (20)
Recently uploaded
Recently uploaded (20)
Optimal location of relief facility.pptx
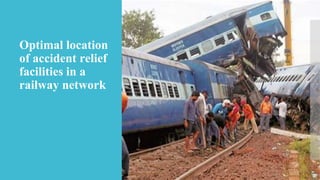
- 1. Optimal location of accident relief facilities in a railway network
- 2. Introduction & Motivation ● Indian Railway is the world’s largest railways network. ●It serves Indian populace with 7350 Railway stations ●64,600 route kilometers of track ●Runs 20000 pair of trains every day.
- 3. Introduction ●A fleet of over 12,000 locomotives ●74,000 coaches ●290,000 wagons ●serve a huge population of 130 million. ● On an average Indian Railway hauls about 23 million passengers ●Nearly 3.32 million tons of freight every day
- 4. Introduction to Disaster/accidents in Railways The paramount importance and vastness of the railway's network makes it vulnerable to accident, derailment, natural calamity and sabotage, that may cripple its entire operation. Indian railway has experienced few unfortunate accidents in the past years. An average of 110 accidents took place every year between 2013-2018, in which around 990 people were killed and 1,500 injured
- 5. Introduction to Disaster/accidents in Railways To mitigate the impact of accidents or disasters, the Indian Railway has a dedicated fleet of rolling stock nominated for housing re-railing and rescue equipment ART 175 ( 75 A class, 77 B class and 23 C class) ARME 162
- 6. Introduction to Current location of relief equipment These assets are located at important junctions throughout the country (Indian railway safety directorate, 2020). Primarily, the location of these facilities should be chosen such that it ensures the availability of relief at the accident site within the least response time
- 7. Challenge in the problem 1. Uncertainty of location and magnitude of the accident and impossible to predict. 2. The number of relief facilities are limited. 3. Constraints on the selection of location of the location. 4. The optimal assignment of different types of relief trains across the network is challenging because several (uncertain) attributes need to be incorporated. 5. Siting of relief facilities should take into consideration multiple competing objectives.
- 8. Current practice in deciding location At present, the relevant decisions are based only on the ability of a relief facility to provide radial coverage.
- 9. The scope of the work This study makes the first attempt to fill this important gap and provides a tool to decision- maker.
- 10. The scope of the work ● In the present work , we undertake the challenging problem of determining the optimal location for different types of accident relief facilities in the Indian railway network following the concept of cooperative coverage.
- 11. Cooperative coverage concept and coverage of the node ●It is important to note that a node might need more than one relief facility, or it can be ‘covered’ by more than one facility sites. Thus, it is assumed that the demand nodes are getting co-operatively covered by the potential relief facilities. Following the terminology of cooperative coverage (Berman et al., 2011), we say that the relief facilities emit a signal that decays over distance and the demand node will receive such signal from all facilities. The nodes will get covered if the sum of signals received by it from all facilities exceeds a predefined threshold value
- 12. The scope of the work ●A multi-objective optimization program is presented with conflicting objectives. ●The applicability of this research to the practice is demonstrated through a case study of the rail network of the North Central zone of Indian railways. ●It is also shown that the proposed plan of reconfiguring the relief facilities would help increase the coverage of the nodes and coverage of the links of the considered network.
- 14. Description of Link ●Let S represent the set of stations that are normal stations or junctions. Then, we have a series of continuous arcs connecting the two possible nodes in the set S and such a combination of arcs are termed as 'links' in this work.
- 15. Description of Link Importance ●A link thus represents a set of nodes/stations in a segment. Each link will have unique characteristics in terms of track specifications, the flow of passenger and freight traffic, and vulnerability. ●Based on the above factors the importance of link varies in the network. The railway network can be presented in terms of Links and selected stations S or in terms of links and all nodes/vertices V.
- 16. Potential Locution station ●These relief facilities need to be located at the stations suitable for stabling them. The potential stations for siting the relief facilities are chosen based on functional, technical, and operational requirements of the respective facility for regular operation and maintenance. The availability of spare locomotive, crew and other manpower requirements is also considered while considering the facility location to avoid any additional cost of keeping and maintaining the facility
- 17. Depiction of network aAa aa b e f c d 1 21 3 4 Legend Node ART a Potential station AMRV Crane 1
- 18. Demand for facility ●The demand is assumed to be equally distributed over network and any node can be treated as demand point in the network. ●Accident can occur anywhere on the railway network, and hence each point on every link of the network is a potential demand point that might need accident relief facilities
- 19. Problem Statement The problem is to ensure that: ● a) Links are covered as per their importance; ● b) Overall coverage of the network gets maximized; ●c) Redundancy (i.e., additional availability of relief facilities) for the demand nodes gets maximized; and ●d) Overall response time to all the nodes in the network gets minimized.
- 20. Optimization Program (sets and Indices ) . Set of demand nodes in the network indexed by i Set of links in the network indexed by l Set of demand nodes on link l Set of potential locations (stations) for siting relief facilities indexed by j Set of relief facilities indexed by f, F = {ART, ARMV, Crane}
- 21. Optimization Program (Parameters) . Importance of link l (calculated as per the procedure detailed next) Travel time between nodes i and j by facility f Limit on number of facilities of type f that can be sited The threshold value for a facility of type f for coverage
- 26. Estimating Link Importance (Identification of factor) . A1. Total Number of passengers carrying trains operating in a section. A2. Total Number of loaded wagon goods trains operated in a section. A3. Total number of empty wagons move through a section. A4. Other miscellaneous traffic such as departmental material train (DMT), over dimension consignment (ODC), empty coaches, movement of ART, and light engine over the section.
- 27. Schematic representation of procedure to calculate the link importance Deciding the attributes for calculating link importance Expert’s opinion Calculation of attribute weights Data collection and processing Normalization of decision matrix Weighted Normalization of decision matrix Calculation of Zenith and Nadir points Calculate the distance for each criterion point to ideal and anti-ideal points Calculation of the relative closeness coefficient i.e.. Importance index AHP TOPSIS Extant literature
- 28. Estimating Link Importance (Identification of factor) . The weights obtained for criteria using AHP are: A1 0.6315 A2 0.1873 A3 0.096 A4 0.088
- 29. Obtain Initial pay off table (AUGMECON) . The first step of interactive AUGMECON is to obtain an initial payoff table for getting the maximum and minimum values of objective functions that are considered in the constraints. The Payoff table is typically constructed using lexicographic or hierarchical optimization approach. In this approach, a priority is set to each objective and the optimization is carried out in the order of the priority.
- 30. Results and discussion (Initial Payoff Table for small instance ) . Objective 1 Objective 2 Objective 3 Objective 4 Objective 1 (Importance of all the links) 41.63 433.09 988 246.66 Objective 2 (Total coverage) 28.51 487.63 1039 307.56 Objective 3 (Redundancy in the system) 34.28 454.06 1065 294.48 Objective 4 (Overall, first response time) 38.81 411.18 958 245.22 Min 28.52 411.18 958 245.22 Max 41.63 487.63 1065 307.56 Range 13.11 76.45 107 62.34
- 31. ARFLP-AUGMECON .
- 32. Procedure for the interactive AUGMECON . Algorithm 1: Interactive AUGMECON Step 1: Obtain initial payoff matrix. Step 2: Selecting appropriate grid points and run ARFLP-AUGMECON. Obtain the set of non- dominated solutions. Step 3: Filter five different solutions from the set of solutions non-dominated solutions ensuring equal distribution of solution-on-solution space following Algorithm 2. Step 4: Present the filtered solutions to the decision-maker and select the most preferred solution by the decision-maker. Step 5: If the decision-maker is satisfied, STOP. Otherwise, go to Step 6. Step 6: lower bound of the jth objective function, in the next (i + 1) iteration. the minimum of the jth objective function over the entire Pareto set as obtained from the initial payoff table. Step 7: With the updated lower bounds on the objective functions, reconstruct the payoff table and then go to Step 2.
- 33. Algorithm: Filtering procedure . Input: Step 1: Step 2: Step 3: Step 4: Step 5: Step 6: Step 7: Step 8:
- 34. Solution Methodology (Schematic presentation of interactive AUGMECON procedure ) Interactive AUGMECON Method: Obtain a set of non-dominated solution using AUGMECON Filter 5 non-dominated solutions and present them to Decision Maker (DM) Most preferred solution by DM Is the DM Satisfied ? STOP Reduce the search space based on solution preferences of the DM START Yes No
- 35. Case study The NCR has around 3062 route km of broad gauge comprising predominantly, double line- electrified sections and 6366.77 km of total track length. It has a total of 443 stations, out of which 202 are at the mainline. Administratively, it is sub-divided into Prayagraj (Erstwhile Allahabad), Jhansi and Agra divisions. Thus, in terms of the size of the rail network, NCR zone itself surpasses several countries in the world
- 36. Map Of North Central Railways .
- 37. Input parameters for the case study . Parameter Description Number of nodes (stations) in the network 105 Number of links 132 Type of accident relief facilities ART, ARMV and Crane Number of accident relief facilities to be sited ART 13 ARMV 12 Crane 7 The average speed of the relief facilities 75 kmph Maximum allowable time (hours) ART 3 ARMV 2 Crane 4 ART 0.6667 ARMV 0.5 Crane 0.75 Number of candidate sites for the relief facilities Small instance 16 Large instance 33
- 38. Current status of the accident relief facilities . SR. NO. STATION NAME STATION CODE ZONE RELIEF FACILITIES ART ARMV Crane 1 Prayagraj PRYJ NCR ✓ ✓ 2 Kanpur CNB ✓ ✓ ✓ 3 Banda BANDA ✓ ✓ 4 Tundla TDL ✓ ✓ 5 Jhansi JHS ✓ ✓ ✓ 6 Agra AGC ✓ ✓ ✓ 7 Mathura MTJ ✓ ✓ 8 Gwalior GWL ✓ ✓ 9 Deendayal Upadhyay DDU ECR ✓ ✓ ✓ 10 Jaipur JPU NWR ✓ ✓ ✓ 11 Bina BINA WCR ✓ ✓ ✓ 12 Chopan CPU WCR ✓ 13 New Delhi NDRL NR ✓ ✓ ✓
- 39. Potential stations for siting the facility . In addition to the 13 stations that currently hosts relief facilities, the railway official suggested considering three more stations - Khajuraho (KURJ), Ghaziabad (GZB), and Mahoba (MBA) as the set of candidate locations ( In the study we have called it as small instance)
- 40. Results and discussion (Initial Payoff Table for small instance ) . Objective 1 Objective 2 Objective 3 Objective 4 Objective 1 (Importance of all the links) 41.63 433.09 988 246.66 Objective 2 (Total coverage) 28.51 487.63 1039 307.56 Objective 3 (Redundancy in the system) 34.28 454.06 1065 294.48 Objective 4 (Overall, first response time) 38.81 411.18 958 245.22 Min 28.52 411.18 958 245.22 Max 41.63 487.63 1065 307.56 Range 13.11 76.45 107 62.34
- 41. Results and discussion (Set of Pareto-optimal solutions by AUGMECON) . Sr. No. Objective 1 (Importance of all the links) Objective 2 (Total coverage) Objective 3 (Redundancy in the system) Objective 4 (Overall, first response time) 1 41.63 433.10 988.00 294.73 2 41.63 433.10 988.00 282.63 3 41.63 432.31 988.00 257.69 4 41.44 448.59 1004.00 295.09 5 41.44 448.59 1004.00 307.51 6 41.44 448.59 1004.00 270.16 7 41.44 448.59 1004.00 295.09 8 41.44 448.59 1004.00 282.01 9 41.23 454.67 1025.00 307.56 10 40.40 453.80 1057.00 307.55 11 40.40 453.80 1057.00 295.02 12 40.40 453.80 1057.00 307.57 13 40.40 453.80 1057.00 295.09 14 40.36 462.33 1051.00 295.08 15 40.36 462.33 1051.00 282.63 16 40.36 462.33 1051.00 282.61 17 40.36 462.33 1051.00 307.57 18 40.36 462.33 1051.00 257.45 19 38.65 476.18 1048.00 291.61 20 38.65 476.18 1048.00 307.55
- 42. Results and discussion (Set of Pareto-optimal solutions by AUGMECON) . Heat map for correlation coefficients of objective functions
- 43. Results and discussion (Set of Pareto-optimal solutions by AUGMECON) . Iteration Number Description Objective function values Objective 1 (Importance of all the links) Objective 2 (Total coverage) Objective 3 (Redundancy in the system) Objective 4 (Overall, first response time) Remark 1 Ideal solution (from payoff table) 41.63 487.63 1065 245.22 Solutions presented to DM Solution 1 41.44 448.59 1004 295.09 Solution 2 41.63 433.09 988 282.63 Solution 3 40.36 462.33 1051 282.63 Solution 4 40.36 462.33 1051 257.45 Selection by DM Solution 5 38.64 476.17 1048 291.60 Lower bound* 36.21 444.43 1018.45 274.88 2 Ideal solution (from payoff table) 41.23 468.56 1048 246.73 Solutions presented to DM Solution 1 41.23 454.67 1025 263.26 Solution 2 41.23 454.67 1025 253.58 Selection by DM Solution 3 40.36 462.21 1040 256.68 Solution 4 40.36 462.33 1050 243.69 Solution 5 39.73 468.56 1056 258.99 Lower bound* 36.78 439.45 1001.55 272.47 3 Ideal solution (from payoff table) 41.44 476.17 1056 243.45 Solutions presented to DM Solution 1 41.44 448.59 1025 263.27 Solution 2 41.23 454.67 1025 249.39 Selection by DM Solution 3 41.23 454.67 1025 263.86 Solution 4 40.36 462.33 1051 256.61 Solution 5 40.36 462.33 1051 247.68
- 44. Results and discussion (Insights ) . Several insights can be drawn from the results. We observed that in the interactive AUGMECON process, such as: 1. The decision-maker has consistently tried to increase the importance of the section covered by choosing an option with a higher objective function value than the current value for objective function (objective1) while keeping a check on the total response time in the network. 2. It is also found that the solution selected by the DM resembles quite a lot with the existing scenario of the location of relief facilities. The locations for ART and ARMV are the same in this solution and the current plan. Only, the allocation of the crane has changed at one place from the current station JHS to BANDA station.
- 45. Results and discussion (Insights) . 3.The existing plan of location of relief facilities could cover a total of 89 nodes out of 105 and 102 link sections out of 132 considered in our case study. It seems that the current method of thumb rule of radial coverage has worked well with the allocation of these facilities. 4.The proposed relocation of relief facilities resulted in the coverage of 91 nodes and 105 links. Therefore, the existing plan and proposed solution for siting the relief facilities do not vary much in the case of any comparison matrix. 5.We realized the roots of this issue are in the candidate locations suggested by the railway authorities. As mentioned before, only 11 locations were selected from the NCR zone based on their importance in the network, size of the station and required infrastructure and resources to host the relief trains.
- 46. Results and discussion (Constraints and further extension of the concept) . With this realization, we proposed to enlarge the search space with the addition of a few more candidate locations for siting the relief facilities and re-run the AUGMECON. The selection of new candidate is based on the fact, that, all the candidates are junction stations on the network providing flexibility of operation. The results are explained in the following sub-section
- 47. . Selection of New station For the large instance, we have considered 17 more junctions viz. CAR, NYN, MKP, LAR, DHO, BHA, AH, MHF, AWR, PWL, ALJN, SKB, MNQ, ETW, UDMR, BZM, KID, in addition to 16 junctions suggested by the railway authorities for the small instance
- 48. Results and discussion (Set of Pareto-optimal solutions by AUGMECON) . Objective 1 (Importance of all the links) Objective 2 (Total coverage) Objective 3 (Redundancy in the system) Objective 4 (Overall, first response time) Objective 1 (Importance of all the links) 44.13 426.06 967 238.16 Objective 2 (Total coverage) 26.07 605.74 1236 463.63 Objective 3 (Redundancy in the system) 26.07 561.79 1264 458.47 Objective 4 (Overall, first response time) 40.78 399.59 951 234.95 Min 26.07 399.59 951 234.95 Max 44.13 605.74 1264 463.63 Range 18.06 206.15 313 228.69
- 49. Set of non- dominated solutions with modified input . Objective function values Non-dominated solutions Objective 1 (Importance of all the links) Objective 2 (Total coverage) Objective 3 (Redundancy in the system) Objective 4 (Overall, first response time) Solution 1 44.13 442.90 970 463.3 Solution 2 44.13 442.52 972 348.1 Solution 3 44.13 440.48 973 292.1 Solution 4 44.04 466.00 1030 406.4 Solution 5 44.04 453.96 1032 349.3 Solution 6 44.04 455.21 1031 291.9 Solution 7 42.26 483.57 1108 349.2 Solution 8 42.13 516.22 1108 292.1 Solution 9 34.67 538.18 1186 406.5 Solution 10 34.67 521.58 1187 349.3 Solution 11 44.12 452.80 1009 463.6 Solution 12 44.12 452.42 1011 405.9 Solution 13 44.12 451.17 1012 349.2 Solution 14 44.12 452.42 1011 292.1 Solution 15 44.04 466.00 1030 463.6 Solution 16 44.04 455.21 1031 349.3 Solution 17* 44.04 460.78 1030 292.1 Solution 18 42.26 483.57 1108 406.4 Solution 19 42.26 481.91 1108 347.9 Solution 20 42.13 516.22 1108 292.1 Solution 21 34.67 538.18 1186 406.4 Solution 22 34.67 521.89 1186 349.3 Solution 23 42.37 503.26 1087 292.1 Solution 24 42.13 515.80 1108 292.0 Solution 25 34.67 515.93 1189 406.5 Solution 26 34.67 514.78 1186 349.3 Solution 27 35.96 555.82 1150 463.6 Solution 28 35.96 555.74 1151 406.4 Solution 29 35.96 557.11 1146 349.2 Solution 30 35.96 555.74 1151 349.3 Solution 31 34.42 557.98 1196 349.3 Solution 32 26.63 572.76 1265 463.6 Solution 33 44.04 455.21 1031 291.9
- 50. Comparative location plan for relief facilities Existing Small instance Large instance Sr. No. Station ART ARMV Crane ART ARMV Crane ART ARMV Crane 1 PRYJ ✓ ✓ ✓ ✓ 2 CNB ✓ ✓ ✓ ✓ ✓ ✓ ✓ ✓ ✓ 3 BANDA ✓ ✓ ✓ ✓ ✓ 4 TDL ✓ ✓ ✓ ✓ ✓ ✓ 5 GZB 6 JHS ✓ ✓ ✓ ✓ ✓ ✓ ✓ 7 AGC ✓ ✓ ✓ ✓ ✓ ✓ ✓ ✓ 8 MTJ ✓ ✓ ✓ ✓ 9 GWL ✓ ✓ ✓ ✓ ✓ 10 KURJ 11 MBA 12 CAR 13 NYN ✓ 14 MKP ✓ 15 LAR 16 DHO ✓ 17 BHA ✓ ✓ 18 AH 19 MHF 20 AWR ✓ 21 PWL 22 ALJN 23 SKB 24 MNQ 25 ETW ✓ 26 UDMR 27 BZM
- 52. Comparative different solutions Solution No. of nodes covered (out of 105) No of links Covered (out of 132) Nodes covered with redundant facilities ART ARMV Crane Existing plan 89 102 446 266 340 Small instance 91 105 446 266 313 Large instance 96 113 480 237 313
- 53. Observations (Small Instance) One crane has been relocated while keeping rest of the facility at the same location. Such rearrangement has resulted in a small improvement (2.33%) in value of Objective 1. While the values of remaining objectives have degraded as compared to the existing plan by 1.7%,2.57%,0.45% for Objectives 2,3 and 4 respectively.
- 54. Observations (large Instance) Objective function 1 (coverage of links as per the importance) is increased by 9.28 % from its counterpart in the existing plan. It has resulted in an increase in the number of covered nodes by 7.87 % and the number of covered links by 10.78% compared to the existing plan.
- 55. Observations (large Instance) This betterment in Objective function 1 has resulted in degradation in the remaining Objectives 2, 3 and 4. Nevertheless, the reduction in Objective function values of large instance for Objective 2 and 3 are as low as 0.37% and 2.09% as compared to the existing plan
- 56. Observations (large Instance) Further analysis also indicates that the proposed solution of large instance is providing better redundancy in the case of ART. On an average, each covered node in the network receiving the service from 3.26 ARTs, 2.5 ARMV and 5 Cranes. Therefore, even the reduced redundancy as compared to the existing plan does not affect much.
- 57. Observations (large Instance) Significant degradation is observed in the case of overall response time in the network which is increased by 17% for the large instance. Such an increase in travel time is justified due to increased coverage of nodes and links of the network.
- 58. Observations (large Instance) It is seen that significant improvement in the desired objectives is obtained without much compromise made through the utilization of the iterative process and consultation.
- 59. Observations Set covering model Existing Sr. No. Station ART ARMV Crane 1 PRYJ 2 CNB ✓ 3 BANDA 4 TDL ✓ 5 GZB 6 JHS ✓ ✓ ✓ 7 AGC ✓ ✓ 8 MTJ 9 GWL 10 KURJ ✓ 11 MBA ✓ 12 CAR ✓ ✓ 13 NYN ✓ ✓ 14 MKP 15 LAR 16 DHO ✓ ✓ 17 BHA 18 AH 19 MHF 20 AWR ✓ 21 PWL 22 ALJN 23 SKB 24 MNQ 25 ETW 26 UDMR ✓ 27 BZM ✓ ✓ 28 KID ✓ Newly sited 7 9 4 Existing 5 5 4 Total 12 14 8
- 60. Conclusion 1. The analysis has thrown open a completely new dimension of the problem for further research and study from different perspectives. This problem can now be addressed as an optimization problem with the objective to optimize between the 'new location to be opened' at a completely underdeveloped location by bearing the cost of development of the facility or locating more facilities at the developed and currently suitable place that entails the investment in procured of assets to enhance the coverage of the network. 2. Network considered in this work is a part of a bigger network of Indian railways. Future research on a holistic consideration of the entire network of Indian railways is a way ahead for the study
- 61. Conclusion 3. This avenue also calls for specialized solution approaches such as evolutionary algorithms to efficiently solve the problem due to the resulting size of the network. In addition to this, uncertainty related to the railway accidents and actual deployment of the relief facilities needs to be explored further. 4.The probability of accident on the links of the rail network can be considered from the past data and the model can be revisited using the two-stage stochastic programming or robust programming approach.
- 62. Conclusion 5.In addition to the uncertainty of the accident, several other practical considerations can be modelled efficiently using simulation study. We reserve these two aspects as future works. This work can also be extended as a part of a broader disaster management plan that includes several players in addition to the railroad operators. Such perspective can open avenues for emergency preparedness for other essential items, determining optimal placement of emergency health facilities in addition to the relief types of equipment, use of information and communication technology and internet of things in improving the response to the accident sites.