Downloaded 31 times


![Batch Request - POST /model/${id}/batch
batchLeads.json
curl -X POST --data-binary
@batchLeads.json -H "Content-type:
application/json"
http://ec2_endpoint/openscoring/model/Ba
yesLeadScore/batch
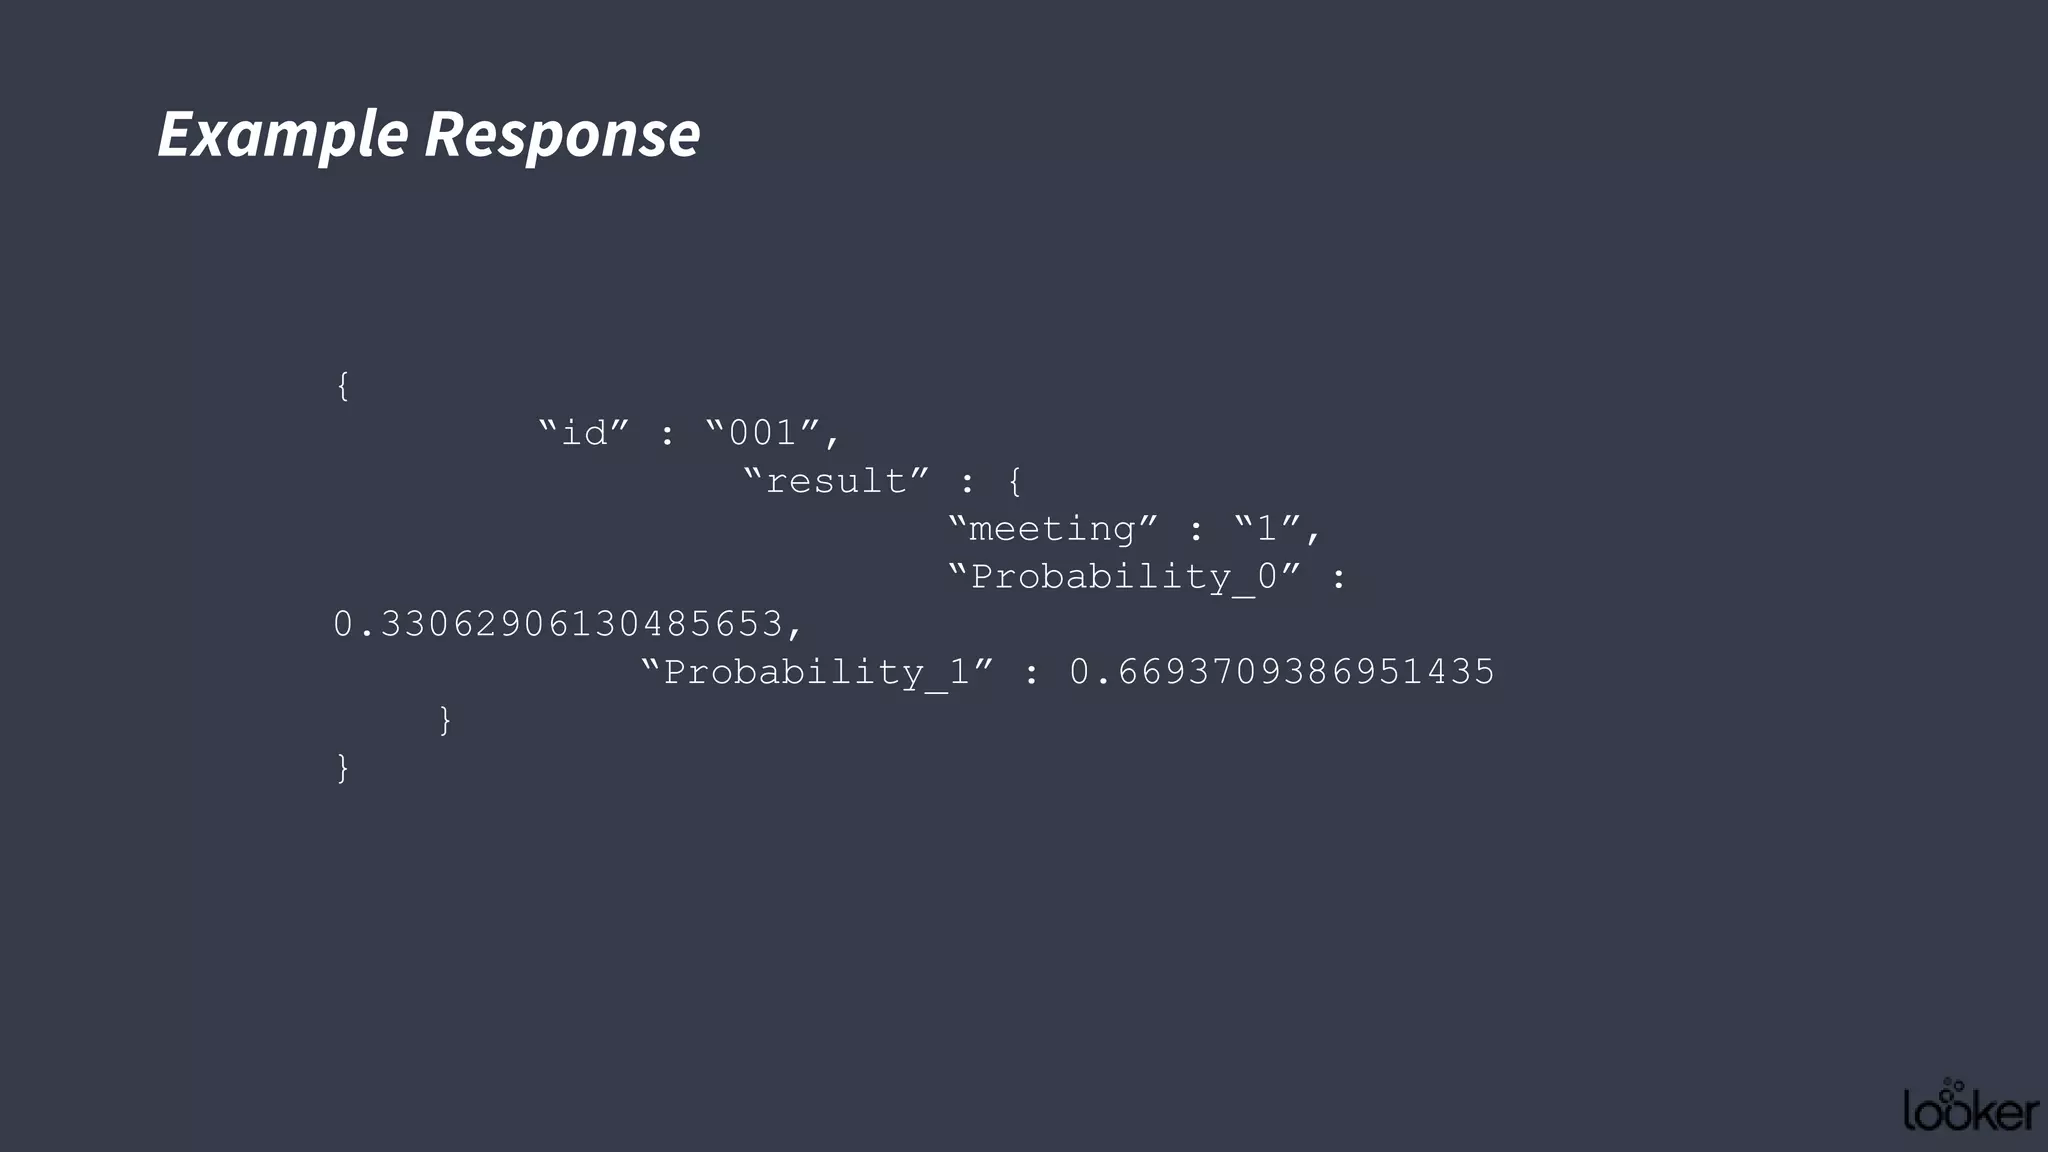
Send request to JPMML API
{
"id":"batch-1",
"requests":[
{
"id":"001",
"arguments":{
"country":"US",
"budget":7.8
}
},
{
"id":"002",
"arguments":{
"country":"CA",
"budget":3.2
}
}
]
}](https://image.slidesharecdn.com/operationalizinganalyticstoscale-150930172604-lva1-app6891/75/Operationalizing-analytics-to-scale-49-2048.jpg)


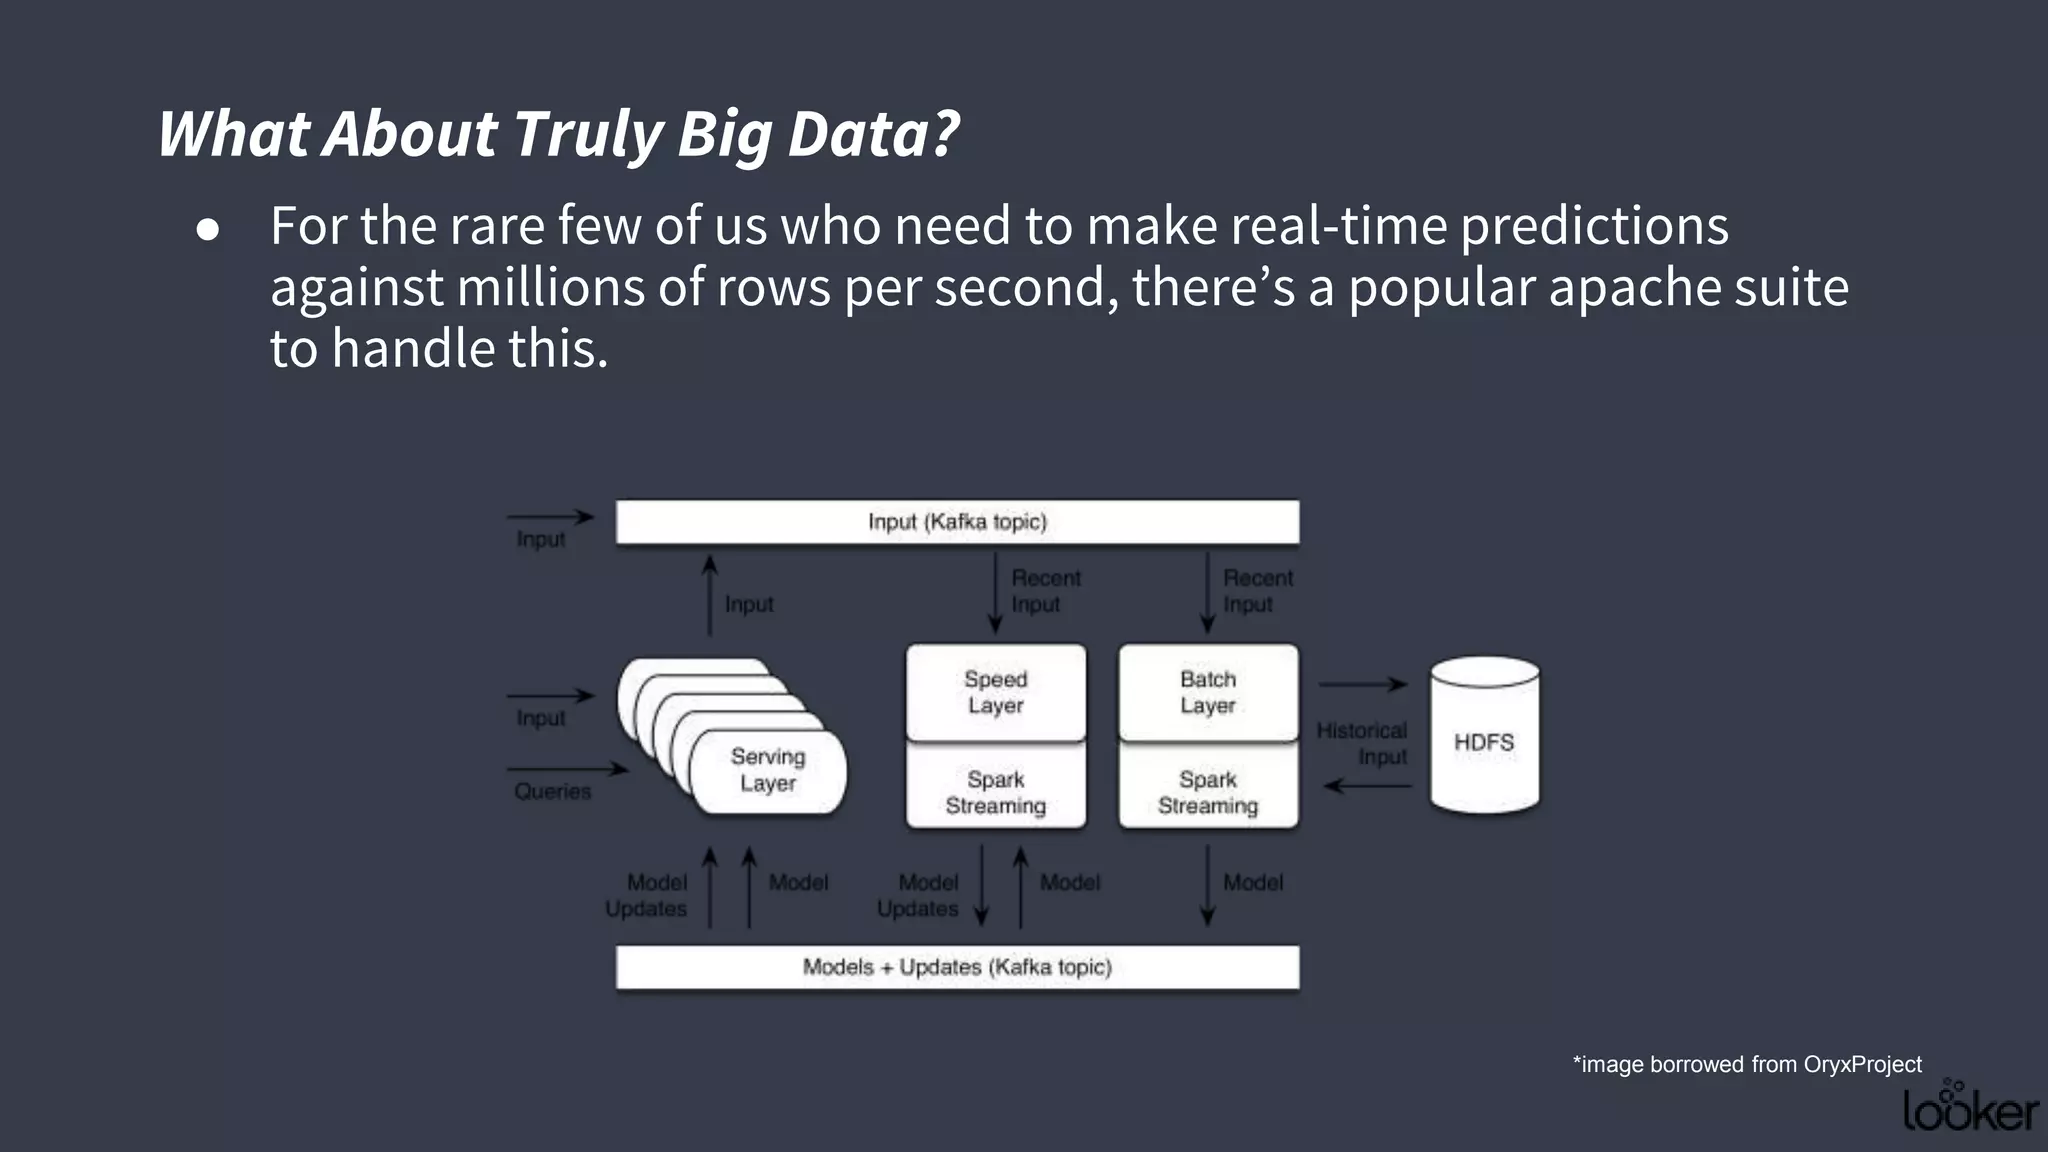
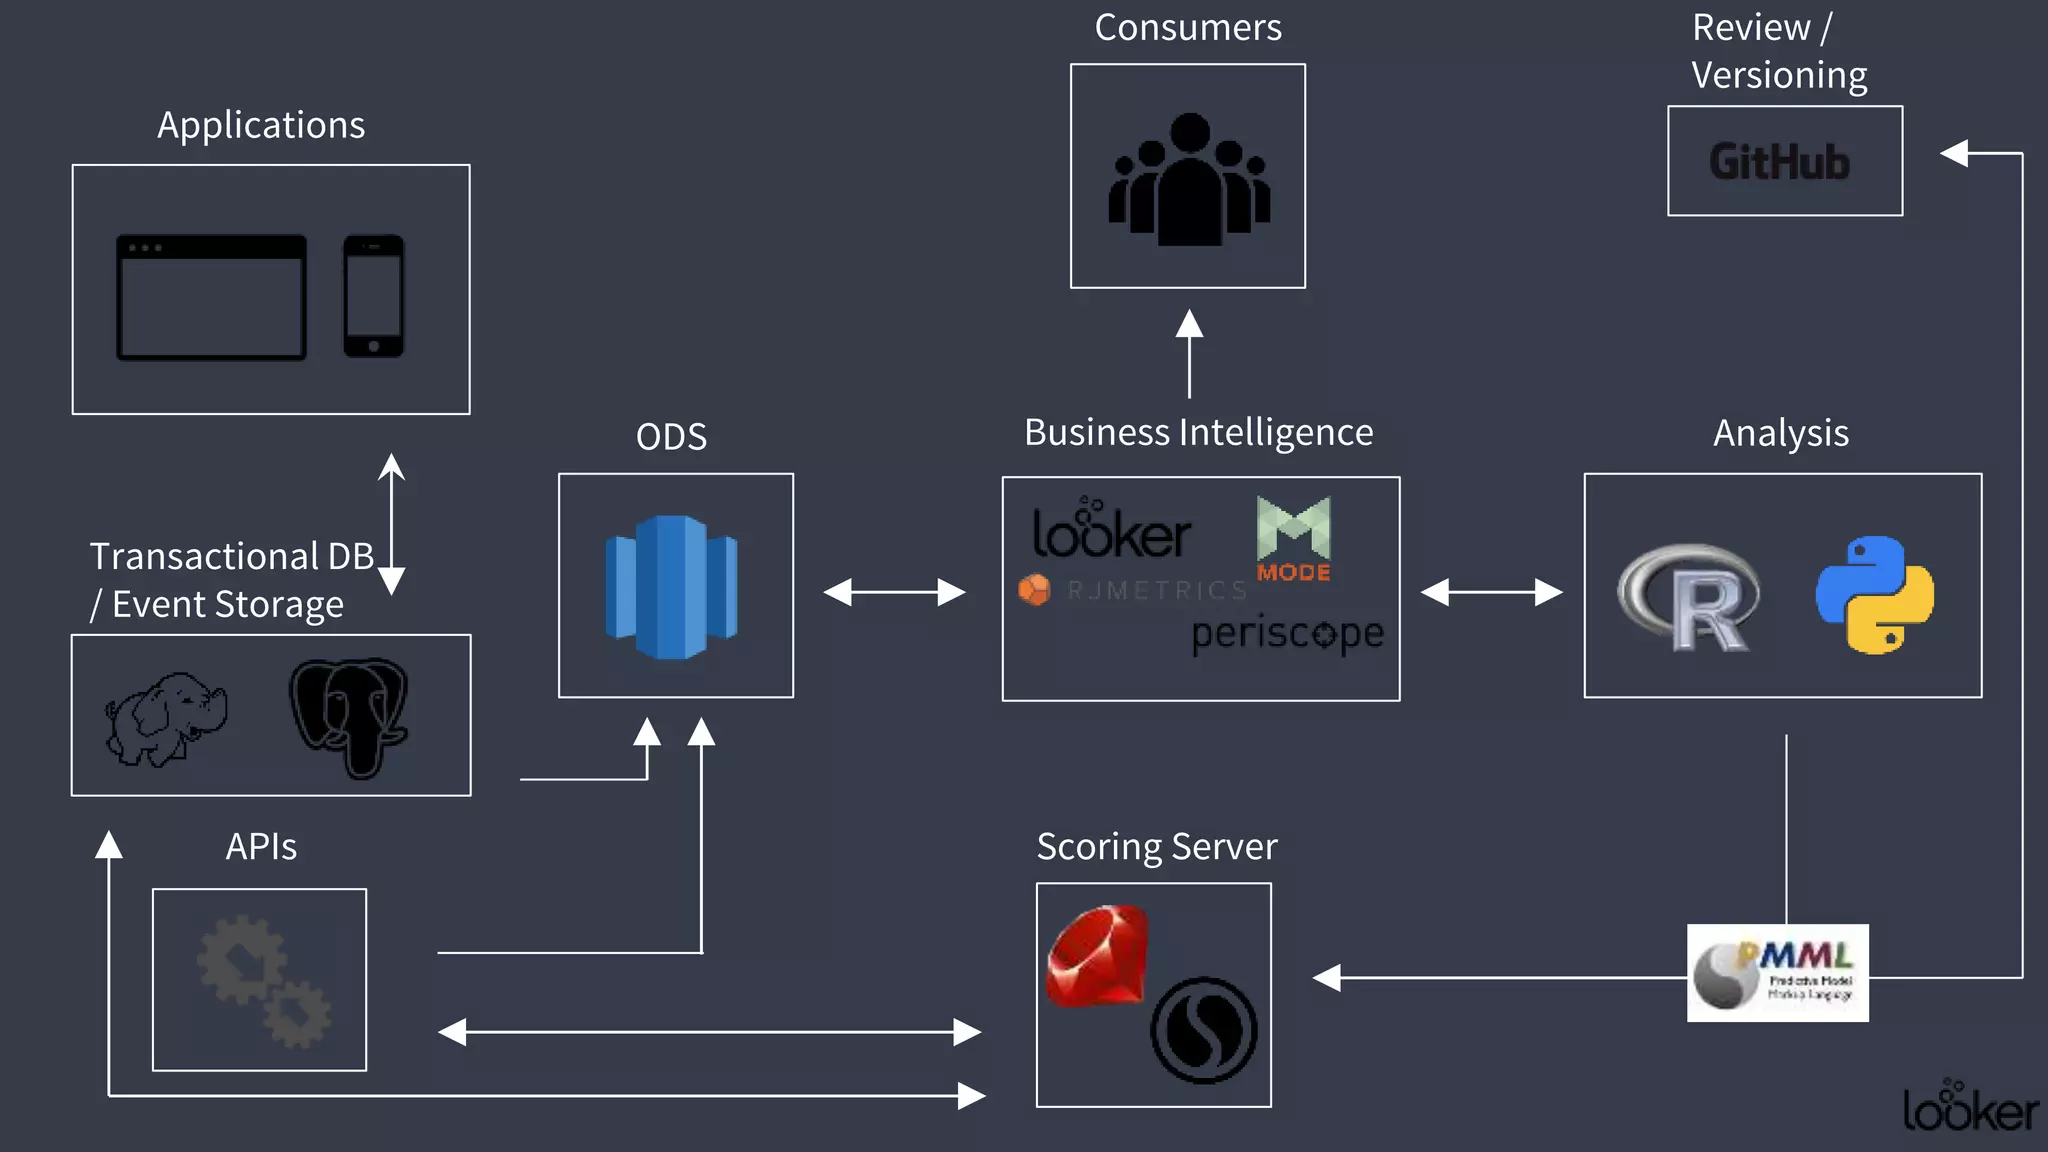


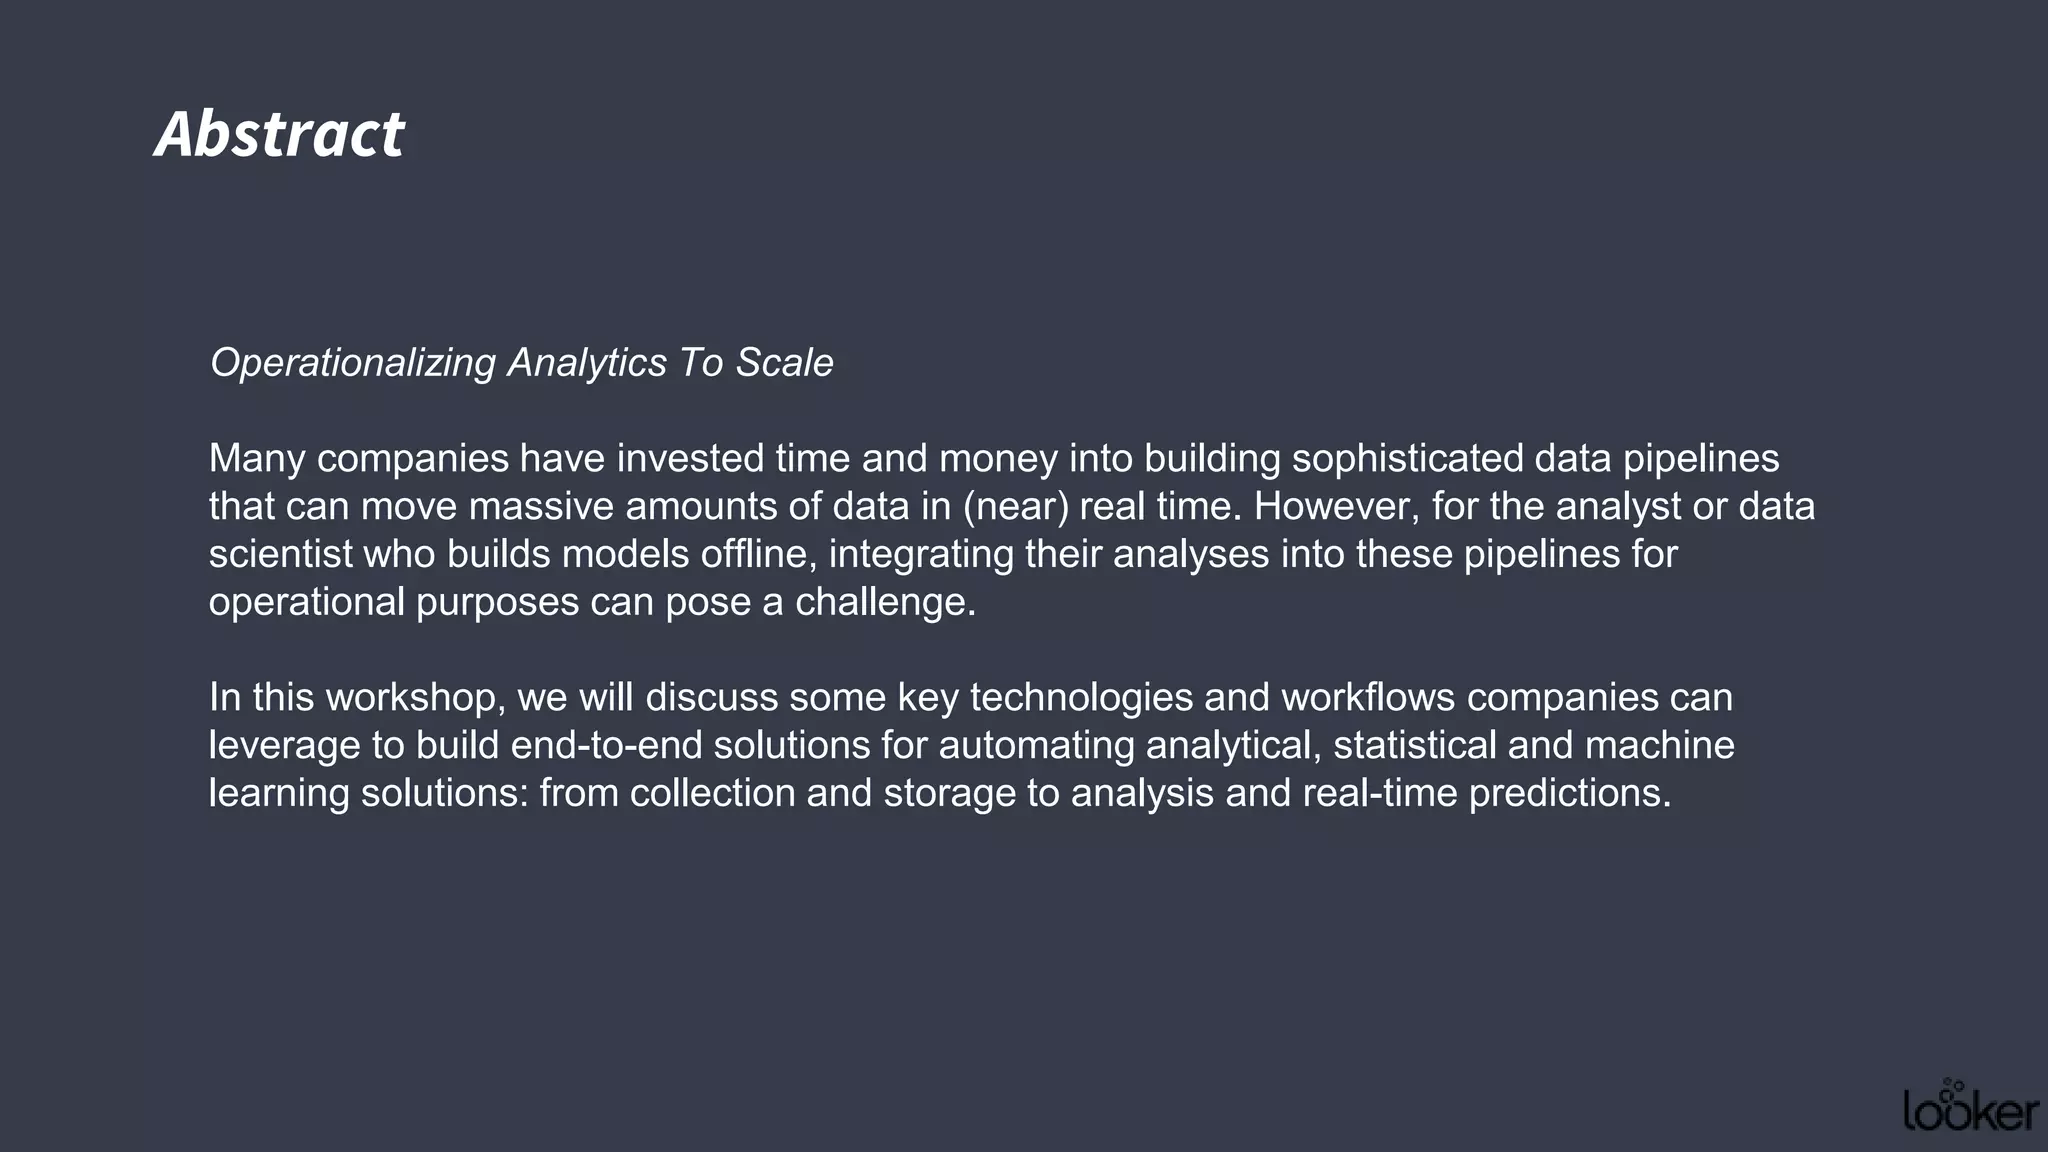
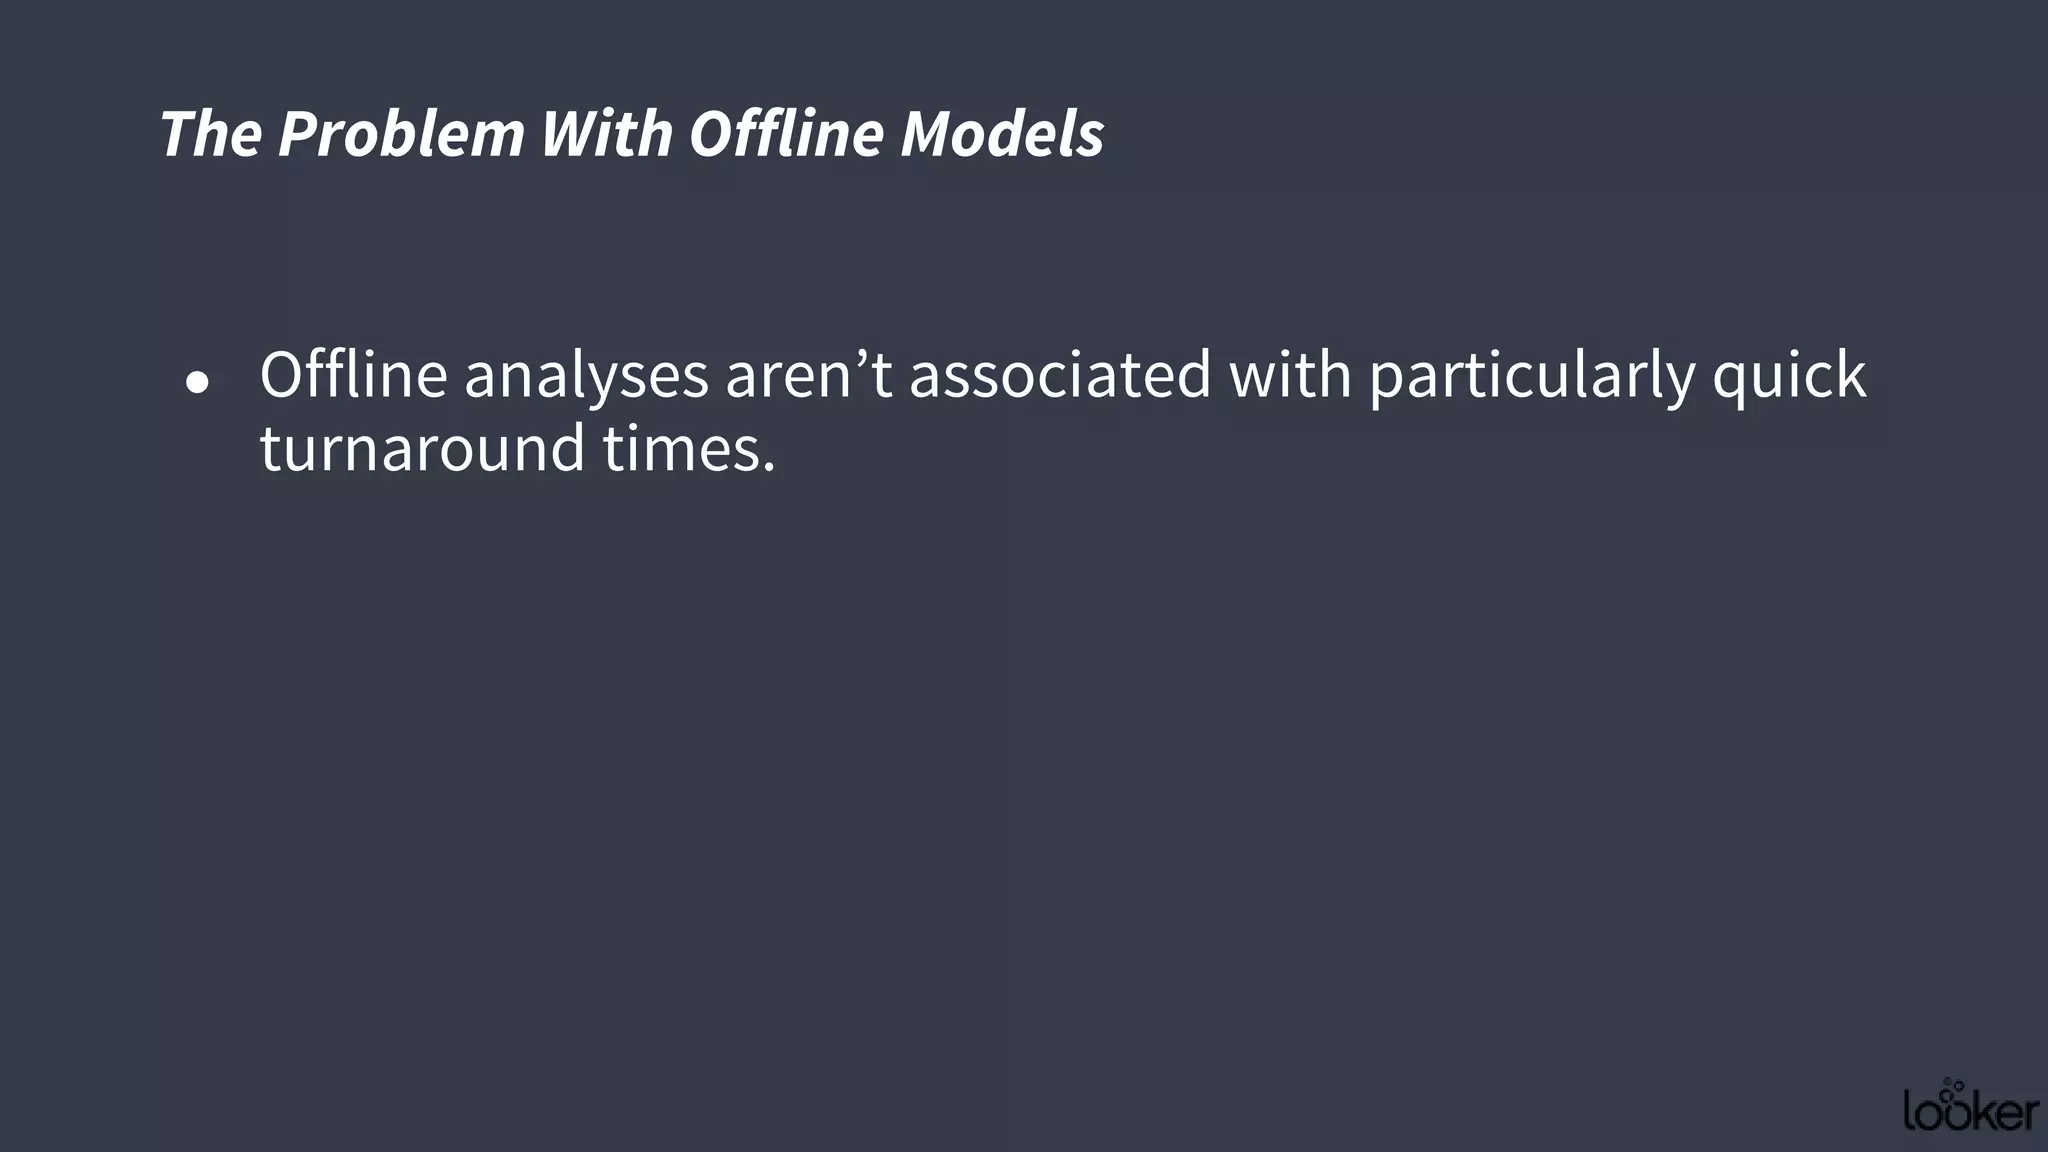
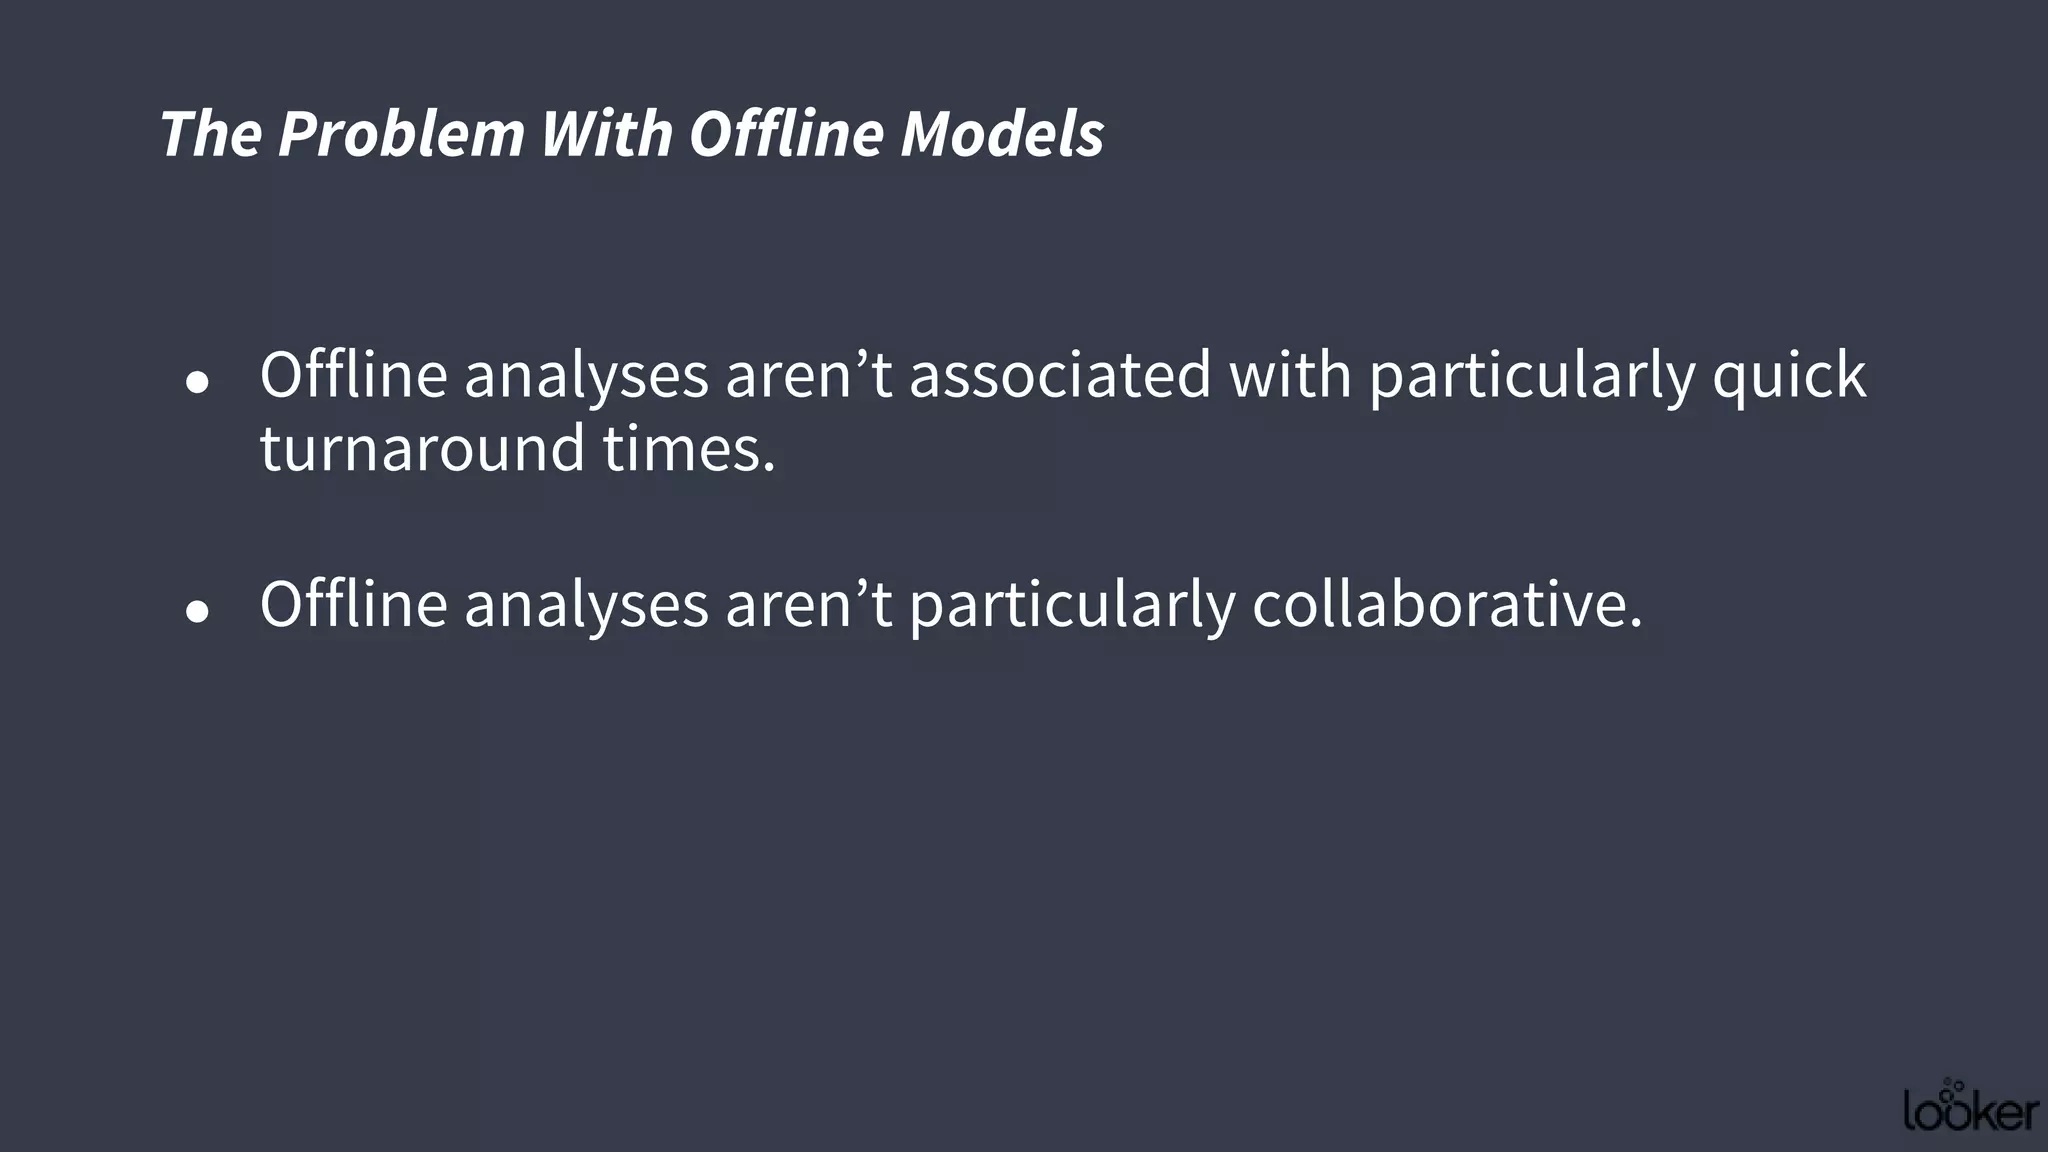
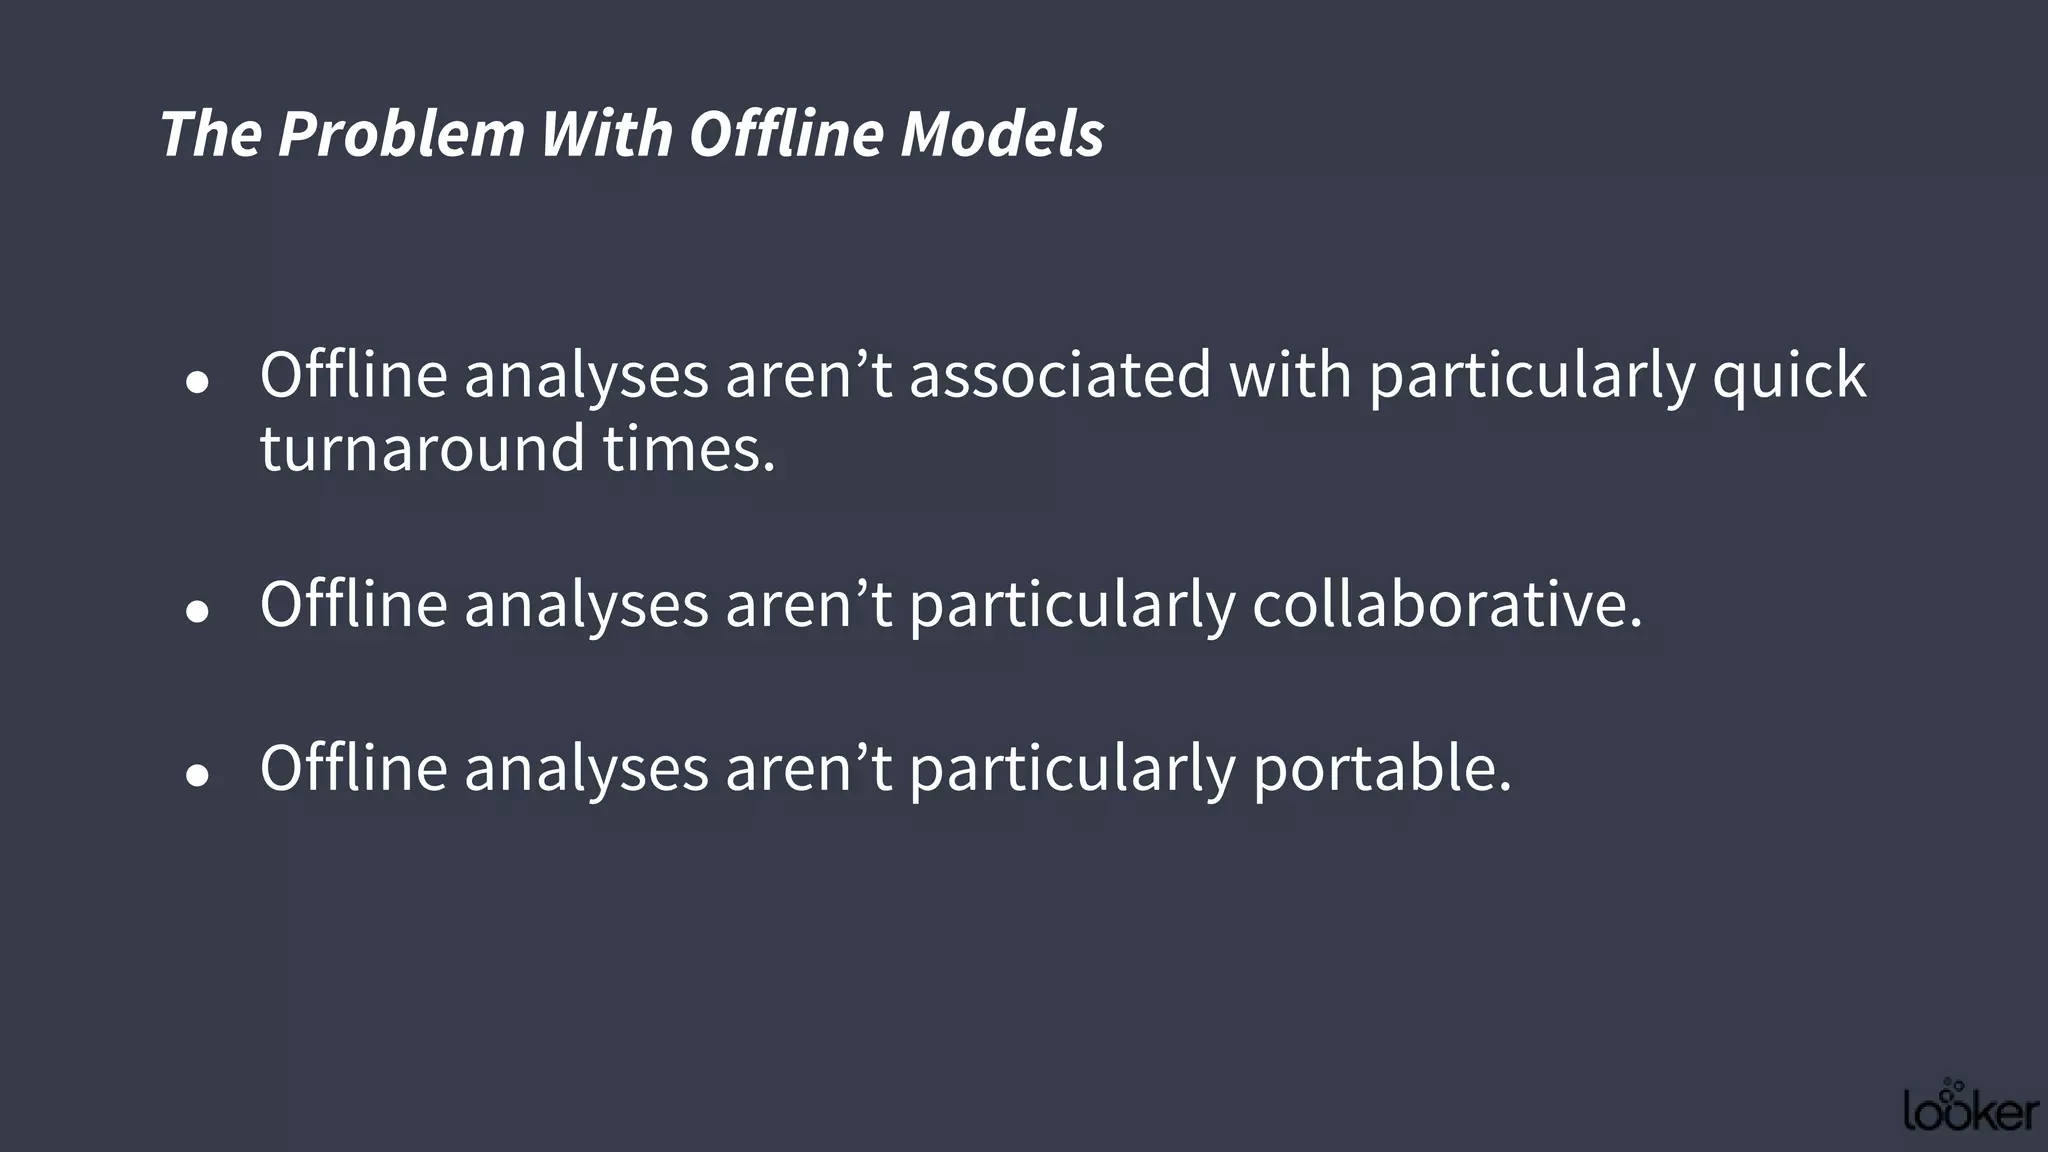
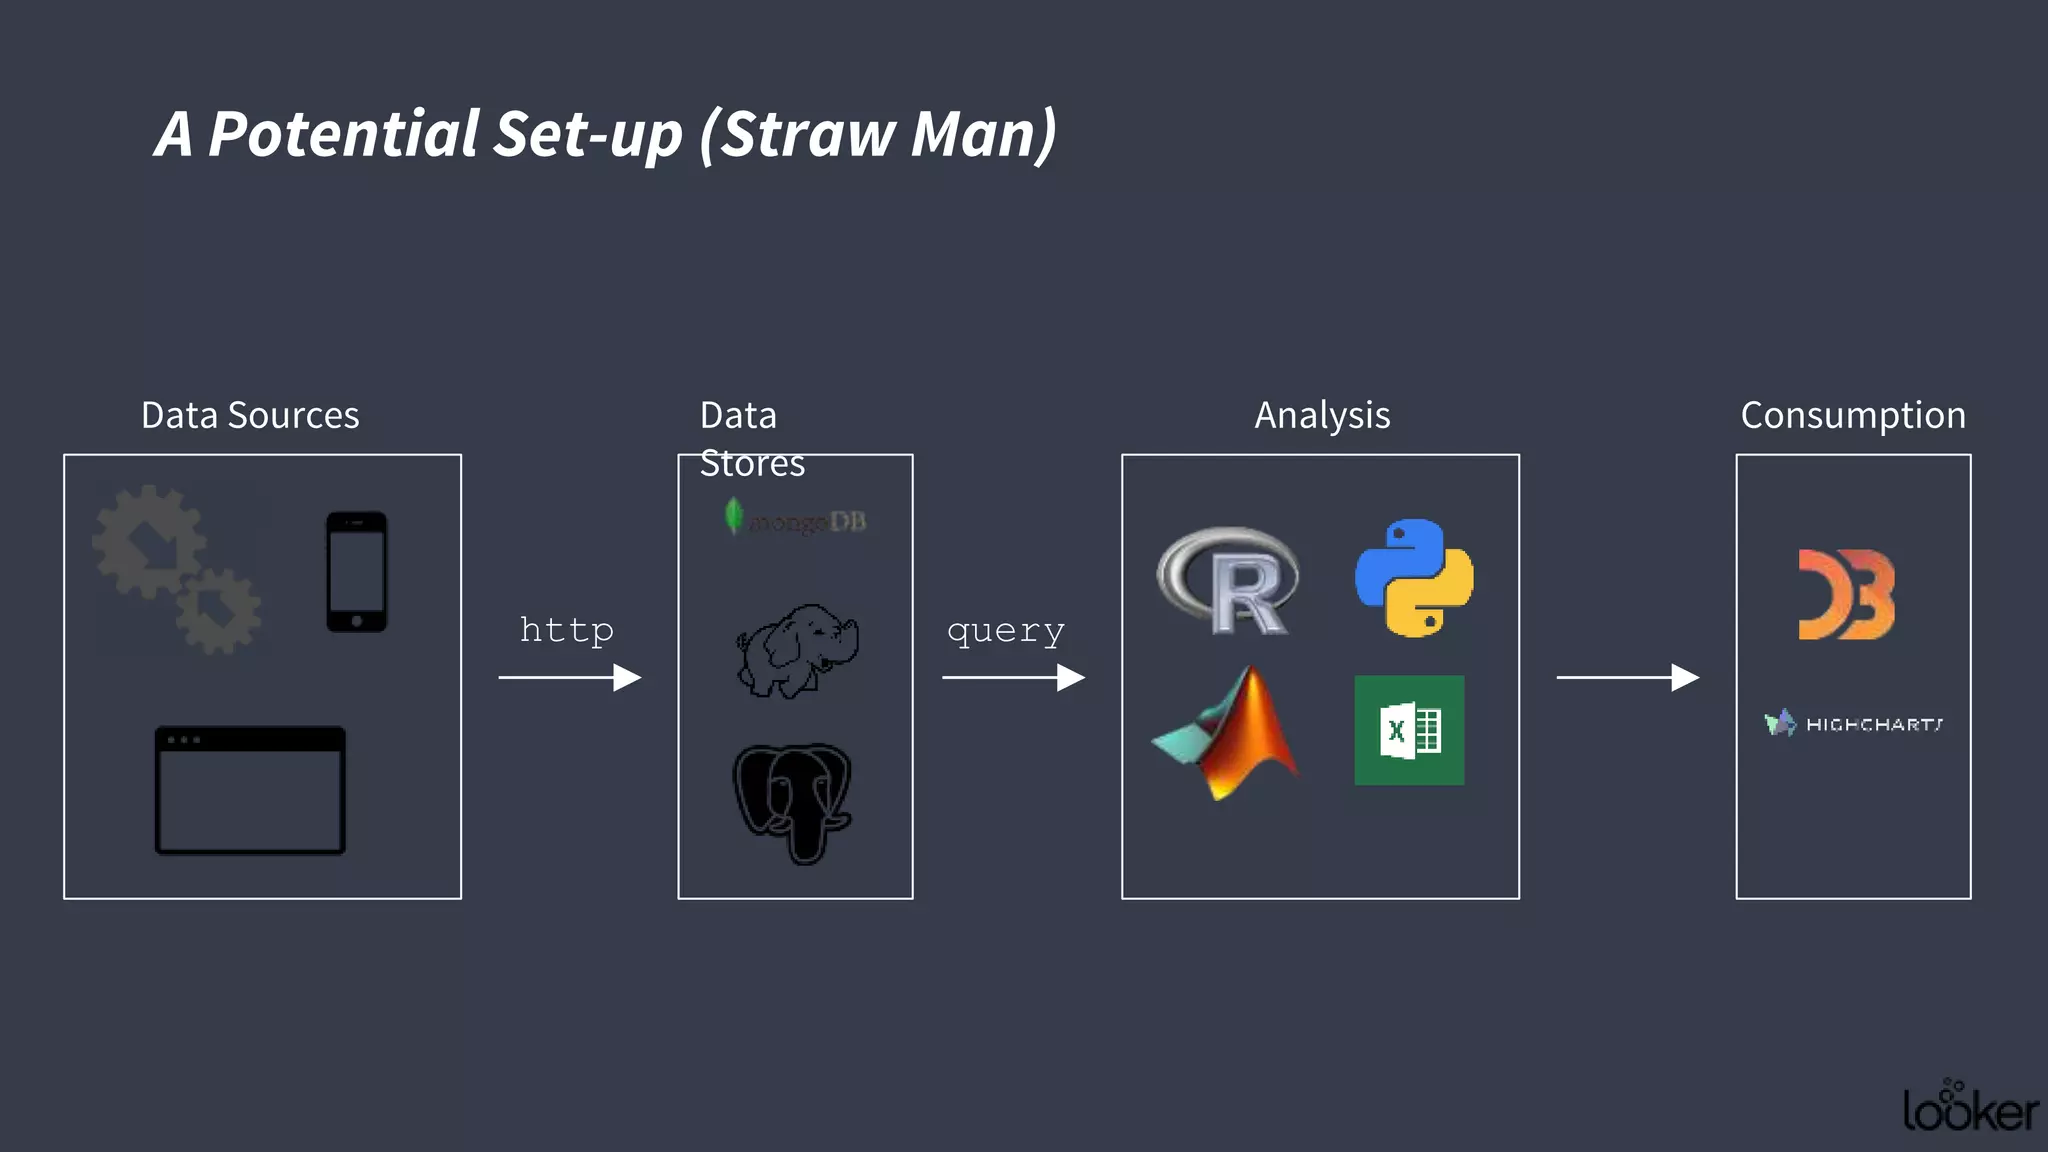
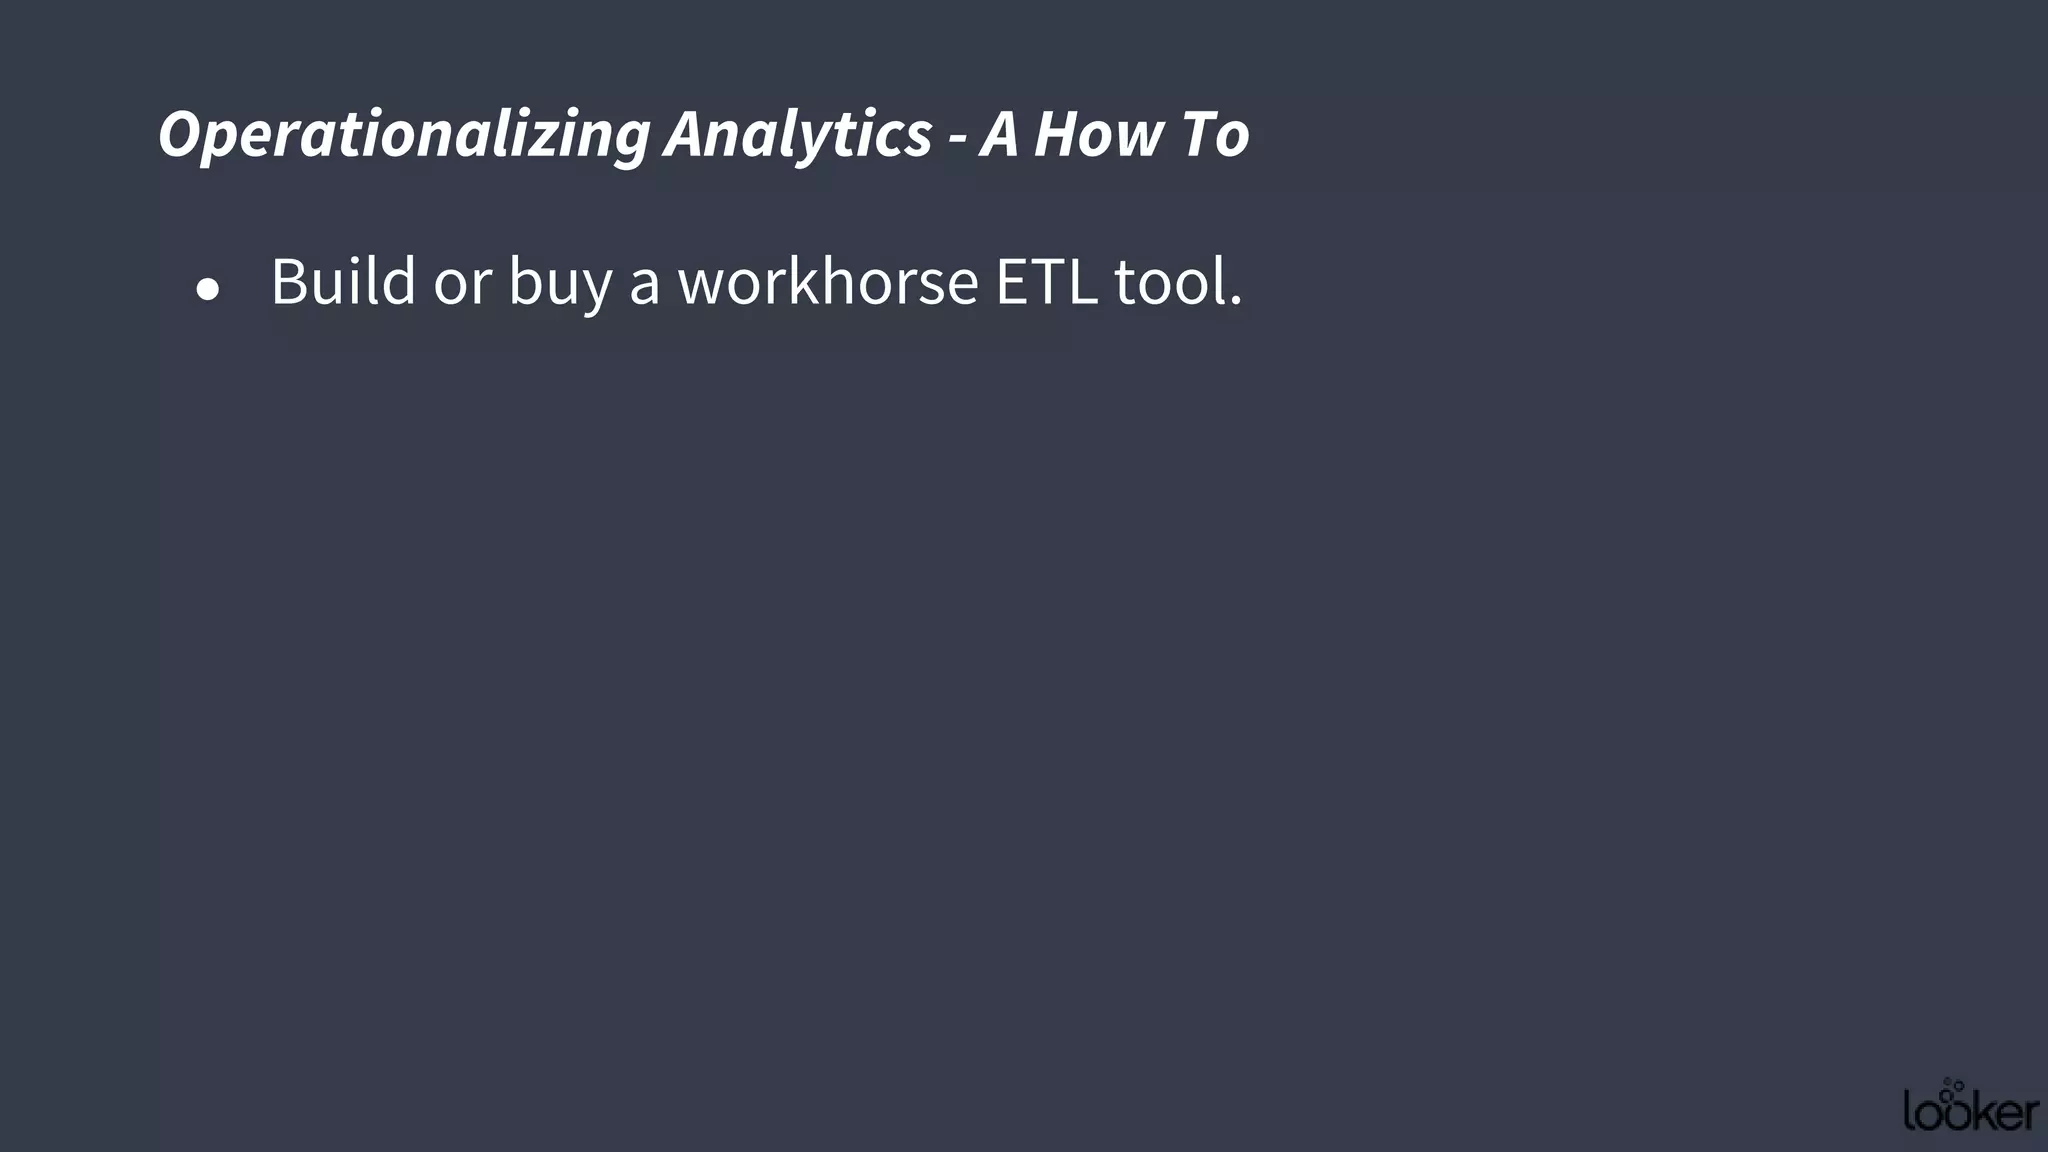
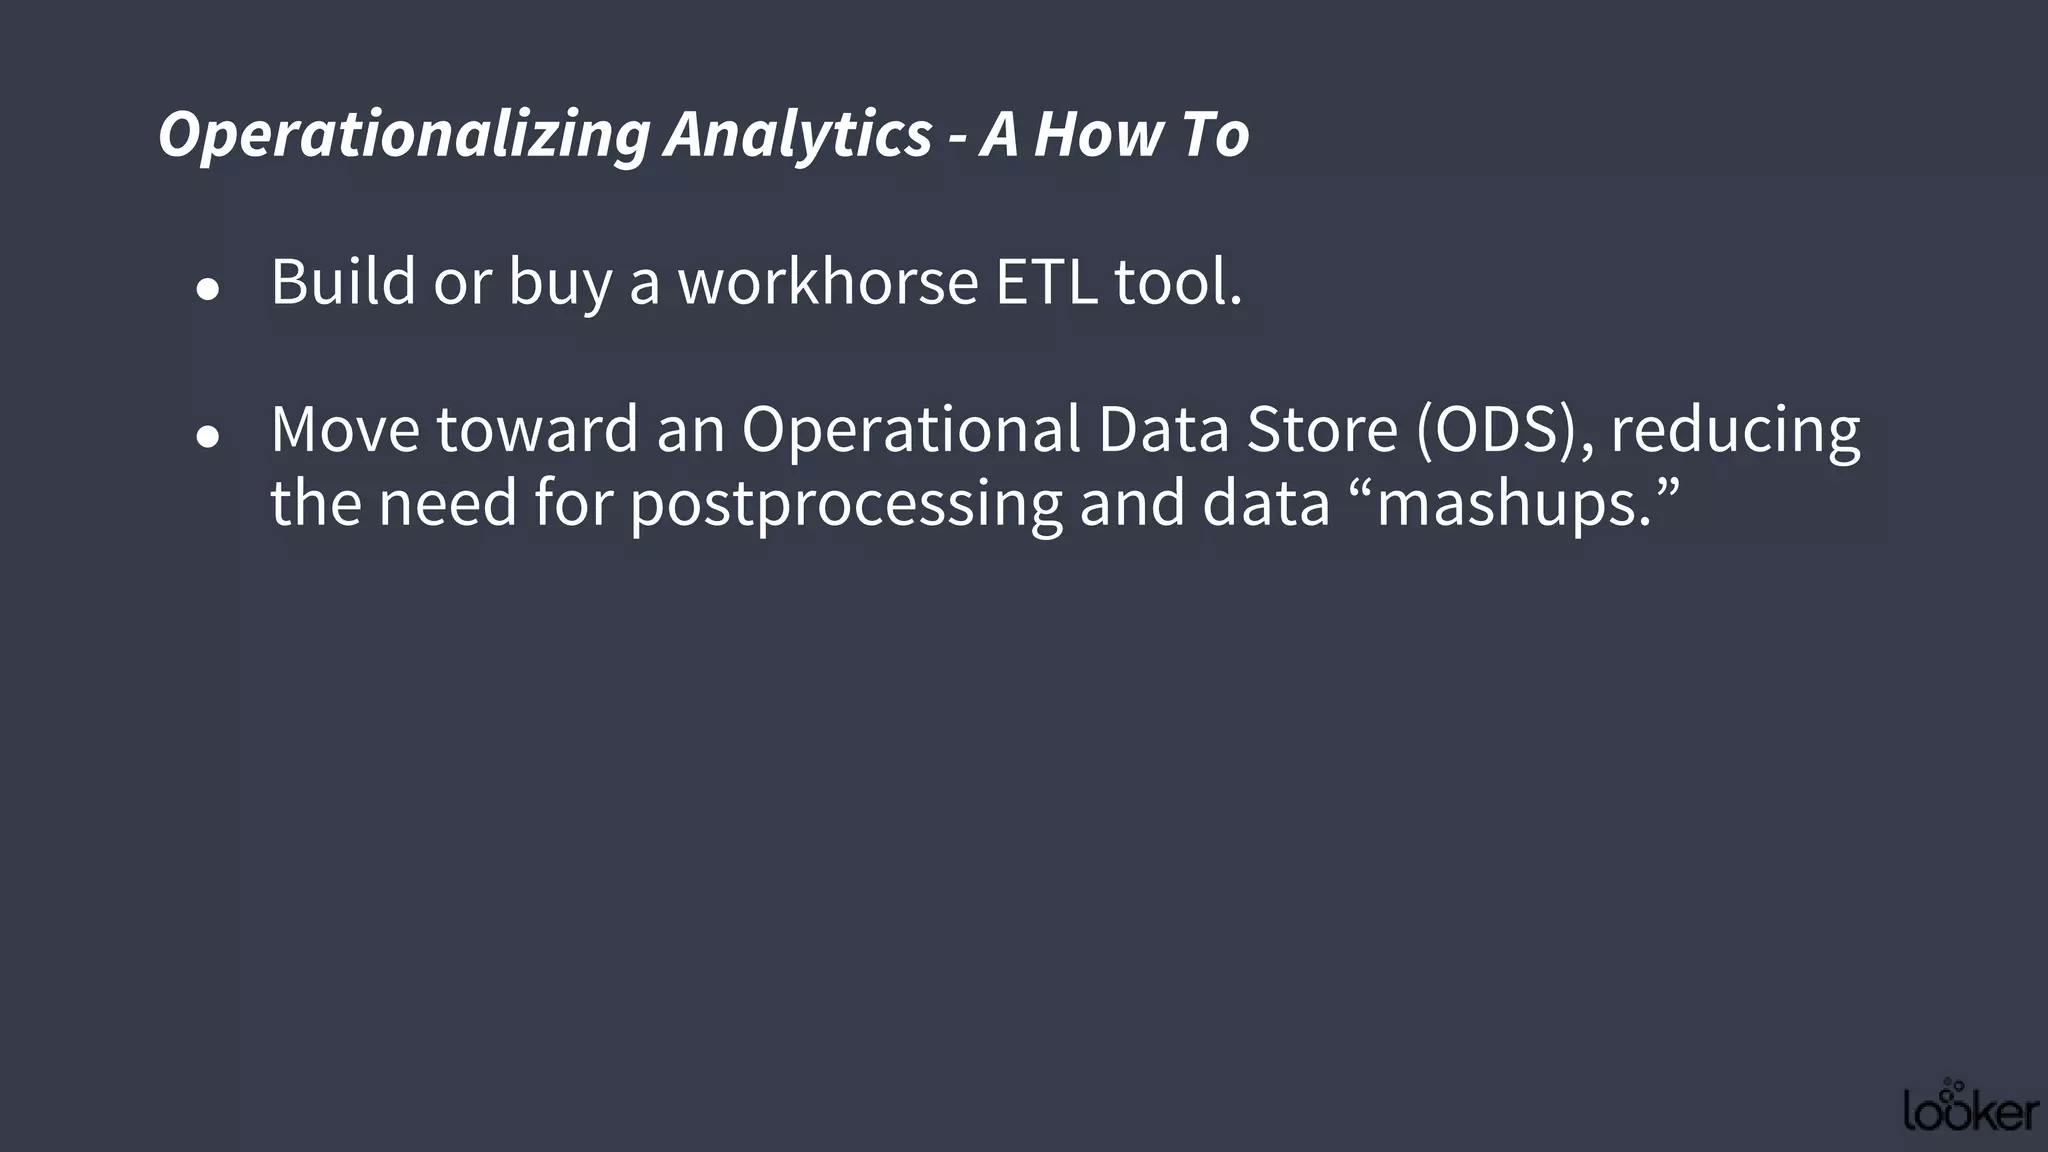
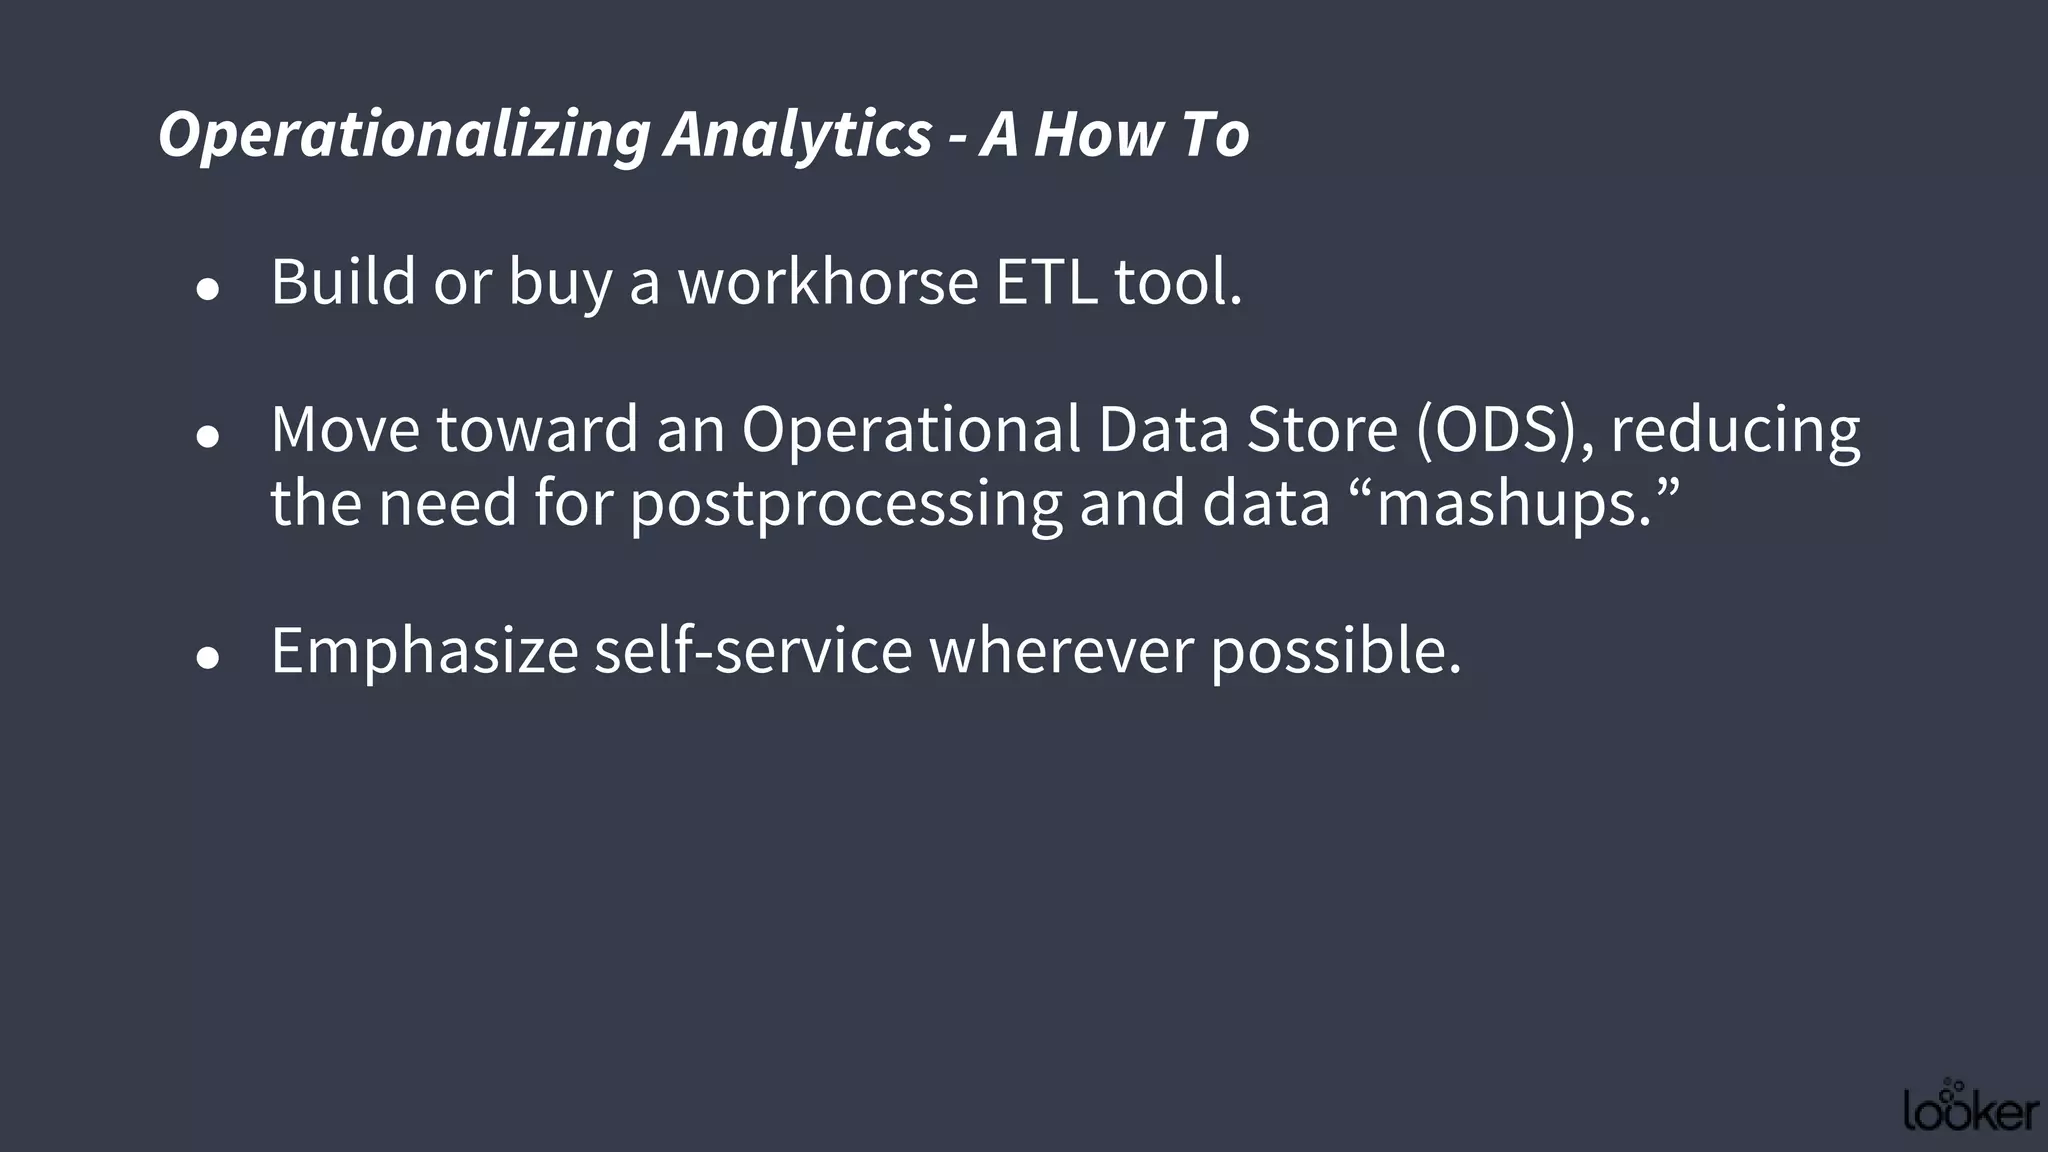
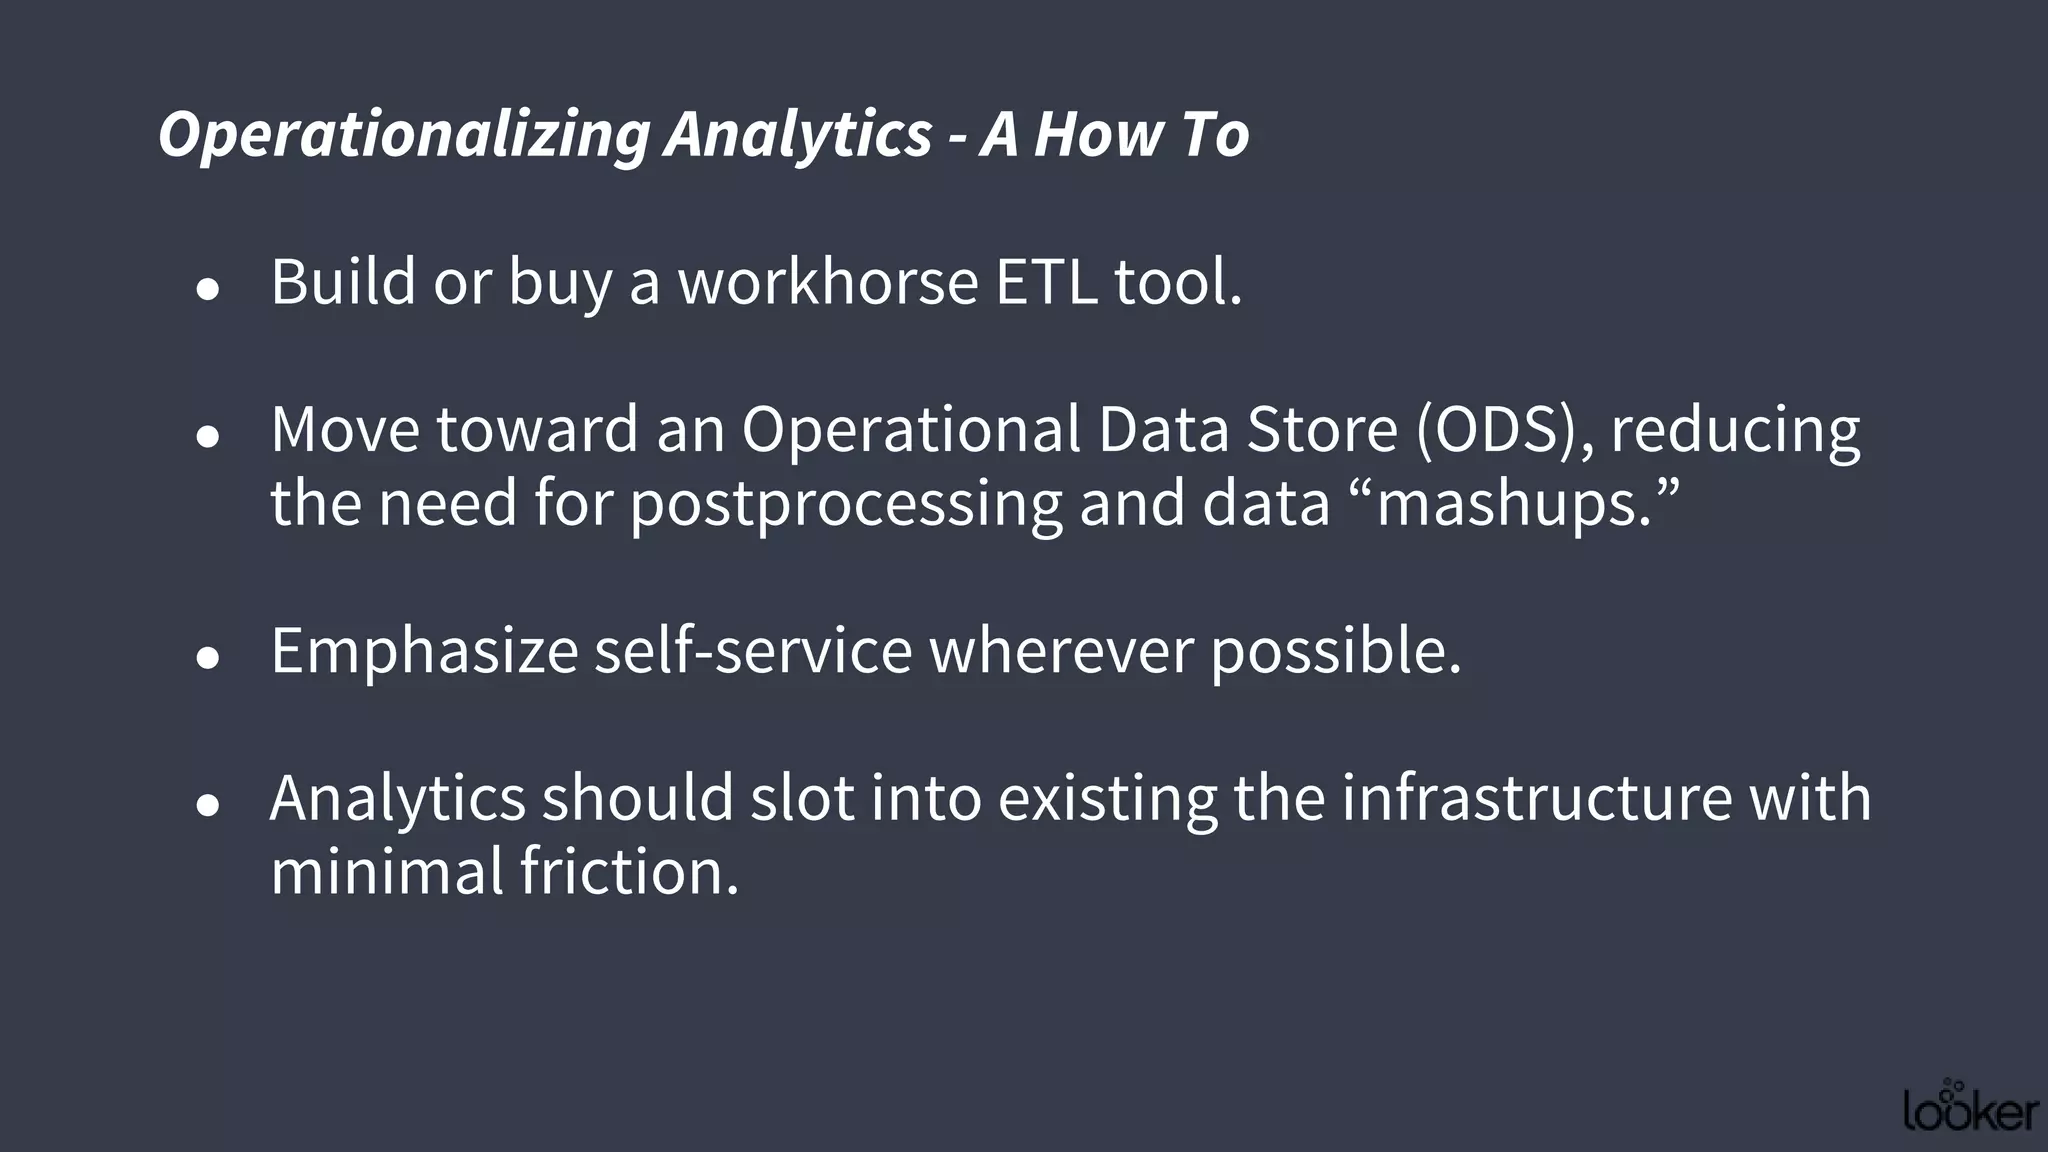
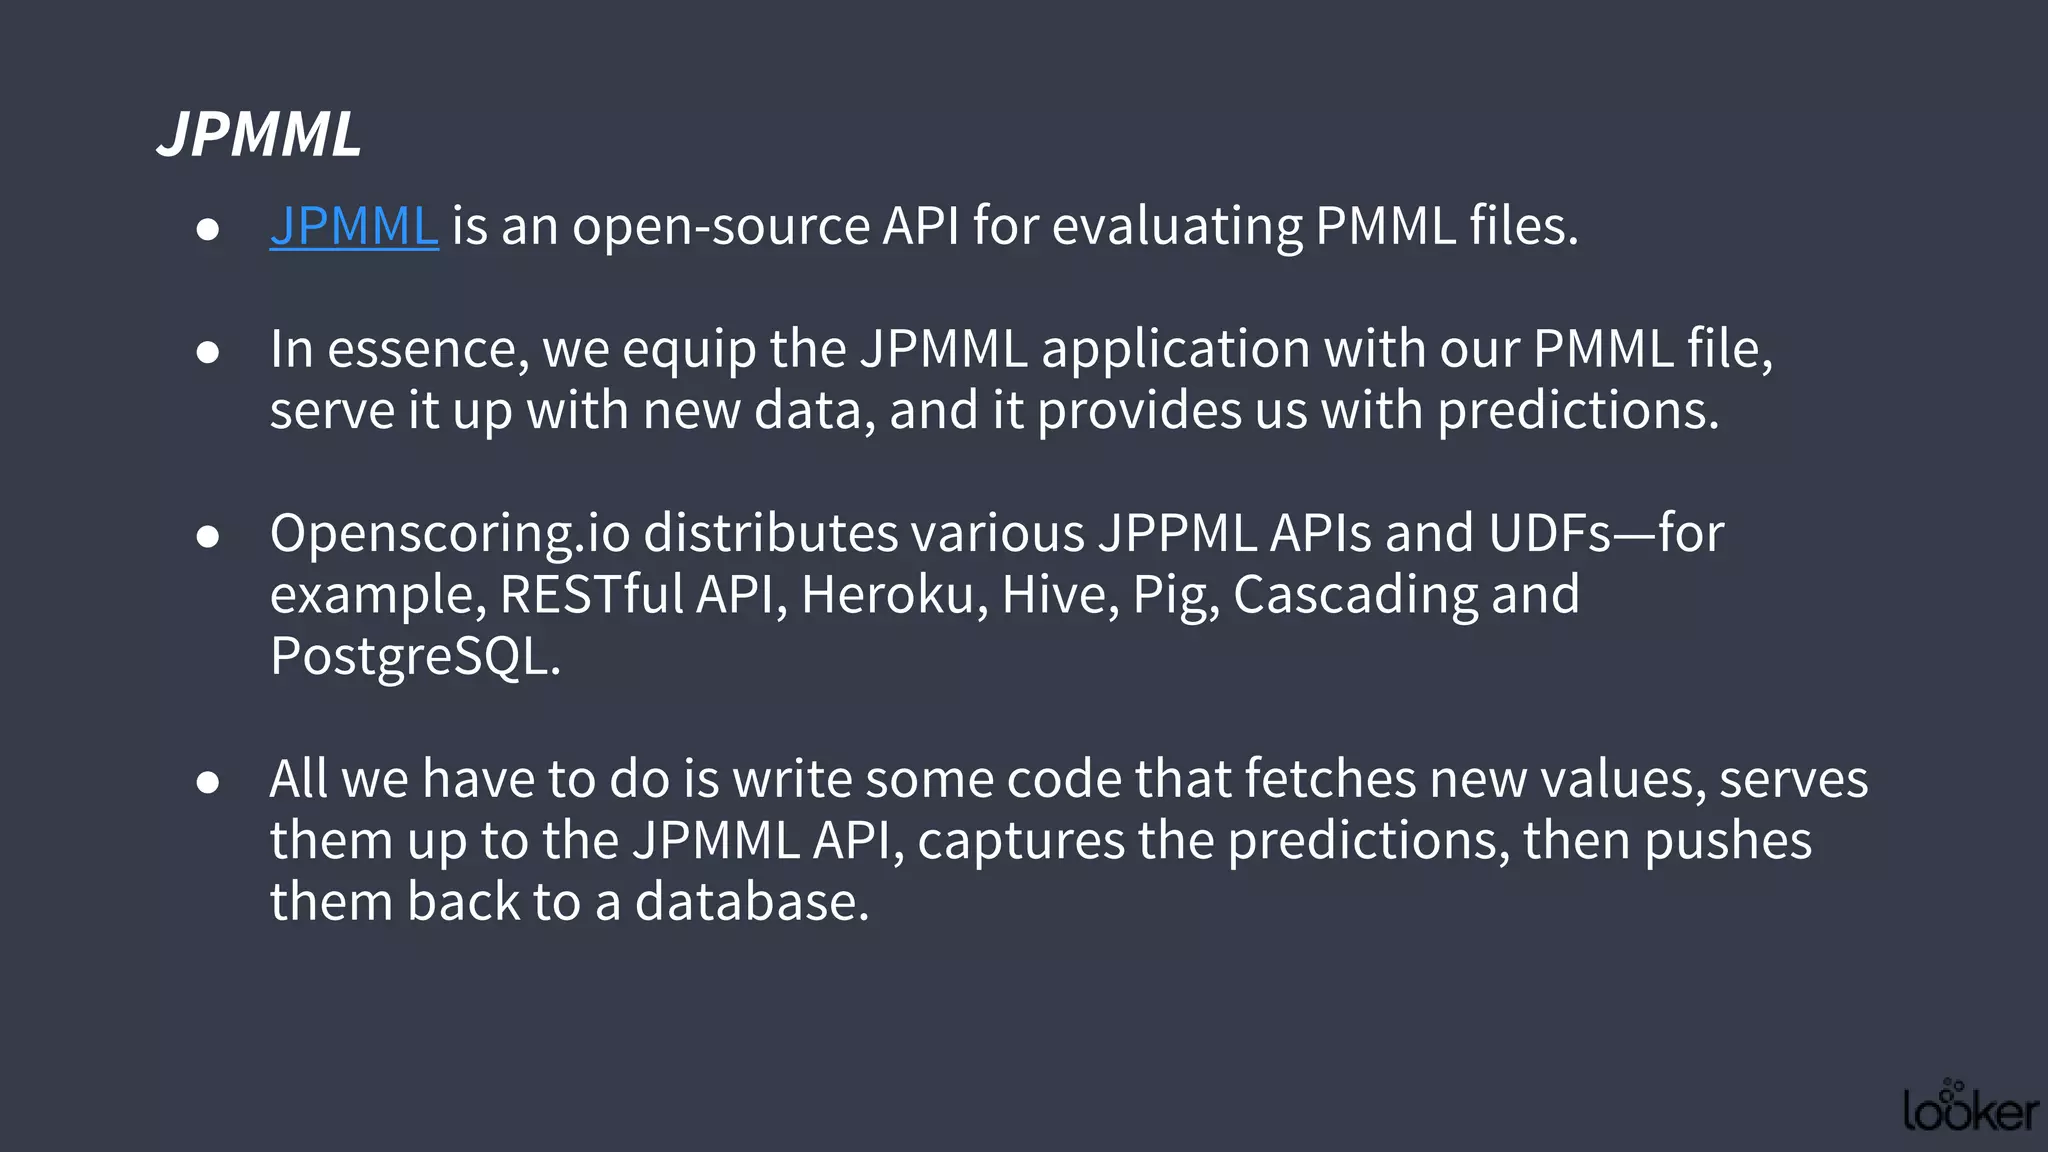
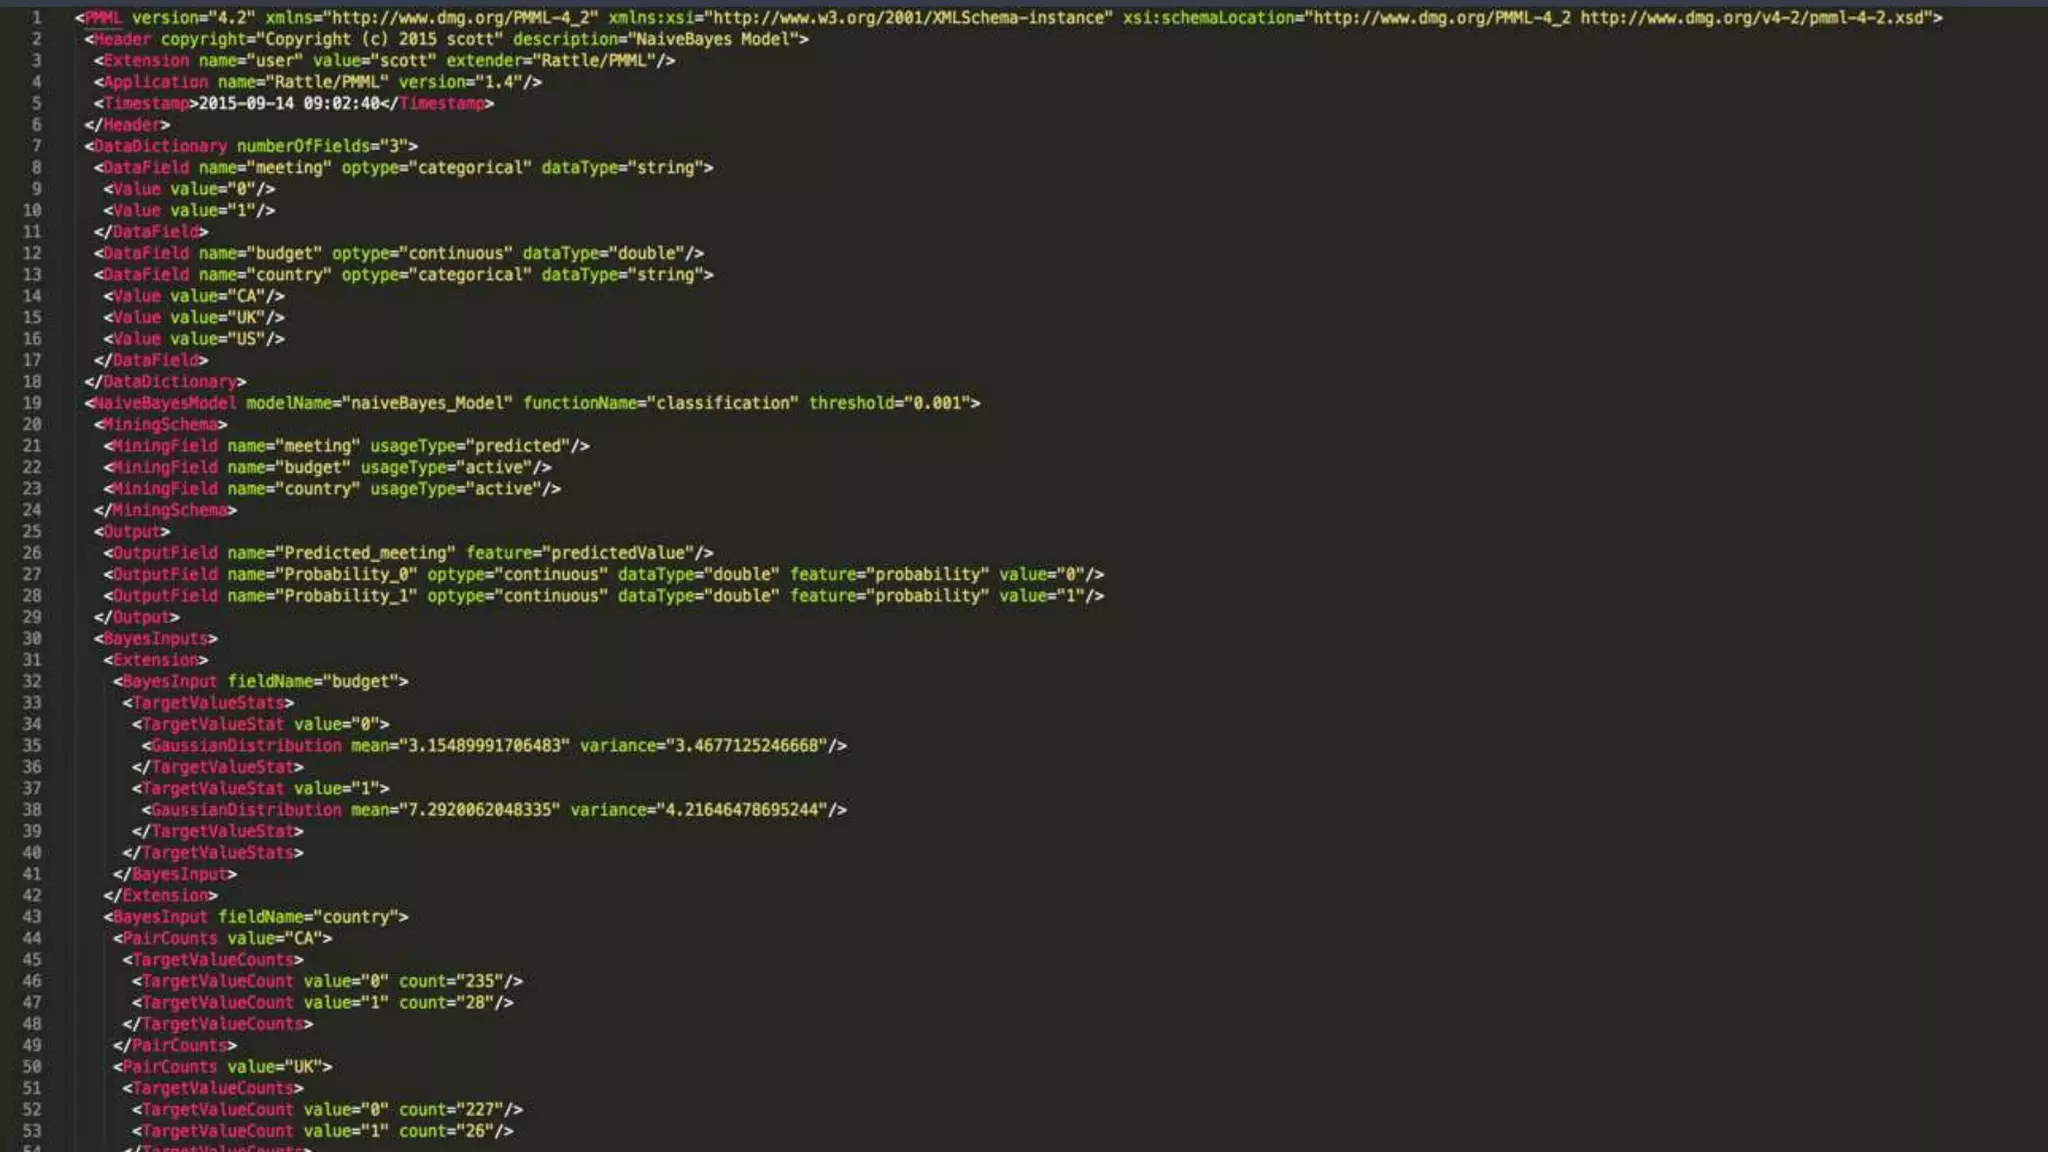
This document discusses strategies for operationalizing analytics within companies, focusing on the integration of data pipelines and models for real-time use. It highlights the challenges faced by analysts and data scientists when working offline and emphasizes the importance of building end-to-end solutions using key technologies, including PMML standards and APIs for predictive modeling. The workshop aims to provide insights into automating analytical processes and emphasizes self-service and minimal friction in analytics infrastructure.


![[DSC Europe 25] Andy Cotgreave - Nothing is new in analytics.pptx](https://cdn.slidesharecdn.com/ss_thumbnails/mba4vzcurvoh5lfrd5zw-6-251205194645-341bbbbe-thumbnail.jpg?width=640&height=640&fit=bounds)


![[DSC Europe 25] Goran Obradovic - The Rise of Sovereign AI: Building the Regi...](https://cdn.slidesharecdn.com/ss_thumbnails/7nw2xxixrxqdxvrb5wca-6-251205085714-ab09a2ac-thumbnail.jpg?width=640&height=640&fit=bounds)


![[DSC Europe 25] Dragana Ilic - AI for Big Data in Astronomy.pptx](https://cdn.slidesharecdn.com/ss_thumbnails/8palya86qaatvjhva1ms-2-dragana-ilic-ai-ilic-251208151906-652b819c-thumbnail.jpg?width=640&height=640&fit=bounds)


