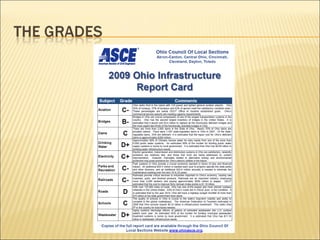
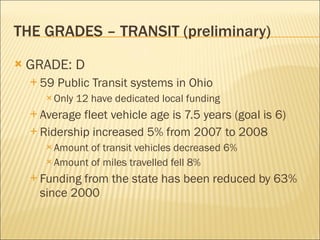
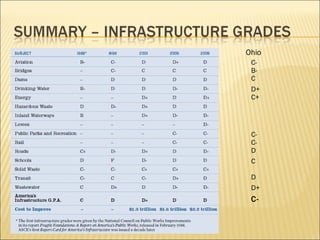
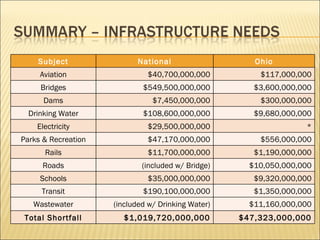
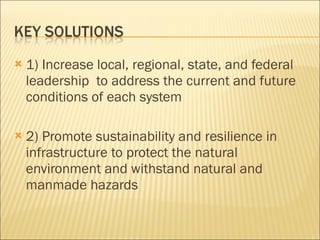
October 9, 2009 Kevin P. Carpenter, P.E., P.S.
 
 
ASCE National Gina Beim, P.E. Carolyn Merry, PhD James Neuenschwander, P.E. Randall Over, P.E. Dean Ringle, P.E., P.S. Jennifer Webster, P.E.
American Society of Civil Engineers Association of State Dam Safety Officials Associations of American Railroads Congressional Budget Office County Engineers Association of Ohio Federal Aviation Administration Federal Highway Administration Federal Railroad Administration Ohio Department of Transportation Ohio Department of Natural Resources Ohio Environmental Protection Agency Ohio Public Works Commission Ohio School Facilities Commission Public Utilities Commission of Ohio U.S. Army Corps of Engineers U.S. Department of Education U.S. Environmental Protection Agency
“. . . The greatest advances in improving human health were the development of clean drinking water and sewage systems.  So, we owe our health as much to civil engineering as we do biology.” -  Lewis Thomas, Former head of Yale Medical School & Memorial Sloan-Kettering Cancer Center
National Council on Public Works Improvement’s 1988 “Report Card on the Nation’s Public Works” Aviation B- Drinking Water B- Hazardous Waste D Inland Waterways B Roads C+ Solid Waste C- Transit C- Wastewater C Average Grade C


GRADE: C- Ohio ranks 3rd with 124 paved and lighted airports Publicly owned airports generated $10.5B $22 M in annual tax revenues FAA Goal: 94% rated “good” or “fair” Good = 79%, Fair = 18%,  Poor = 3% ODOT Goal: 85% runways, 80% taxiways, 75% aprons shall have a “satisfactory” rating Runways = 58%, Taxiways = 57%, Aprons = 62% ODOT estimates $9.8 M per year to maintain $117 M needed for identified improvements
GRADE: B- 2 nd  largest inventory of bridges (27,999) ODOT Maintains: 14,001 (66% of deck area) Counties: 26,061 Municipalities: 2,375 Railroads: 714 Other agencies (e.g., Ohio Turnpike): 559 Inspections required Federal guidelines = every 2 years, Ohio = every year Structurally Deficient or Functionally Obsolete 4,213 (9.5%) SD / 5,081 (11.5%) FO Estimated $3.6 B to replace all SD and rehab 2/3 of FO
GRADE: C- 5,275 miles of rail in Ohio, 4 th  most in U.S. 36 rail companies (CSX and NS own more than 75%) 1/3 of nation’s freight passes through Ohio Demand forecast to increase by 2035 71% by tonnage, 85% by ton-miles Columbus is 2 nd  largest and Dayton 6 th  largest cities in U.S. without passenger rail 16,000 crossings in OH Since 1990 train/vehicle crashes down 66%, fatalities 77% Between 2005 and 2008, 482 crashes including 45 fatalities ODOT Estimates $1.19 B to improve 30-most critical
GRADE: D More than 125,000 miles in OH, 7 th  in the U.S. 1,574 miles of Interstate (21 routes) – 5 th  in U.S. Roadway ratings: 22.5% excellent, 34.5% good, 29% fair, 11.3% poor 811 fatalities and 91,114 injuries in 6 cities in ‘05 Congestion increasing: Columbus 41 st  in ‘02, 34 th  in ‘05 Cincinnati 40 th  & Cleveland 49 th  in ‘05 ODOT collected $2.5 B, spent $4.5 B in ’05 Estimate $3.3 B shortfall by 2014 Identified projects with no funding = $10.05 B
THE GRADES – TRANSIT (preliminary) GRADE: D 59 Public Transit systems in Ohio Only 12 have dedicated local funding Average fleet vehicle age is 7.5 years (goal is 6) Ridership increased 5% from 2007 to 2008 Amount of transit vehicles decreased 6% Amount of miles travelled fell 8% Funding from the state has been reduced by 63% since 2000
Ohio C- B- C D+ C+ C- C- D C D+ C- D
$1,350,000,000 $190,100,000,000 Transit Subject National Ohio Aviation $40,700,000,000 $117,000,000 Bridges $549,500,000,000 $3,600,000,000 Dams $7,450,000,000 $300,000,000 Drinking Water $108,600,000,000 $9,680,000,000 Electricity $29,500,000,000 * Parks & Recreation $47,170,000,000 $556,000,000 Rails $11,700,000,000 $1,190,000,000 Roads (included w/ Bridge) $10,050,000,000 Schools $35,000,000,000 $9,320,000,000 Wastewater (included w/ Drinking Water) $11,160,000,000 Total Shortfall $1,019,720,000,000 $47,323,000,000
1) Increase local, regional, state, and federal leadership  to address the current and future conditions of each system 2) Promote sustainability and resilience in infrastructure to protect the natural environment and withstand natural and manmade hazards
3) Develop national, regional, state, and local infrastructure plans that complement a national vision and focus on system-wide results 4) Address life-cycle costs and on-going maintenance to meet the needs of current and future users
5) Increase and improve infrastructure investment from all stakeholders
Copies of the full report or any sections can be downloaded at: www.ohioasce.org
GRADE: C More than 2,600 dams in Ohio 68% privately owned, 23% local, 7% state, 2% fed 1,597 state-regulated dams 375 High Hazard Class I 543 Significant Hazard Class II 679 Low Hazard Class III ODNR dam staff reduced 15% since 2007 Estimated need of $309 M for repair
GRADE: D+ More 6,000 public water systems in Ohio 90% of Ohioans receive water from public system 99% of funding from local sources ARRA will fund $58.5 M in water projects 1,400 requests for more than $3 B Estimated $9.68 B needed
GRADE: C+ Generation, transmission and distribution satisfactory to meet current needs Most outages due to weather related issues Usage level between 1995 and 2005 70% of generation by coal and nuclear, 29% by natural gas & oil Usage:  29% commercial, 37% industrial, 34% residential 2008 – SB 221 mandates at least 12.5% energy from alternative sources Coal provides 2/3 of Ohio’s electric generating capacity No estimate provided due to unknown federal regulations
GRADE: C- ODNR owns  74 parks, 20 forests, 132 preserves More than 714,000 acres ODNR jurisdiction over  14 scenic rivers, 7,000 miles of streams More than 120,000 acres State park system includes: 10,000 campsites in 57 campgrounds 80 beaches and 188 boat ramps 390 trails totaling more than 1,200 miles Estimate $556 M to eliminate deferred CIP backlog
GRADE: C 1997 School funding found unconstitutional OSFC created to oversee public schools Worked with 75% of local school districts Manage $5.92 B per year for last 10 years 481 renovated facilities, 141 under construction, 25 SD/year All facility needs met in 123 SD thru 2007 Need has decreased from $20.9 B in 2001 to $9.32 B in 2008, still ranks 6 th  in U.S.
GRADE: D+ General lack of data As of June 2008 Ohio had 1,300 known CSO in 86 communities Nationally, CSOs discharge 850 B gallons / year Overflows due to blocked or broken pipes = 10 B Gal /yr Local governments provide more than 94% of funds ASCE estimates $11.16 B needed

OH Infrastructure Report Card

  • 1.
    October 9, 2009Kevin P. Carpenter, P.E., P.S.
  • 2.
  • 3.
  • 4.
    ASCE National GinaBeim, P.E. Carolyn Merry, PhD James Neuenschwander, P.E. Randall Over, P.E. Dean Ringle, P.E., P.S. Jennifer Webster, P.E.
  • 5.
    American Society ofCivil Engineers Association of State Dam Safety Officials Associations of American Railroads Congressional Budget Office County Engineers Association of Ohio Federal Aviation Administration Federal Highway Administration Federal Railroad Administration Ohio Department of Transportation Ohio Department of Natural Resources Ohio Environmental Protection Agency Ohio Public Works Commission Ohio School Facilities Commission Public Utilities Commission of Ohio U.S. Army Corps of Engineers U.S. Department of Education U.S. Environmental Protection Agency
  • 6.
    “. . .The greatest advances in improving human health were the development of clean drinking water and sewage systems. So, we owe our health as much to civil engineering as we do biology.” - Lewis Thomas, Former head of Yale Medical School & Memorial Sloan-Kettering Cancer Center
  • 7.
    National Council onPublic Works Improvement’s 1988 “Report Card on the Nation’s Public Works” Aviation B- Drinking Water B- Hazardous Waste D Inland Waterways B Roads C+ Solid Waste C- Transit C- Wastewater C Average Grade C
  • 8.
  • 9.
  • 10.
  • 11.
    GRADE: C- Ohioranks 3rd with 124 paved and lighted airports Publicly owned airports generated $10.5B $22 M in annual tax revenues FAA Goal: 94% rated “good” or “fair” Good = 79%, Fair = 18%, Poor = 3% ODOT Goal: 85% runways, 80% taxiways, 75% aprons shall have a “satisfactory” rating Runways = 58%, Taxiways = 57%, Aprons = 62% ODOT estimates $9.8 M per year to maintain $117 M needed for identified improvements
  • 12.
    GRADE: B- 2nd largest inventory of bridges (27,999) ODOT Maintains: 14,001 (66% of deck area) Counties: 26,061 Municipalities: 2,375 Railroads: 714 Other agencies (e.g., Ohio Turnpike): 559 Inspections required Federal guidelines = every 2 years, Ohio = every year Structurally Deficient or Functionally Obsolete 4,213 (9.5%) SD / 5,081 (11.5%) FO Estimated $3.6 B to replace all SD and rehab 2/3 of FO
  • 13.
    GRADE: C- 5,275miles of rail in Ohio, 4 th most in U.S. 36 rail companies (CSX and NS own more than 75%) 1/3 of nation’s freight passes through Ohio Demand forecast to increase by 2035 71% by tonnage, 85% by ton-miles Columbus is 2 nd largest and Dayton 6 th largest cities in U.S. without passenger rail 16,000 crossings in OH Since 1990 train/vehicle crashes down 66%, fatalities 77% Between 2005 and 2008, 482 crashes including 45 fatalities ODOT Estimates $1.19 B to improve 30-most critical
  • 14.
    GRADE: D Morethan 125,000 miles in OH, 7 th in the U.S. 1,574 miles of Interstate (21 routes) – 5 th in U.S. Roadway ratings: 22.5% excellent, 34.5% good, 29% fair, 11.3% poor 811 fatalities and 91,114 injuries in 6 cities in ‘05 Congestion increasing: Columbus 41 st in ‘02, 34 th in ‘05 Cincinnati 40 th & Cleveland 49 th in ‘05 ODOT collected $2.5 B, spent $4.5 B in ’05 Estimate $3.3 B shortfall by 2014 Identified projects with no funding = $10.05 B
  • 15.
    THE GRADES –TRANSIT (preliminary) GRADE: D 59 Public Transit systems in Ohio Only 12 have dedicated local funding Average fleet vehicle age is 7.5 years (goal is 6) Ridership increased 5% from 2007 to 2008 Amount of transit vehicles decreased 6% Amount of miles travelled fell 8% Funding from the state has been reduced by 63% since 2000
  • 16.
    Ohio C- B-C D+ C+ C- C- D C D+ C- D
  • 17.
    $1,350,000,000 $190,100,000,000 TransitSubject National Ohio Aviation $40,700,000,000 $117,000,000 Bridges $549,500,000,000 $3,600,000,000 Dams $7,450,000,000 $300,000,000 Drinking Water $108,600,000,000 $9,680,000,000 Electricity $29,500,000,000 * Parks & Recreation $47,170,000,000 $556,000,000 Rails $11,700,000,000 $1,190,000,000 Roads (included w/ Bridge) $10,050,000,000 Schools $35,000,000,000 $9,320,000,000 Wastewater (included w/ Drinking Water) $11,160,000,000 Total Shortfall $1,019,720,000,000 $47,323,000,000
  • 18.
    1) Increase local,regional, state, and federal leadership to address the current and future conditions of each system 2) Promote sustainability and resilience in infrastructure to protect the natural environment and withstand natural and manmade hazards
  • 19.
    3) Develop national,regional, state, and local infrastructure plans that complement a national vision and focus on system-wide results 4) Address life-cycle costs and on-going maintenance to meet the needs of current and future users
  • 20.
    5) Increase andimprove infrastructure investment from all stakeholders
  • 21.
    Copies of thefull report or any sections can be downloaded at: www.ohioasce.org
  • 22.
    GRADE: C Morethan 2,600 dams in Ohio 68% privately owned, 23% local, 7% state, 2% fed 1,597 state-regulated dams 375 High Hazard Class I 543 Significant Hazard Class II 679 Low Hazard Class III ODNR dam staff reduced 15% since 2007 Estimated need of $309 M for repair
  • 23.
    GRADE: D+ More6,000 public water systems in Ohio 90% of Ohioans receive water from public system 99% of funding from local sources ARRA will fund $58.5 M in water projects 1,400 requests for more than $3 B Estimated $9.68 B needed
  • 24.
    GRADE: C+ Generation,transmission and distribution satisfactory to meet current needs Most outages due to weather related issues Usage level between 1995 and 2005 70% of generation by coal and nuclear, 29% by natural gas & oil Usage: 29% commercial, 37% industrial, 34% residential 2008 – SB 221 mandates at least 12.5% energy from alternative sources Coal provides 2/3 of Ohio’s electric generating capacity No estimate provided due to unknown federal regulations
  • 25.
    GRADE: C- ODNRowns 74 parks, 20 forests, 132 preserves More than 714,000 acres ODNR jurisdiction over 14 scenic rivers, 7,000 miles of streams More than 120,000 acres State park system includes: 10,000 campsites in 57 campgrounds 80 beaches and 188 boat ramps 390 trails totaling more than 1,200 miles Estimate $556 M to eliminate deferred CIP backlog
  • 26.
    GRADE: C 1997School funding found unconstitutional OSFC created to oversee public schools Worked with 75% of local school districts Manage $5.92 B per year for last 10 years 481 renovated facilities, 141 under construction, 25 SD/year All facility needs met in 123 SD thru 2007 Need has decreased from $20.9 B in 2001 to $9.32 B in 2008, still ranks 6 th in U.S.
  • 27.
    GRADE: D+ Generallack of data As of June 2008 Ohio had 1,300 known CSO in 86 communities Nationally, CSOs discharge 850 B gallons / year Overflows due to blocked or broken pipes = 10 B Gal /yr Local governments provide more than 94% of funds ASCE estimates $11.16 B needed