Fasanara Capital | Investment Outlook
1. The Future Is Wide Open: Avoid The ‘Illusion Of Knowledge’ Trap
The single most dangerous thinking trap / optical illusion for investors today is to look at Trump, Brexit and Italy Referendum as non-events, buried in the past. We believe that 2017 may likely be driven by the same factors that failed to shape 2016. The non-events of 2016 are likely to be the drivers of 2017. Finally, we will get to find out if Brexit means Brexit, if Trump means Trump, if a failed Italian referendum means early elections and a membership of the EMU in jeopardy down the line.
2. Structural Shift: These Are Transformational Times
The macro outlook of the next years will be influenced the most by these structural trends:
› Protectionism, De-Globalization & De-Dollarization. In Pursuit of Inclusive Growth
› End of ‘Pax Americana’. The ascent of China. Geopolitical risks on the rise
› End of ‘Pax QE’. Markets without steroids, but still delusional.
› 4th Industrial Revolution: labor participation rate falling from 63% to 40% in 10 years?
3. Our Baseline Scenario: Bubble Unwind, Equities and Bonds Down
Starting this 2017, our major macro convictions are as follows:
› Global Tapering to progress
› US Dollar to keep grinding higher
› European Political Instability to worsen
› US Equities to weaken
« Market Perspectives » est notre revue mensuelle des marchés. Elle présente de la façon la plus synthétique possible :
- notre analyse des principaux faits marquants et indicateurs macro susceptibles de dessiner les marchés sur le mois.
- notre vision sur les différentes classes d’actifs
Cette revue sera continument enrichie avec nos indicateurs quantitatifs.
La plupart de nos analyses sont disponibles sur www.finlightresearch.com
Our monthly publication “Market Perspectives” presents a synthetic view of all the asset classes we cover.
The report is composed of six sections covering Macro, Equities, FI & credit, FX, Commodities and Alternatives.
Each section is preceded by a summary of our views on the related asset class.
Most of our publications are available on our web site www.finlightresearch.com
1. Reflation Phase To Be Temporary, More Downside Ahead
Earlier on in 2016, ‘random and violent markets’ went off to panic mode out of (i) fears over China’s messy stock market and devaluing currency, (ii) plummeting oil price, (iii) strong US Dollar. Today, we believe complacent markets are similarly illogical and over-shooting, this time on the way up. As we re-assess the validity of the underlying risks, we expect a shift in narrative in the few months ahead and a sizeable sell-off for risk assets.
2. Four Key Conviction Ideas
We analyze below our key ideas for the next 12 months:
Short Chinese Renminbi Thesis. In Q1, China only managed to keep GDP in shape by means of graciously expanding credit by a monumental 1 trn $. Unsurprisingly, at 250% total debt on GDP, you cannot borrow 10% of GDP per quarter for long, without a currency adjustment, whether desired or not.
Short Oil Thesis. Long-term, we believe Oil will follow a volatile path around a declining trend-line, which will take it one day to sub-10$. Within 2016, we expect global aggregate demand to stay anemic and supply to surprise on the upside, inventories to grow, primarily due to the accelerating speed of technological progress.
Short S&P Thesis. To us, the S&P is priced to perfection, despite a most cloudy environment for growth and risk assets, thus representing a good value short, for limited upside is combined with the risk of a sizeable sell-off in the months ahead.
Short European Banks Thesis. We believe that micro policies at the local level, while valid, are impotent against heavy structural macro headwinds, and only the macro environment can save the banking sector in its current form in the longer-term. Macro structural headwinds for banks these days are too heavy a burden (negative sloped interest rate curves, deeply negative interest rates, deflationary economy, depressed GDP growth, over-regulation, Fintech), and will likely push valuations to new lows in the months/years ahead.
Fasanara Capital | Investment Outlook
1. Fake Markets: How Artificial Money Flows Kill Data Dependency, Affect Market Functioning and Change the Structure of the Market
Hard data ceased to be a driver for markets, valuation metrics for bonds and equities which held valid for over a century are now deemed secondary. Narratives and money flows trump hard data, overwhelmingly.
‘Fake Markets’ are defined as markets where the magnitude and duration of artificial flows from global Central Banks or passive investment vehicles have managed to overwhelm and narcotize data-dependency and macro factors. A stuporous state of durable, un-volatile over-valuation, arrested activity, unconsciousness produced by the influence of artificial money flows.
- Passive Flows: The Prehistoric Elephant In The Room
- ETFs Are Taking Over Markets
- The Impact of Passive Investors on Active Investors: the Induction Trap
- How Narratives Evolve To Cover For Fake Markets
- Defendit Numerus: There is Safety in Numbers
- What Could We Get Wrong
2. Be Short, Be Patient, Be Ready
Markets driven by Central Banks, passive investment vehicles and retail investors are unfit to price any premium for any risk. If we are right and this is indeed a bubble (both in equity and in bonds), it will eventually bust; it is only a matter of time. The higher it goes, the higher it can go, as more swathes of private investors are pulled in. The more violently it can subsequently bust.
The risk of a combined bust of equity and bonds is a plausible one. It matters all the more as 90%+ of investors still work under the basic framework of a balanced portfolio, exposed in different proportions to equity and bonds, both long. That includes risk parity funds, a leveraged version of balanced portfolio. That includes alternative risk premia funds, a nice commercial disguise for a mostly long-only beta risk, where premia is extracted from record rich markets that made those premia tautologically minuscule.
Fasanara Capital | Investment Outlook
1. The Future Is Wide Open: Avoid The ‘Illusion Of Knowledge’ Trap
The single most dangerous thinking trap / optical illusion for investors today is to look at Trump, Brexit and Italy Referendum as non-events, buried in the past. We believe that 2017 may likely be driven by the same factors that failed to shape 2016. The non-events of 2016 are likely to be the drivers of 2017. Finally, we will get to find out if Brexit means Brexit, if Trump means Trump, if a failed Italian referendum means early elections and a membership of the EMU in jeopardy down the line.
2. Structural Shift: These Are Transformational Times
The macro outlook of the next years will be influenced the most by these structural trends:
› Protectionism, De-Globalization & De-Dollarization. In Pursuit of Inclusive Growth
› End of ‘Pax Americana’. The ascent of China. Geopolitical risks on the rise
› End of ‘Pax QE’. Markets without steroids, but still delusional.
› 4th Industrial Revolution: labor participation rate falling from 63% to 40% in 10 years?
3. Our Baseline Scenario: Bubble Unwind, Equities and Bonds Down
Starting this 2017, our major macro convictions are as follows:
› Global Tapering to progress
› US Dollar to keep grinding higher
› European Political Instability to worsen
› US Equities to weaken
« Market Perspectives » est notre revue mensuelle des marchés. Elle présente de la façon la plus synthétique possible :
- notre analyse des principaux faits marquants et indicateurs macro susceptibles de dessiner les marchés sur le mois.
- notre vision sur les différentes classes d’actifs
Cette revue sera continument enrichie avec nos indicateurs quantitatifs.
La plupart de nos analyses sont disponibles sur www.finlightresearch.com
Our monthly publication “Market Perspectives” presents a synthetic view of all the asset classes we cover.
The report is composed of six sections covering Macro, Equities, FI & credit, FX, Commodities and Alternatives.
Each section is preceded by a summary of our views on the related asset class.
Most of our publications are available on our web site www.finlightresearch.com
1. Reflation Phase To Be Temporary, More Downside Ahead
Earlier on in 2016, ‘random and violent markets’ went off to panic mode out of (i) fears over China’s messy stock market and devaluing currency, (ii) plummeting oil price, (iii) strong US Dollar. Today, we believe complacent markets are similarly illogical and over-shooting, this time on the way up. As we re-assess the validity of the underlying risks, we expect a shift in narrative in the few months ahead and a sizeable sell-off for risk assets.
2. Four Key Conviction Ideas
We analyze below our key ideas for the next 12 months:
Short Chinese Renminbi Thesis. In Q1, China only managed to keep GDP in shape by means of graciously expanding credit by a monumental 1 trn $. Unsurprisingly, at 250% total debt on GDP, you cannot borrow 10% of GDP per quarter for long, without a currency adjustment, whether desired or not.
Short Oil Thesis. Long-term, we believe Oil will follow a volatile path around a declining trend-line, which will take it one day to sub-10$. Within 2016, we expect global aggregate demand to stay anemic and supply to surprise on the upside, inventories to grow, primarily due to the accelerating speed of technological progress.
Short S&P Thesis. To us, the S&P is priced to perfection, despite a most cloudy environment for growth and risk assets, thus representing a good value short, for limited upside is combined with the risk of a sizeable sell-off in the months ahead.
Short European Banks Thesis. We believe that micro policies at the local level, while valid, are impotent against heavy structural macro headwinds, and only the macro environment can save the banking sector in its current form in the longer-term. Macro structural headwinds for banks these days are too heavy a burden (negative sloped interest rate curves, deeply negative interest rates, deflationary economy, depressed GDP growth, over-regulation, Fintech), and will likely push valuations to new lows in the months/years ahead.
Fasanara Capital | Investment Outlook
1. Fake Markets: How Artificial Money Flows Kill Data Dependency, Affect Market Functioning and Change the Structure of the Market
Hard data ceased to be a driver for markets, valuation metrics for bonds and equities which held valid for over a century are now deemed secondary. Narratives and money flows trump hard data, overwhelmingly.
‘Fake Markets’ are defined as markets where the magnitude and duration of artificial flows from global Central Banks or passive investment vehicles have managed to overwhelm and narcotize data-dependency and macro factors. A stuporous state of durable, un-volatile over-valuation, arrested activity, unconsciousness produced by the influence of artificial money flows.
- Passive Flows: The Prehistoric Elephant In The Room
- ETFs Are Taking Over Markets
- The Impact of Passive Investors on Active Investors: the Induction Trap
- How Narratives Evolve To Cover For Fake Markets
- Defendit Numerus: There is Safety in Numbers
- What Could We Get Wrong
2. Be Short, Be Patient, Be Ready
Markets driven by Central Banks, passive investment vehicles and retail investors are unfit to price any premium for any risk. If we are right and this is indeed a bubble (both in equity and in bonds), it will eventually bust; it is only a matter of time. The higher it goes, the higher it can go, as more swathes of private investors are pulled in. The more violently it can subsequently bust.
The risk of a combined bust of equity and bonds is a plausible one. It matters all the more as 90%+ of investors still work under the basic framework of a balanced portfolio, exposed in different proportions to equity and bonds, both long. That includes risk parity funds, a leveraged version of balanced portfolio. That includes alternative risk premia funds, a nice commercial disguise for a mostly long-only beta risk, where premia is extracted from record rich markets that made those premia tautologically minuscule.
« Market Perspectives » est notre revue mensuelle des marchés. Elle présente de la façon la plus synthétique possible :
- notre analyse des principaux faits marquants et indicateurs macro susceptibles de dessiner les marchés sur le mois.
- notre vision sur les différentes classes d’actifs
Cette revue sera continument enrichie avec nos indicateurs quantitatifs.
La plupart de nos analyses sont disponibles sur www.finlightresearch.com
Our monthly publication “Market Perspectives” presents a synthetic view of all the asset classes we cover.
The report is composed of six sections covering Macro, Equities, FI & credit, FX, Commodities and Alternatives.
Each section is preceded by a summary of our views on the related asset class.
Most of our publications are available on our web site www.finlightresearch.com
Us economy goldilocks- 4th oct 2007 published in singapore timessatya saurabh khosla
The author's article that appeared in Business Times, Singapore on Oct 4, 2007 stated that USA Housing, low interest rates and derivatives will lead the global economy into a recession
Economist Intelligence Unit (EIU) white paper produced at the height of the financial crisis in January 2009 outlining the opportunities to learn from the downturn and best practice to success in a changing environment.
Shippers Warehouse, Inc. is a provider of supply chain services (3rd party logistics or 3PL). The Company operates over 4.5 million square feet in 8 facilities in the Dallas/Ft. Worth area and 500,000 square feet in Atlanta, Georgia.
The Georgia facility packaging operations ships out over 3 billion bags per year. Shippers Warehouse is one of the largest co-packers in the Southeast. Shippers operate 9 packaging lines with a ready room that is a showcase for reducing any type of foreign matter. The facility handles a variety of food products, is a leader in recycling, & distribution of products.
Shippers Warehouse, Inc. also has the distinction of having all of its locations ISO 9001:2008 certified. (ISO 9001:2008 certified by Management Certification of North America, an ANAB-accredited certification body.)
Regards,
Bill Stankiewicz
Vice President & General Manager
Shippers Warehouse
Office: 678.364.3475
williams@shipperswarehouse.com
www.shipperswarehouse.com
Investors caught off guard by the Great Game’s evolution
stand to lose – on the low end – $1.41 trillion every year from
Wall Street alone.
And billions more could be eradicated from their bank
accounts due to spikes in energy and natural resource prices
– mixed with sharp drops in the U.S. dollar.
Ask yourself: Are you protected?
You don’t want to be left without a chair when the music stops.
As this Global Game unfolds, our entire way of life will
experience a dramatic shift for which very few investors have
prepared http://withDrDavid.com
Here’s a taste of the road ahead for the global economy:
• Coming supply shocks to natural resources – from oil and gas
to grains and rare earth metals – could unleash rampant
inflation that tears through every corner of the world economy.
• Exposure to mounting domestic debt leaves numerous leading
economies vulnerable to mounting geopolitical pressures,
reducing their political influence and driving up interest rates.
• The re-balancing of power between nations could cause
certain currencies to crash, economies to weaken, and
companies to crumble.
Our monthly publication “Market Perspectives” presents a synthetic view of all the asset classes we cover.
The report is composed of six sections covering Macro, Equities, FI & credit, FX, Commodities and Alternatives.
Each section is preceded by a summary of our views on the related asset class.
Most of our publications are available on our web site www.finlightresearch.com
Please note that our risk-based benchmark (cross-asset allocation calibrated to a given C-Var), our tilted portfolio (with tactical overlay exposures implied by the market views expressed above), as well as the corresponding main characteristics (usual statistics, risk contributions, backtests…), are available only for our subscribers.
The ebb and flow of financial markets brings with it a shift in focus from one theme to another, often amplifying the different factors affecting the market. As discussed in our latest issues of Monthly Perspectives, risk has moved to the forefront for investors. Most recently, the unexpected outcome of the Brexit vote brought a wave of political uncertainty and with it, an increased focus on a broader theme: geopolitical risk.
12913, 515 PMGlobal financial crisis five key stages 2007-.docxhyacinthshackley2629
12/9/13, 5:15 PMGlobal financial crisis: five key stages 2007-2011 | Business | The Guardian
Page 1 of 5http://www.theguardian.com/business/2011/aug/07/global-financial-crisis-key-stages
Search
A trader at the New York stock exchange. The last four years have seen five key stages of the global financial crisis,
with more likely to come. Photograph: Brendan Mcdermid/Reuters
9 August 2007. 15 September 2008. 2 April 2009. 9 May 2010. 5 August 2011. From
sub-prime to downgrade, the five stages of the most serious crisis to hit the global
economy since the Great Depression can be found in those dates.
Phase one on 9 August 2007 began with the seizure in the banking system precipitated
by BNP Paribas announcing that it was ceasing activity in three hedge funds that
specialised in US mortgage debt. This was the moment it became clear that there were
tens of trillions of dollars worth of dodgy derivatives swilling round which were worth a
This site uses cookies. By continuing to browse the site you are agreeing
to our use of cookies. Find out more here
Global financial crisis: five key stages
2007-2011
From sub-prime mortgages in 2007 to the newly downgraded US
debt status, the latest crisis point is unlikely to be the last
Larry Elliott, Economics editor
The Guardian, Sunday 7 August 2011 16.49 BST
http://www.theguardian.com/uk
http://www.theguardian.com/business/global-economy
http://www.theguardian.com/info/cookies
http://www.theguardian.com/profile/larryelliott
http://www.theguardian.com/profile/larryelliott
http://www.guardian.co.uk/theguardian
12/9/13, 5:15 PMGlobal financial crisis: five key stages 2007-2011 | Business | The Guardian
Page 2 of 5http://www.theguardian.com/business/2011/aug/07/global-financial-crisis-key-stages
lot less than the bankers had previously imagined.
Nobody knew how big the losses were or how great the exposure of individual banks
actually was, so trust evaporated overnight and banks stopped doing business with each
other.
It took a year for the financial crisis to come to a head but it did so on 15 September
2008 when the US government allowed the investment bank Lehman Brothers to go
bankrupt. Up to that point, it had been assumed that governments would always step in
to bail out any bank that got into serious trouble: the US had done so by finding a buyer
for Bear Stearns while the UK had nationalised Northern Rock.
When Lehman Brothers went down, the notion that all banks were "too big to fail" no
longer held true, with the result that every bank was deemed to be risky. Within a
month, the threat of a domino effect through the global financial system forced western
governments to inject vast sums of capital into their banks to prevent them collapsing.
The banks were rescued in the nick of time, but it was too late to prevent the global
economy from going into freefall. Credit flows to the private sector were choked off at
the same time as consumer and business confidence collapsed. All this came a.
1. MARKET OVERVIEW
Rarely has Wall Street experienced dislocation on the scale seen in October 2008. The
market crashes in October 1929 and October 1987 are the closest reference points. Global equi-
ties imploded last month, as alarm over the health of the world economy rose to a fever pitch.
During the first eight trading sessions, the S&P 500 ceded 23%. Aggressive monetary actions
helped avert an Armageddon scenario. Still, outside October 1987, last month was the worst for
the S&P 500 since its start in March 1957. Bloomberg reported a stunning $9.5 trillion in equity
losses.
With roots in the housing bust, the slow-motion crash of 2008 cut its teeth during Lehman
Brothers’ bankruptcy on September 15. Lehman’s collapse ignited a powder keg of risk aver-
sion. Bank lending effectively ceased. Industrial production plunged. Business investment
retrenched. Investors fled equities as the form of a severe recession darkened the horizon.
Record client redemptions forced hedge and mutual funds to dump stocks. The selling drove
prices even lower and fear levels higher.
The burgeoning crisis concentrated the minds of the world’s monetary authorities. The Federal
Reserve joined the European Central Bank and the Bank of England in an unprecedented
round of coordinated interest rate cuts.
Central banks in at least eleven other
countries followed suit. Globally, govern-
ments earmarked $3 trillion in emergency
bailout and economic stimulus packages,
including the $700 billion authorized by the
U.S. Congress. The International Monetary
Fund offered multi-billion dollar lifelines to
Iceland, Hungary and Ukraine as their
economies wobbled. The Fed superseded
the private lending market, openly
purchasing short-term corporate debt.
Combined, the measures helped stabilize
market confidence, and stocks pared
losses as October shuddered to a close.
The outlook for earnings remains
weak. On October 1, Thomson Reuters
estimated 3Q08 profits for the S&P 500 fell
4.3%. On October 31, the estimate was
-11.7%.
by Greg Meier
O C T O B E R 2 0 0 8
AT THE MARGIN
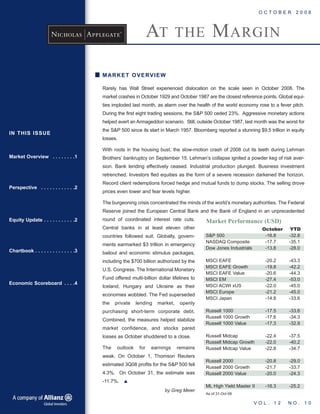
October YTD
S&P 500 -16.8 -32.8
NASDAQ Composite -17.7 -35.1
Dow Jones Industrials -13.8 -28.0
MSCI EAFE -20.2 -43.3
MSCI EAFE Growth -19.8 -42.2
MSCI EAFE Value -20.6 -44.3
MSCI EM -27.4 -53.0
MSCI ACWI xUS -22.0 -45.0
MSCI Europe -21.2 -45.0
MSCI Japan -14.8 -33.6
Russell 1000 -17.5 -33.6
Russell 1000 Growth -17.6 -34.3
Russell 1000 Value -17.3 -32.9
Russell Midcap -22.4 -37.5
Russell Midcap Growth -22.0 -40.2
Russell Midcap Value -22.8 -34.7
Russell 2000 -20.8 -29.0
Russell 2000 Growth -21.7 -33.7
Russell 2000 Value -20.0 -24.3
ML High Yield Master II -16.3 -25.2
As of 31-Oct-08
Market Performance (USD)
V O L . 1 2 N O . 1 0
IN THIS ISSUE
Market Overview . . . . . . . .1
Perspective . . . . . . . . . . . .2
Equity Update . . . . . . . . . . .2
Chartbook . . . . . . . . . . . . . .3
Economic Scoreboard . . . .4
2. PERSPECTIVE
THE END OF PROSPERITY
Unfortunately, my worst fears are rapidly
unfolding and the stock market is now
its own version of the end of prosperity. The
dynamic, however, is truly deadly. Financial
panics, if left alone, rarely cause much
damage to the real economy, output,
employment or production. Asset values fall
sharply and wipe out those who borrowed
and lent too much, thereby redistributing
wealth from the foolish to the prudent. When
markets are free, asset values are supposed
to go up and down, and competition opens
opportunities for profits and losses. Profits
and stock appreciation are not rights, but
are rewards for insight mixed with a willing-
ness to take risk. People who buy homes
and the banks who give them mortgages are
no different, in principle, than investors in
the stock market, commodity speculators, or
shop owners.
These issues aren’t Republican or
Democrat, nor liberal or conservative. They
are simply economics, and bad economics
will sink any economy no matter how much
we wish to believe this time things are
different. They aren't.
Each of these government actions sepa-
rately increases the tax burden on the
economy and doesn't do anything to
encourage economic growth. And the stock
market knows it. The stock market is
forward looking, reflecting the current value
of future expected after-tax profits. An
improving economy carries with it the pros-
pects of enhanced profitability as well as
higher employment, higher wages, more
productivity and more output. Just look at
the era beginning with President Reagan’s
tax cuts, former Federal Reserve Chairman
Paul Volcker's sound money, and all the
other pro-growth supply-side policies.
Arthur B. Laffer,
Ph.D.
Ph.D. and M.B.A. —
Stanford University
B.A. — Yale University
EQUITY UPDATE
STYLE AND MARKET
CAPITALIZATION
Investors searching for shelter last month found
no quarter. Regardless of style or market capi-
talization, share prices collapsed. The Russell
1000, Russell Midcap and Russell 2000
indexes all posted their second-worst month
since incepting in January 1979. The ‘Black
Monday’ crash of October 1987 remains the
worst month for the indexes. Small caps fell
harder than large caps, in part because of a
spike in hedge fund selling. Hedge funds tend
to own more small companies than large
companies.
S&P 500 SECTORS AND INDUSTRIES
Every S&P 500 sector and industry lost ground
last month, with the large majority of categories
down by more than 10%. Financials was the
worst-performing sector; on average, insurance
and real estate firms took a more than 30%
haircut in their market value in October.
Consumer discretionary was the third-worst-
performing sector, weighed down by a more
than 40% one-month drop in auto industry
stocks. Auto-related shares are down nearly
70% so far this year. Four hundred and
seventy S&P 500 companies closed lower.
INTERNATIONAL EQUITY
The credit crisis rocking Wall Street ravaged for-
eign equity markets. Japan’s Nikkei Average
plunged a record 24%, touching a twenty-six-
year low. That means no appreciation for Nikkei
investors between October 1982 and October
2008. The British FTSE 100 fell 11%, its biggest
decline since the 1987 market crash. The MSCI
Emerging Markets Index crumpled 27%, the
most since the Russian debt default in 1998.
The MSCI All Country World Index fell 20%, the
most in its twenty-year history. All forty-eight
countries in the index closed in the red. Thirty-
seven countries lost more than 20%.
AT THE MARGIN is a
monthly publication of:
Nicholas-Applegate
Capital Management
600 West Broadway
San Diego, CA 92101
PHONE 800.656.6226
619.687.8000
FAX 619.744.5545
Copyright 2008
..>Nicholas-Applegate
....Capital Management
2
Dr. Laffer previously
worked on President
Reagan’s Economic
Policy Advisory Board,
and was Chief
Economist for the
Office of Management
and Budget. Dr. Laffer
is a trustee on the
Nicholas-Applegate
Institutional Funds
board, and is the
founder and CEO of
Laffer Associates. He
recently co-authored,
“The End of
Prosperity — How
Higher Taxes Will
Doom the Economy —
If We Let It Happen,”
with Stephen Moore
and Peter J. Tanous.
3. 3
Source: Bloomberg
As of 29-Oct-08
Billions
Corporate Borrowing: Uncle Sam Turns on the Taps
1200
1400
1600
1800
2000
2200
00 01 02 03 04 05 06 07
Outstanding Commercial Paper (weekly)
$
Source: Federal Reserve
As of 31-Oct-08
Billions
Joe Consumer Tightens His Belt
-10
0
10
20
1943 1956 1969 1982 1995 2008
Consumer credit (monthly change)
$
CHARTBOOK — RESEARCH FROM THE FIELD
The VIX Index, which reflects an estimate of
future market volatility for the S&P 500 Index,
has exploded to the upside in recent weeks.
This measure of volatility is at nearly twice
the levels of both the Internet bubble and
September 11, 2001 terrorist attacks. The
stock market is truly experiencing extraordi-
nary times, with six of the ten largest S&P
500 point drops in history occurring in the last
seven weeks.
Consumer debt outstanding plunged $7.9
billion in August, the most on records dating
back to 1943. The contraction reveals a new
weak point for average Americans already
struggling with a housing recession, job losses
and sinking real wages. It could portend
another leg down in consumer spending.
The August decline was predominantly a
factor of non-revolving debt like auto and
student loans, which fell at a 5.4% annualized
rate. A category of revolving debt that includes
credit cards also declined, down 0.8%.
Commercial paper, or short-term, unsecured
loans made to companies to finance day-to-
day operations, rose for the first time since
Lehman Brothers filed for bankruptcy mid-
September. This event indicates credit
markets are beginning to thaw; however,
much, if not all of the recent demand was
due to the Federal Reserve's program to
prop up debt rather than “natural” buyers.
Source: Bloomberg
As of 31-Oct-08
Value(WeeklyHigh)
Date Daily Point Change
9/29/2008 -106.62
10/15/2008 -90.17
4/14/2000 -83.95
10/9/2008 -75.02
8/31/1998 -69.86
10/27/1997 -64.65
10/7/2008 -60.66
9/15/2008 -59.00
10/22/2008 -58.27
10/19/1987 -57.86
S&P 500 Historical Moves
The VIX Index: Wall Street's Fear Gauge Explodes
0
20
40
60
80
99 00 01 02 03 04 05 06 07 08
4. 4
600 WEST BROADWAY SAN DIEGO, CA 92101 (800) 656-6226 • (619) 687-8000
WWW.NICHOLAS-APPLEGATE.COM
DISCLOSURE:
There is no guarantee that any opinion, forecast, or objective will be
achieved. The information herein is provided for informational purposes only
and should not be construed as a recommendation of any security, strategy
or investment product.
The asset and industry reports contained herein are unaudited. The
summation of dollar values and percentages reported may not equal the total
values, due to rounding discrepancies. Unless otherwise noted, Nicholas-
Applegate is the source of illustrations, performance data, and
characteristics. Unless otherwise noted, equity index performance is
calculated with gross dividends reinvested and estimated tax withheld, and
bond index performance includes all payments to bondholders, if any.
Indexes may not represent the investment style of any Nicholas-Applegate
strategy. Index calculations do not reflect fees, brokerage commissions or
other expenses of investing. Investors may not make direct investments into
any index.
This is not an offer or solicitation for the purchase or sale of any financial
instrument. It is presented only to provide information on investment
strategies and opportunities. The material contains the current opinions of
the author, which are subject to change without notice. Statements
concerning financial market trends are based on current market conditions,
which will fluctuate. Forecasts are inherently limited and should not be relied
upon as an indicator of future results. References to specific securities,
issuers and market sectors are for illustrative purposes only. This presen-
tation should not be construed as a general guide to investing, or a
recommendation regarding any investor’s specific circumstances. Although
the manager attempts to limit portfolio risk, risk management does not imply
low risk. All investments are subject to some degree of market and
investment-specific risk. The value of investments can go down as well as
up, and a loss of principal may occur. No part of this material may be copied
or duplicated, or distributed to any third party without written consent.
Small- and mid-cap stocks may be subject to a higher degree of risk than
more established companies’ securities. The illiquidity of the markets for
these stocks may adversely affect the value of these investments.
Investments in overseas markets may pose special risks, including currency
fluctuation and political risks, and the portfolio is expected to be more volatile
than a U.S.-only portfolio. These risks are generally intensified for
investments in emerging markets.
ECONOMIC SCOREBOARD
COMMENTS
POSITIVE Monetary Policy Fed trimmed rates to four-year low 1.00% on Oct. 29; more cuts possible
Inflation CPI slid from 5.4% in Aug. to 4.9% in Sept.; Core CPI unchanged at 2.5%
Oil Prices Prices retreated 33% in October, biggest monthly drop on record
Valuations The forward-looking P/E of the S&P 500 fell to a 10+ year low of 9.6 in Oct.
NEUTRAL Housing Sales are rising year-over-year, but starts and permits are still sinking
NEGATIVE GDP Contracted 0.3% in 3Q08 on biggest drop in consumer spending in 28 yrs.
Geopolitical Iceland, Hungary, Belarus, Pakistan and Ukraine requesting IMF help
Consumer Confidence Plunged to a record low in October, according to the Conference Board
Business Inventories Stocks increased a second month in August due to a sharp drop in sales
Industrial Production Tumbled 2.8% in Sept. on hurricanes and Boeing strike; most since 1974
Retail Sales Skidded a third month in Sept.; longest contraction since at least 1992
Investor Sentiment Market fear surged to an all-time high on Oct. 24 (CBOE VIX)
Employment 159,000 nonfarm jobs lost in September; most since March 2003
Corporate Earnings Estimates continue to deteriorate; fifth straight quarter of contraction likely
As of 31-Oct-08
Assessment Of Current Economic Indicators