Downloaded 29 times


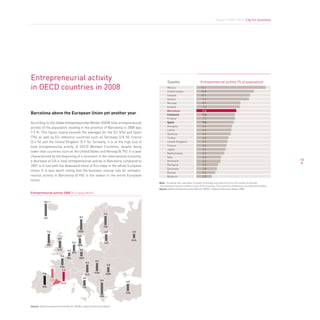


![THE WELL-CONNECTED The imperative of innovation
CITY
The battleground of international competitiveness in the 21st century
is innovation and cities [1], which are increasingly viewed as the caul-
drons of innovation, enriching not only their surrounding regions, but
AN INTEGRATED APPROACH their nations. Across the globe, cities are undergoing massive renewal,
fundamental shifts in the nature of work and the workplaces they host,
TO PLANNING AND DEPLOYMENT and transformations to their output and consumption. And in the rap-
OF DIGITAL TECHNOLOGIES idly industrialising countries we see small towns being transformed into
metropolises and entire new cities planned. From the City of London to
Chennai, Shoreditch to Shanghai, and Amsterdam to Dubai; cities are
April 2010 growing, transforming and repositioning themselves as players on a glo-
Nick Leon, Director of Design London at the Royal College bal stage. This transformation includes major installation and renewal of
of Art and Imperial College ICT infrastructures and radical changes in the delivery of public services.
Historically, cities became established at the intersections of trade
routes or where geography favoured production and distribution of physi-
cal goods. These advantages were reinforced through agglomeration,
economies of scale, the development of sophisticated infrastructures,
66 especially road, rail and air links, and the enrichment and diffusion of
expert knowledge through universities and research centres. In present
day knowledge-based, services-led economies where communications
networks can sometimes seem more important than rail and road net-
works, global cities are emerging as the command and control centres of
international business, and the ICT infrastructure they provide is a major
influence on businesses seeking to relocate. [2], [3]
The Knowledge-Based, Networked Economy and the Role of ICT
In a global and highly networked economy, cities are linked one to another
and in turn to secondary nodes of production, distribution and consump-
tion. There is evidence that the strongest cities become stronger and for
those that are left behind the climb to achieve prosperity is long and tortu-
ous. For instance, New York is the only one of the 16 largest cities, in either
the north-eastern or mid-western United States, with a higher population
today than it had 50 years ago. The decline of some cities has been precipi-
tous, with their populations halving over the last 70 years while the total US
population almost doubled in the same period. As Glaeser pointed out in
his analysis of the Skilled City, the stakes are high and the future economic
vitality of major cities depends on their ability to attract, develop and main-
tain skilled resources. [4], [5]
The topic I am investigating in this paper is how cities are using techno-
logical systems to transform and compete in the global knowledge-based
economy, and the role of digital and communications technologies and re-
lated services and how they fit into a more comprehensive, integrated ap-
proach to planning. Roads, railways and airports, electricity and telecom-
munications transformed cities in the 19th and 20th centuries. How are](https://image.slidesharecdn.com/observatori09angls-110110032557-phpapp02/85/The-Barcelona-Observatory-2009-10-Report-68-320.jpg)
![Report 2009-2010. Monographic
investments in new digital technologies and differences in deployment and
usage models favouring certain cities in the rapidly shifting 21st century While the city deployments differed considerably. as did the outcomes,
world? It is an environment where cities are competing for investment and we identified a common set of problems encountered by cities and city
new jobs, and trying to become hubs of innovation in the knowledge econo- districts. These are:
my to deliver prosperity to their citizens.
• capabilities of public sector organisations to develop, build and operate
In this paper we explore the key challenges facing cities in their deploy- the systems
ment of pervasive broadband networks and related services and draw par- • sustainable business model
allels with the challenges faced by cities in the 19th century in their de- • achieving cross-departmental buy-in and cooperation
ployment of telephony and electrical networks. The analysis can provide
• transforming service delivery rather than simply e-enabling the front
guidance to policymakers and practitioners, especially technology and ICT
end of existing services
service providers. This guidance is embodied in a strategic planning model
based on eight factors related to these challenges. This model provides • creating compelling content and services and engaging and involving
policymakers and practitioners with a tool for a more integrated approach the community in determining the content, services and priorities
to planning, the prioritisation of requirements, the assessment of vendor • comprehensive deployment models and accessibility for the entire
propositions, and calibration of systems once they have been deployed. community including people with special needs
• internal and external governance and asset ownership models; clear
Over a two-year period, Imperial College London carried out nine detailed definition of roles and responsibilities.
case studies in European and US cities and a quantitative analysis of 168
US cities [6]. The research involved interviewing over 100 members of the A comparison of the case study cities with the experience of cities at the 67
city authorities and related agencies and private sector organisations. The end of the 19th and early 20th centuries, as they deployed new techno-
findings were published in 2010. logical infrastructures such as electricity, telephony, telegraphy, etc,
highlights similar sets of challenges. Historical analysis as well as Large
The individual city case studies, information from interviews and documen- Technical Systems (LTS) theory [7], [8] predicts many of the problems be-
tation on other cities, show that there is wide variation in terms of the suc- ing experienced by the cities in the case studies and points to a series
cess of the various initiatives. of factors that must be addressed for a city to successfully exploit new
technological infrastructures and deliver the social and economic divi-
The research highlighted the need for a more integrated approach to plan- dend from their deployment.
ning technical infrastructure with spatial planning, economic development
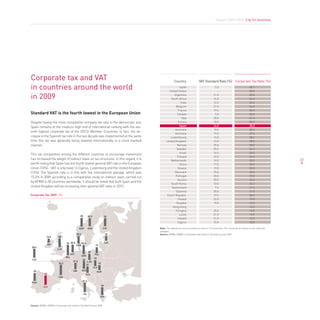
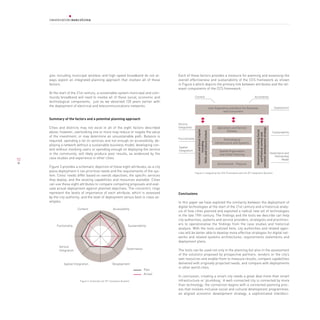
and social capital development strategies within the city. This model, which
is depicted in Figure 1, illustrates the principle attributes of what we refer
to as a Well-Connected City.
Eight factors that can influence a successful outcome
Infrastructure Regional and city
and services level policies for
to support innovation including I have synthesised the challenges that emerge from the case studies and
knowledge presence of lead those predicted by LTS theory and the related literature on urbanism,
intensive, service users innovation and capabilities, into eight key factors for effective city-wide
led, networked
economy
Infrastructure economic
Demand as well broadband networks and related services. The case studies and other
and Services Development interviews indicate that these factors are those most likely to influence
as supply side
interventions successful outcome and that lack of focus in any one of them could result
Well in flawed deployment and suboptimal outcomes.
Connected
City We will now examine each of these factors in relation to the case stud-
ies, and some examples of best practice. The eight influencing factors we
Built environment, Large pool consider are:
amenities and urban Design Social Capital of scientific
programmes and technical
to attract and resources and 1. functionality
connect firms and regional market 2. accessibility
skilled knowledge for specialised
workers skills 3. compelling content
4. deployment and delivery
Figure 1: Integrated Planning Model for a Well-Connected City 5. service integration](https://image.slidesharecdn.com/observatori09angls-110110032557-phpapp02/85/The-Barcelona-Observatory-2009-10-Report-69-320.jpg)
![6. spatial integration ing a broad range of devices. Corpus Christi deployed around 2,000 nodes
7. governance and ownership to ensure an entire city and its suburbs could be covered by municipal
8. sustainability - economic, technological, environmental. broadband, while Stuttgart tested 1,500 different types of mobile phones
to ensure that its MobilCity services could be used almost regardless of
Functionality: refers to the nature of the infrastructure, the technolo- the type of device and its form factor.
gies and standards supported by the network, network capacity, latency,
availability, security and quality of service. Cities such as Taipei, Songdo Digital Bridge in Shoreditch, RegenTV in Newham and the telecare portal
in Seoul, and Canary Wharf are examples of high performance networks in Karlskrona are all examples of portals designed to be accessed using
with rich functionality supporting a broad range of technologies. Cities digital TV, and combine the familiar interface of a remote control, and
where coverage is patchy, performance inconsistent or poor find it dif- video and data formats accessible to users with limited or no experience
ficult to attract subscribers, and those they do attract often discontinue of using computers and browser-based GUI. The case study of the City
their subscriptions. Lack of security deters content providers and the en- of London in particular demonstrates that it is essential to allow other
terprise market. The importance of security, especially for the enterprise firms access to systems through the provision of guest capabilities for
market, was stressed in an interview with Niall Murphy, CTO of Cloud the wireless networks in firms they may be visiting. This highlights the
Networks, and by the Canary Wharf Corporation executive team respon- importance of security to give firms confidence in allowing access. Ac-
sible for Canary Wharf’s wireless network. The issue of functionality is cessibility also includes affordability of the service and a key element of
closely entwined with politics. Poor performance and patchy coverage of the deployment in Philadelphia, Corpus Christi and San Francisco was
municipal wireless networks, especially when they have been promoted the provision of low-cost broadband access for the community, including
as a low cost alternative to the DSL or cable broadband services from in- free wireless access to some city specific services.
68 cumbent telecoms operators, have political ramifications for the city au- Early deployments of electric and telephone networks experienced simi-
thorities and mayors who are promoting pervasive broadband availability lar problems including limitations of geographic coverage, especially into
for all as a key plank of their campaigns. dispersed suburbs, poor districts and rural environments and interop-
erability. Users were faced with the problem of proprietary systems and
Cities such as Corpus Christi, Portland and Philadelphia are regularly being locked into one supplier for all components of the system. The law
cited in the US press as examples of cities where the expectations of on interoperability of different services and networks was introduced in
citizens and performance of the network are not aligned, and where sub- the UK with the Electrical Act of 1882 and subsequent acts in 1885 which
scriber numbers are low and comments in online forums and chat rooms ensured that users could purchase electrical appliances from suppliers
are negative. A century ago there were similar problems in London when other than the electric network supplier. In the early days of electricity
each London borough acted independently and the lack of standardisa- supply, transformers were used to ensure interoperability before stand-
tion and limited functionality of services made electricity a luxury service ards emerged. The initial costs of the electricity supply in London meant
that offered little more than lighting. Compounding this were the early that home electric lighting was a luxury reserved for the rich. This con-
technical failures of flagship projects such as the Holborn Viaduct Station trasts with the situation in Berlin where the city authorities negotiated
and Sebastian de Ferranti’s Deptford project for a massive power station with AEG and Siemens & Halske to create the Berlin electricity supply
to supply most of London in the 1890s. The technical failure, particularly company, BEW, and where price was regulated by the city [7]. Policies to
at Deptford, increased political nervousness about large scale projects. ensure the widespread accessibility of electricity supply both in terms of
This highlights the importance of realistic expectations about functional- coverage and pricing were a core element in the public private partner-
ity, and promotion of that functionality. It underlines the importance of ships, one of the best being Berlin. The importance of coverage and ac-
ensuring effective technological understanding among city authority and cessibility is as relevant in digital technologies today as it was in teleph-
public officials. ony, telegraphy, electrical power, transport and sanitation over a century
ago, and accessibility has more than just a physical dimension.
accessibility: of municipal broadband networks and related services re-
fers to the need to provide access via a wide range of devices, PC, digital Compelling Content: Taking existing content and simply enabling it for
TV, mobile phones. It includes ease of access via a single portal with a delivery over a broadband network is likely to be ineffective as we found in
single sign-on to multiple applications, or via a familiar interface regard- the case studies. Both information and service content have to be highly
less of the technology. Network coverage and continuity or persistence of relevant to users, and users need to be involved in its definition and crea-
connection and applications on the move, as well as ubiquitous access tion. Digital Bridge is one of the best examples of compelling content and
are important. Affordability is also important. The case study of the City of shows that it requires regular updating in terms of content and style. Dig-
London explained how some boroughs had deployed a wireless network ital Bridge in Shoreditch is exemplary in its engagement with the local
that enabled users to work through their existing service provider inter- community, in establishing priorities for content, and creating a sense
faces – Vodafone, Skype, Vonage, i-Pass, etc. - that could be accessed us- of ownership. Another example is at Newham and the RegenTV project.](https://image.slidesharecdn.com/observatori09angls-110110032557-phpapp02/85/The-Barcelona-Observatory-2009-10-Report-70-320.jpg)
![Report 2009-2010. Monographic
Most of the TV content is created by the community, for the community. band-enabled internet services, and over 3 million people participated
This sense of ownership, locality and currency is crucial to usage, and in its programmes which kick started the massive exploitation of fixed
the importance of compelling content is reflected in the Barcelona case and mobile broadband services. In contrast, Barcelona’s Virtual Memoria
study and the Virtual Memoria project. project is trying to reach a large community of retired people as well as
schoolchildren. However, without the investment in deployment they are
The nature of the services and content of municipal or community broad- reaching only hundreds rather than tens of thousands of users who could
band networks is analogous to the multiplicity of applications of electri- benefit from this initiative. Similarly, Shoreditch was faced with deploy-
cal energy in the home. The development of telephony services since the ment challenges with the roll out of the Digital Bridge platform and servic-
1950s has transformed the value of telecommunications to the public es. These were again down to an imbalance of resources between service
and private sectors and for home use. In 1878, when Edison launched the innovation and service deployment.
benefits of installing electricity in their homes to the public it was on the
basis of incandescent lamps, electricity meters, and electrical appliances The growth of new energy technologies in the 19th century give some
such as dynamos. At that time he still had not developed a practical in- clues as to the challenges we might face in the 21st century with digital
candescent lamp or even reliable electricity generation or distribution technologies. Steam engines and then electrical networks deployments
capabilities. However, he knew that compelling applications and services emphasise the importance of generating demand through educating
would be required to establish a market. Within a decade, the firm Merz users on potential applications and value of services for residential and
and McLellan in England was working with firms to help them under- professional markets. Charles T James was an engineer in the late 19th
stand how to reorganise their manufacturing plants to exploit the new century who travelled the Eastern seaboard of the US explaining and edu-
energy source and Samuel Insull in Chicago ran the “electricity store” cating mill owners about the transformations achievable by steam pow-
to promote the appliances that could be used at home, spending more ered mills. He demonstrated how these mills could be relocated from
69
on the promotion of these services than was spent by the entire British the inaccessible and narrow valleys required for water power, to wharves
electricity industry at the time. The electric streetcar was another exam- where coal could be delivered and products transported more easily, or
ple of how electricity networks could deliver a new and valued service closer to the markets they served [8]. Engineering consultants, such as
for consumers. It was introduced first in Berlin and Chicago, and later in Von Miller, Merz and McLellan, and Klingenberg, worked in close partner-
New York. [7], [8] ship with entrepreneurs such as Emil Rathenau, who founded AEG, and
Edison to develop demand for electricity services. They worked with large
The old electrical networks and the new digital networks deliver value public sector and private corporations, demonstrating how electricity
through the services they enable. They are crucial enabling components could transform manufacturing processes and public transportation, and
in much larger socio-economic and technological network. The appli- designed the electrical systems to supply motors and machine tools. [7]
cations must be attractive whether an information search service for
employment opportunities in the borough, a managed service for small Deployment is the translation of a technological system into user value,
businesses (Corpus Christi and Shoreditch), a socio-cultural service such coupled with a transformation of the industrial, institutional and indi-
as Virtual Memoria in Barcelona, or lamps, dynamos, vacuum cleaners, vidual user to enable them to assimilate that system and translate the
and electric streetcars in Berlin, Chicago, London and New York, there benefits gained into business, social or personal value. This is at least as
needs to be compelling content and applications to drive the diffusion important today with digital technologies as it was a century ago.
and the adoption of this form of technological innovation.
Service transformation and Integration: Digital broadband networks
Deployment: A city or individual firm may produce good content and offer provide a means not only of delivering existing services and content,
extensive services and excellent functionality but if the resources are not but enabling service transformation. Corpus Christi, Westminster, and
in place to help new users learn about the services and their value, train Shoreditch are both web-enabling their services with an internet front
them in their use, and support their use, then all investment will be wast- end and transforming their services in terms of scope and end to end
ed. The case studies and secondary research on other cities identifies delivery with the goal of improving their effectiveness and efficiency. The
that some cities have invested heavily in infrastructure and services, but big gains reported are in workforce productivity and greater community
usage rates were low, or services and delivery had not been well thought engagement. The risks involved in making only cosmetic changes are
through and support costs were too high. Where a city works with a third poor take up of services, or uneven take up. If the front end of a serv-
party with previous experience in the deployment of city networks and ice is transformed so it increases community awareness of the service,
their exploitation, success is more likely. However experience needs to ease of use and attractiveness, but if delivery uses existing methods and
be relevant, because cities have different social, cultural and economic resources the service will be overstretched, quality will be poor and re-
contexts that will strongly influence the outcome. South Korea invested sources and spending may rise. All of these scenarios will impact on the
massively in deployment and training potential users of ICT and broad- long-term sustainability of the service.](https://image.slidesharecdn.com/observatori09angls-110110032557-phpapp02/85/The-Barcelona-Observatory-2009-10-Report-71-320.jpg)
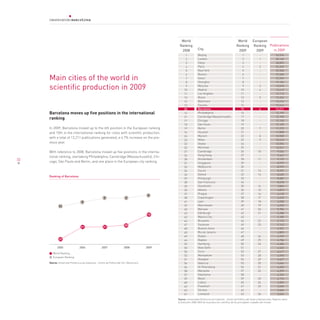
![History gives us many examples of the transforming characteristic of new industries supported. The CCS framework shown in Figure 2 is a refine-
technological systems, enabling transformation of production processes ment of the Well-Connected City planning schematic shown earlier. The
and public services. For instance the Franklin Institute noted that the ad- framework highlights the relationship between each of the components
vantage of electricity: “almost prophetic anticipation of the assembly line, as well as the three networks of actors that commission new technical
lay primarily in freedom to locate machinery, improvements in lighting infrastructure and related services, the consumers of the services offered
and ventilation, cleanliness” and “the 20-30% increases in output that and the firms or organisations that undertake the deployment and provi-
were attributable to all these factors”. [9] sion of the infrastructure and services.
Just over 100 years ago Charles Merz of the engineering consulting firm CCS Framework and Key actors
Merz and McLellan advised potential customers that electrical power and
User Experience and Value For Business and
motors could “replace steam engines, and that the workplace could be Consumers
reorganised because individual electric motor drive permitted more free-
dom of location”, and the deployment and transformations made possi-
Applications and Service
ble by electrification rather than Taylorism enabled American factories to
Industrial and Social Capital including
autoritats municipals i responsables
Delivery
Governance Including Social and
double productivity between 1900 and 1930. [7]
Political context and economic
Skills and Cultural Context
development strategy
de sistemes i serveis
Comunitat i usuaris
The introduction of earlier technological networks, substituting one
dels serveis
component of the system while retaining the configuration of the other Technological Systems
components – whether technological, organisational, process design, or
70 institutional - is not sustainable. If only the technical components of the
system are changed, they are likely to snap back into their earlier shape.
Spatial Organisation
and Urban Planning
Spatial integration: ICT and the extension of its reach through fixed and
wireless broadband networks are enabling new services and applica- Environment - Physical
tions. These in turn are promoting changes in lifestyles, work patterns
and in the case of the public sector, the nature of service delivery. These Systems and related technical and finance service providers
services are bringing new meaning to public spaces, malls, parks, city Figure 2: CCS Framework and Key actors
squares as they are transformed into spaces where people can meet to
work or access community services. We are all experiencing a trend to-
wards greater mobility, distributed work patterns and knowledge inten-
sive work, and the development of open innovation models that involve
These shape the configuration of the technological system, and in turn,
collaboration across an extended enterprise, rather than through verti-
will reshape the city. One of the more striking examples of this is Berlin
cally integrated firms. The types of knowledge and the respective spatial
and described by Thomas Hughes:
conditions required to support the diversity of work patterns in different
industries, vary depending on the industry sector and even the specific
“As in other industrializing cities, electric light and power helped shape
team working practices. Trends emerge as cities take account of these
Berlin’s architecture; deeply influenced the design of its factories, and
factors and plan spatial organisations and infrastructure around the re-
workshops, and chemical plants; stimulated industrial growth; deter-
quirements of industries and firms and institutions involved. An example
mined the location of the city’s transportation systems; provided tel-
of this is the 22@ District of Innovation in Barcelona. Ramon Sagarra, who
ephone and telegraph communication; and when substituted for steam
is responsible for the city’s infrastructure, is planning the transformation
power, lessened noise and dirt. In short electrification affected the way in
of the infrastructure, the networks, and their capacity, and the spatial
which workers labored and management organized, and Berliners lived.
organisation of each urban industry cluster. In Barcelona, the spatial or-
Because of this, the private company that supplied most of the electric
ganisation of the new industrial zones where firms, universities, research
light and power for Berlin until 1915, and the municipal government that
centres and incubators are clustered, takes account of the different work
regulated electrical supply shaped the history of Berlin.” [7]
patterns and interactions in each designated industry cluster – bio-med-
ical, digital media, ICT, and most recently the new energy park, bTEC.
Governance: Governance is a broad topic but the most fundamental area
relates to who owns and shapes the technological system, in the context
The Complex City Systems (CCS) conceptual framework posited by Leon
of this paper, who owns the broadband network and who controls its ev-
[5] indicates that the nature of technological systems, their configuration
olution and sets the future strategy. These issues need to be considered
and style of their deployment are closely related to the spatial and geo-
in terms of the content to be delivered over the network. The governance
graphic characteristics of the region, city or district and the nature of the](https://image.slidesharecdn.com/observatori09angls-110110032557-phpapp02/85/The-Barcelona-Observatory-2009-10-Report-72-320.jpg)
![Report 2009-2010. Monographic
model includes the community and its role in specifying the content and The approach to tackling the issue of economic sustainability is to have a
nature of the services that will be delivered and also the stance of whoever killer application, for instance automated meter reading (AMR) in Corpus
is operating the network – whether their stance will be neutral in relation Christi, parking enforcement in Westminster, or an intelligent transpor-
to content and scope of new services or do they have vested interests. tation system in Stuttgart. In each of these cases there are tangible, di-
rect budgetary savings and in the case of parking enforcement additional
Experience from the City of London and Karlskrona highlights why com- income from these services. These effective applications justify initial
municating agreed aims and objectives to all the stakeholders and agree- network deployment and running costs. The incremental costs of adding
ment about key performance indicators is crucial. Comparison of the applications with softer benefits will be modest in comparison and not
electrification of London and Berlin in the 1880s is an example here. Con- subject to changes in the political priorities of the incumbent administra-
tinuously changing the indicators or vacillating between them can reduce tion.
confidence and the sustainability of an initiative. Objectives are not fixed
by the governance model, but consideration needs to be given to a formal Another solution is to work with a partner, as in the City of London case
change management process to allow adaptations and refinements not study, which can make the investments required to deploy the network,
only to the services but also to their performance measurement. and bring in a range of additional content and service partners to pro-
The challenge of establishing an appropriate governance model that re- vide added value services. Such an approach lowers the costs of systems
flects the capabilities of the public and private sector partners arises in deployment and ensures regular updates. Companies such as Earthlink
the implementation of all the technological systems. A city authority’s re- and Cloud Networks have a series of partnerships in place, and an exist-
sources and its capabilities will shape the form of any public private part- ing business model based on subscriptions. This model enabled them to
nership. Hughes describes the relationship between the partners in Berlin take over the existing network assets and operations already deployed by
as follows: cities or to install new networks and make services available to the city
71
as the anchor tenant, with shared revenues in exchange for rights of way
“The Municipal Government was not overawed by the technical, mana- to city assets such as lamp posts and other street furniture.
gerial, scientific and financial power of its private utility. Berlin officials
drew upon the proud tradition of the Prussian civil service, demanding The case study research found evidence of the challenges facing cities
and receiving the same respect and authority that public officials of the such as Norwich, and inner city districts in London such as Shoreditch
state and national governments received”. [7] and Newham, which are finding it difficult to sustain ongoing operations,
move from pilot to full roll out of services, and refresh the technology
And with reference to London, which contrasts poorly with Berlin, he to meet evolving community needs. In the case of Shoreditch, once ini-
adds that a similarly progressive combination of coordinated forces was tial funding from the local authority, UK government programmes such
needed to overcome the vested and historical interests in London, how- as the New Deal for Communities, or EU funding under Objective 2 was
ever such a combination did not exist. exhausted, without a sustainable economic model, the municipality or
district was faced with having to find another partner or closing down
Good governance accompanies a city or its agencies capabilities and the the initiative. What often starts as a programme addressing social cohe-
above lessons are pertinent to the deployment of all types of technologi- sion and community engagement, or delivering new and more efficient
cal systems. community services on the back of a technological model, can quickly
become a failed project.
Sustainability: Some of the initiatives studied have run out of funding or
lost momentum in terms of organisational support, usage or exploitation. We can consider these issues as being ‘econo-technical’ in nature and
The research found that almost all of the initiatives had received seed we see that one of the more important aspects of Edison’s activities was
funding but without the development of a sustainable business model in his concern for economic factors, at every stage of the technology devel-
place from the start, exhibit a tendency to expire within 3 years. The ini- opment. Since technological change involves economic, legal, legislative
tial funding might launch them with some acclaim, but after a year, even and scientific aspects, Edison needed a highly supportive financier net-
if the results were good, the next budget cycle is underway or budgets work, from the very outset. This network was developed with the help of
already set, and it is too late for funding to be reallocated from depart- Grosvenor Lowrey, Edison’s Chief Counsel, and his close association with
ments who are benefitting from the new services. Typically, a third year Drexel Morgan and Company. Without this, Edison’s inventions could not
of funding might be secured during the second year, but it is often inad- have been commercialised successfully and transferred to other world
equate and even more new investment is required by now to refresh the cities. Successful deployment of new technological systems involves a
technology. The result is that the project is choked of new investment, synthesis of social and market needs, financial trends, economic prin-
service quality falls without a technology refresh, deployment resources ciples, technological innovations, engineering design, and managerial
are insufficient and usage falls – a vicious cycle ensues that is likely to techniques. Over a century ago we see evidence of this synthesis, yet the
spell the demise of the project. case studies show that the planning and deployment of digital technolo-](https://image.slidesharecdn.com/observatori09angls-110110032557-phpapp02/85/The-Barcelona-Observatory-2009-10-Report-73-320.jpg)
![Report 2009-2010. Monographic
plinary innovation system, and an integrated infrastructure programme Bibliography
linked to strategic urban design.
[1] US Council on Competitiveness (2004). Innovation: The New Reality for National
Prosperity”, 21st Century Innovation Working Group Final Report
In the case studies we identified only a handful of global cities who can
demonstrate such an integrated approach. The price of failure is high. [2] Hall, P. (1998). Cities in Civilisation. New York: Pantheon Books.
When London failed to exploit such an integrated approach 120 years ago
with the introduction of electrical networks it ceded its position as a lead- [3] Hall, P. & Pain, K. (2006). The polycentric metropolis: learning from mega-city
ing industrial city to other global cities and took 40 years to recover. Cities regions in Europe. London: Earthscan Publications
that fail to innovate risk a steep decline. The deployment of digital tech- [4] Glaeser, E.L. (1998). Information Technology and the Future of Cities. Journal of
nologies is a crucial ingredient in creating an environment for innovation. Urban Economic 43, 136 – 156.
However, unless the planning and deployment of these technologies are
integrated with the social, cultural and economic programmes of the city, [5] Glaeser, E.L. (2004). The Rise of the Skilled City. Wharton Papers on Urban Affairs.
the transformation of its services and the overall spatial planning, these 5, 47-105.
technologies will not contribute fully to the innovative capacity of the city,
[6] Leon, N (2010). Complex City Systems: PhD Thesis, University of London
public service transformation or social cohesion.
[7] Hughes, T.P. (1983). Networks of Power: Electrification in Western Society, 1880-
1930, Baltimore, Mr: John Hopkins University Press
[8] Bijker, W.E., Hughes, T. P. & Pinch, T.P. (Eds). The Social Construction of Tech-
nological Systems: New Directions in the Sociology and History of Technology.
Cambridge, Ma: MIT Press. 73
[9] Nye, D. (1999). Consuming Power: A Social History of American Energies. Cam-
bridge, Ma: MIT Press. (Page 141)](https://image.slidesharecdn.com/observatori09angls-110110032557-phpapp02/85/The-Barcelona-Observatory-2009-10-Report-75-320.jpg)


Barcelona has maintained a solid competitive position among top European cities despite the global economic recession. In 2009, Barcelona recovered its position as the fourth best city for businesses in Europe. It also remained the top city for quality of life for workers and made the most progress. The city is dealing with the recession through high investment, support for companies and job creation, and maintaining its long-term strategy for a new economic growth model based on knowledge, creativity, innovation and sustainability. Proactive measures by the city have helped it weather the difficult economic circumstances.


