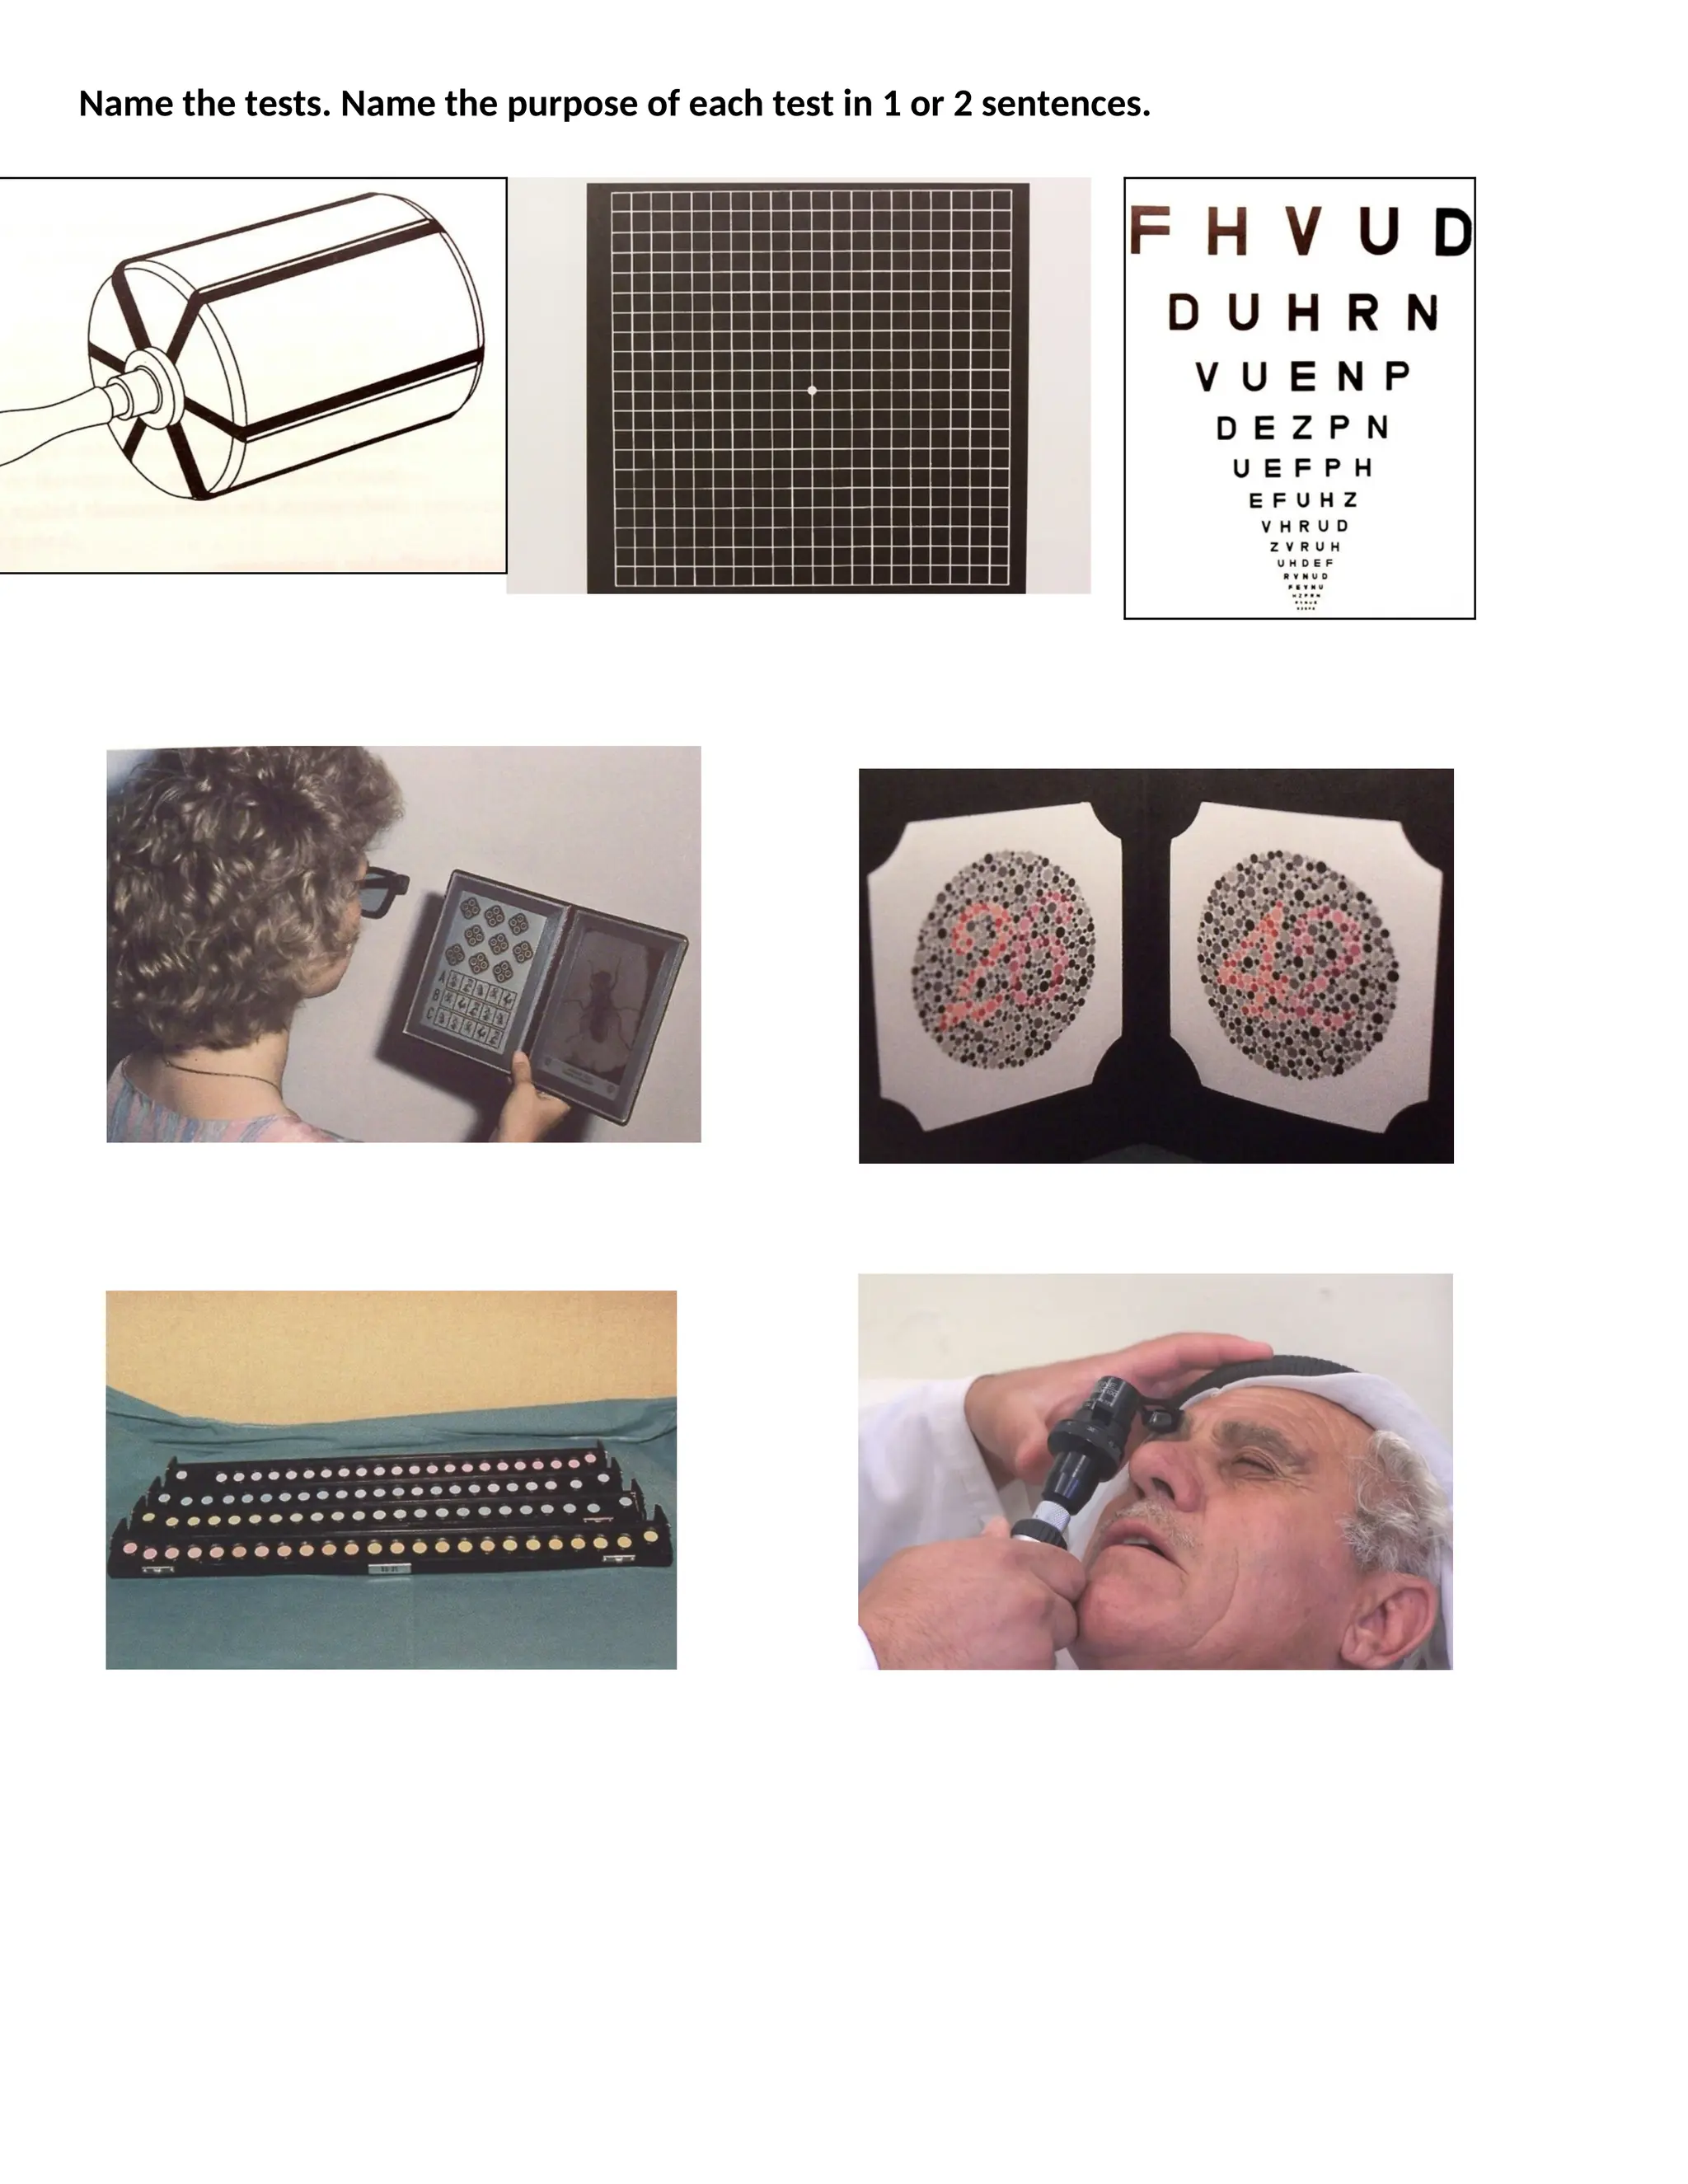
Name the tests.Name the purpose of each test in 1 or 2 sentences.
2.
ANSWERS
1- Maddox Rod:(cylindrical lens drawing) Used to measure ocular muscle balance and detect
strabismus. It converts a point of light into a line to assess phoria and tropia.
2- Amsler Grid: (grid pattern) Tests central visual field to detect scotomas and
metamorphopsia. Particularly useful for monitoring macular degeneration.
3- Snellen Chart: (letter chart) Measures visual acuity at distance. Standard test for
determining refractive errors and vision correction needs.
4- Stereo Butterfly Depth Perception Stereopsis Test: Tests stereopsis/depth perception.
Helps assess binocular vision by requiring both eyes to work together to see hidden 3D
images.
5- Ishihara Color Test: (circles with colored number patterns) Tests for color vision deficiency.
Identifies red-green color blindness through camouflaged numbers in colored dot patterns.
6- Farnsworth–Munsell 100-hue test: is a sensitive test for both congenital and acquired color
defects
7- Retinometer: (doctor examining patient's eye) determining a patient’s potential visual
acuity after cataract surgery.
3.
Name the orthoptictests and instruments. Name the purpose of each test in 1 or 2
sentences
4.
ANSWERS
1. Stereo FlyTest: Tests stereopsis/depth perception using random dot patterns. Used to
assess binocular vision and detect strabismus.
2. Prism Bar Test/Cover Test: Measures the angle of strabismus and assesses ocular
alignment. Helps quantify the degree of eye deviation.
3. Synoptophore/Major Amblyoscope: Tests binocular vision, fusion, and measures angle of
squint. Used for diagnosis and treatment of strabismus.
4. Cover-Uncover Test: Detects the presence and type of strabismus (phoria or tropia). Basic
screening test for ocular alignment.
5. Tangent Screen/Bjerrum Screen: Maps the visual field to detect scotomas and field defects.
Used to assess peripheral vision and monitor conditions like glaucoma.
6. Letter Chart/Near Visual Acuity Test: Tests near vision acuity. Used to assess reading vision
and need for reading glasses.
7. Kay Pictures Test: Visual acuity test for young children using simple picture optotypes.
Particularly useful for pre-literate children.
8. Cardiff Cards/Picture Cards: Another visual acuity test for infants and young children using
preferential looking technique. Uses simple outline drawings to assess vision in very young
patients.
5.
Match the Hesscharts (1-6) with the appropriate clinical conditions (A-F).
Describe each chart and the main clinical features of the matching condition
ANSWERS
6.
1. Hess Chart1 matches with Image 9 (Superior Rectus Palsy)
Chart shows under-action of the superior rectus in the affected eye
Clinical image shows hypotropia (downward deviation) of the affected eye
Characteristic limitation of elevation
2. Hess Chart 2 matches with Image 10 (Inferior Rectus Palsy)
Chart demonstrates under-action of the inferior rectus muscle
Clinical image shows hypertropia (upward deviation)
Difficulty in downward gaze
3. Hess Chart 3 matches with Image 11 (Superior Oblique Palsy)
Chart shows characteristic pattern of superior oblique under-action
Clinical image shows upward deviation of affected eye
Often presents with compensatory head tilt
4. Hess Chart 4 matches with Image 12 (Inferior Oblique Palsy)
Chart demonstrates under-action of inferior oblique muscle
Clinical image shows limitation of elevation in adduction
Typically presents with hypotropia in contralateral gaze
5. Hess Chart 5 matches with Image 7 (Lateral Rectus Palsy)
Chart shows significant limitation of abduction
Clinical image shows esotropia (inward deviation)
Clear limitation of outward movement
6. Hess Chart 6 matches with Image 8 (Medial Rectus Palsy)
Chart shows limitation of adduction
Clinical image shows exotropia (outward deviation)
Characteristic impairment of inward movement
Match the visual field charts (1-5) with the appropriate clinical conditions (A-E). Give a likely
diagnosis for each match
8.
ANSWERS
1. Visual filed1 matches with Image 1 (Bitemporal hemianopia). MRI showing
hemorrhage within pituitary adenoma compressing the chiasm
2. Visual filed 2 matches with Image 2 (Glaucoma optic neuropathy). Visual field
showing severe constriction in the left eye from advanced glaucoma.
3. Visual filed 3 matches with Image 5 (Left homonymous hemianopia). MRI showing
infarction in the right optic radiations
4. Visual filed 4 matches with Image 3 (non-arteritic ischemic optic neuropathy). Visual
field showing lower altitudinal hemianopia
5. Visual filed 5 matches with Image 4 (Papilledema). Visual field showing enlarged
blind spots in both eye
Name the investigations and printouts
9.
ANSWERS
1. A manuallensometer, is used measure the precise powers of the sphere, cylinder, axis, add,
and prism of a lens
2. An auto-refractor, used to measure refractive errors objectively
3. Humphrey field analyzer (HFA) is used to measure visual field
4. A color-coded corneal map showing anterior curvature details of the right (OD) and left (OS)
eyes.
5. B-scan of Vitreous Hemorrhage
Match the clinical conditions with appropriate CT-Scan
11.
ANSWERS
1. Clinical condition1 matches CT scan 1. Thyroid eye disease with asymmetric
proptosis on left. CT of orbits with thickening of recti muscles on left.
2. Clinical condition 2 matches CT scan 2. Right orbital cellulitis with ophthalmoplegia.
CT showing both pre-septal and orbital opacification.
3. Clinical condition 3 matches CT scan 3. Orbital floor blow-out fracture. CT showing
herniation of orbital fat in the maxillary sinus.
4. Clinical condition 4 matches CT scan 4. Orbital superficial cyst right eye. CT image
showing a well-circumscribed heterogeneous superficial syst.