Download as PDF, PPTX


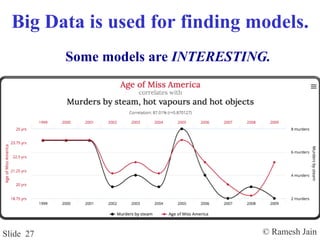
![© Ramesh JainSlide 25
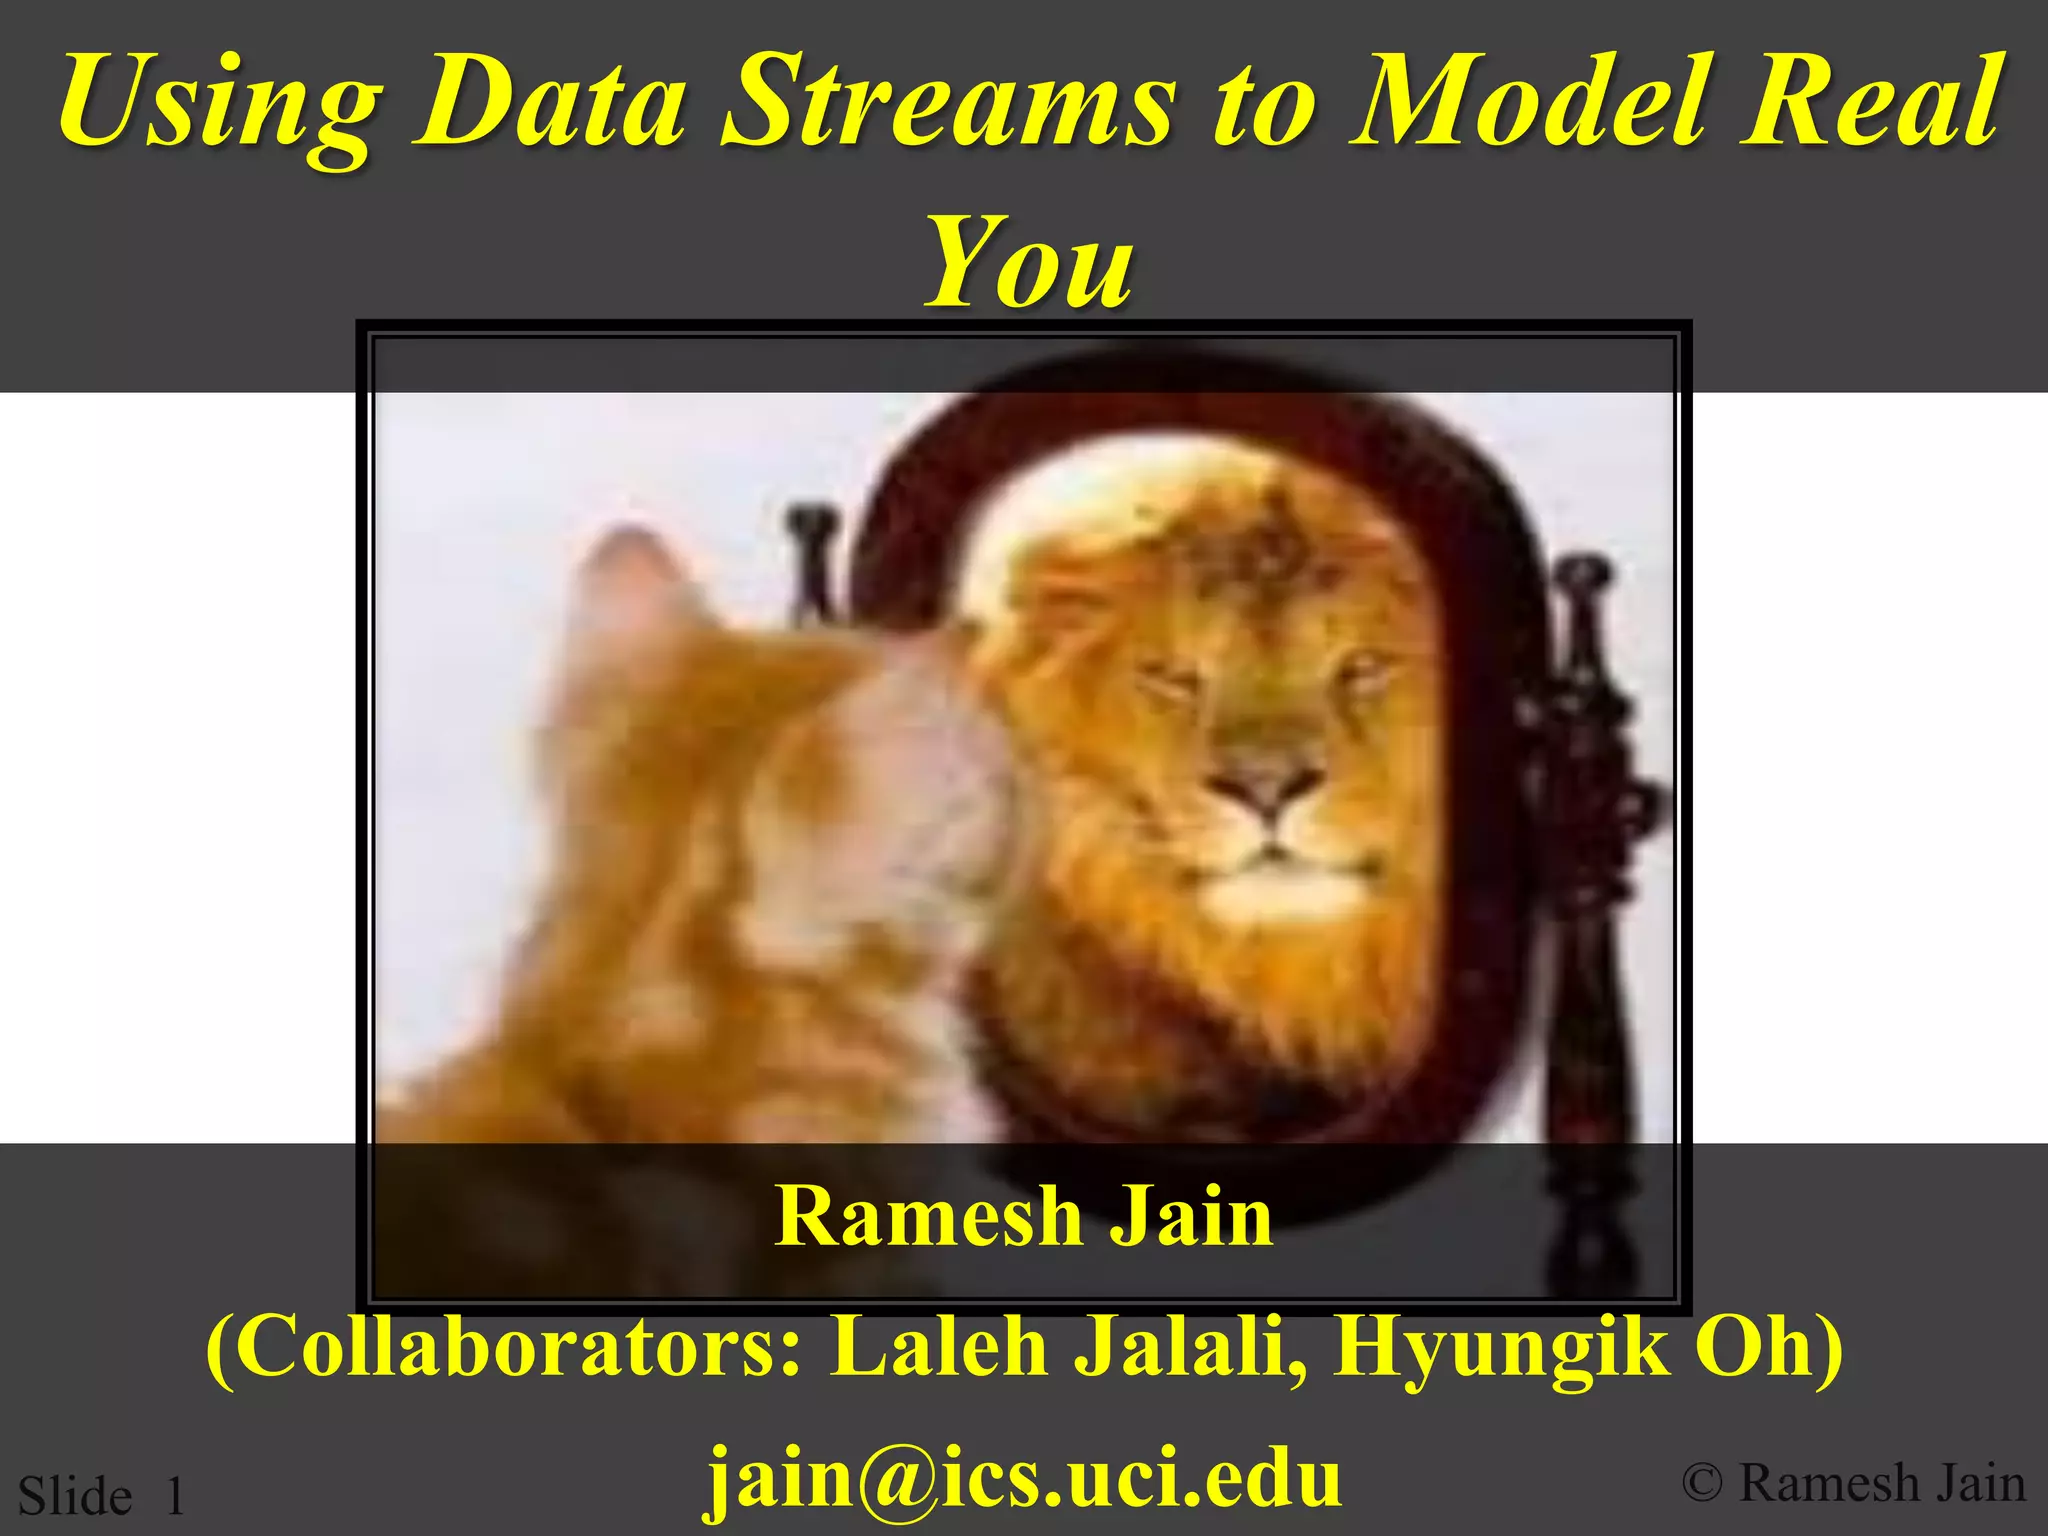
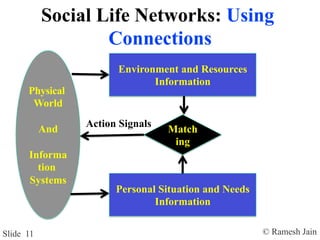
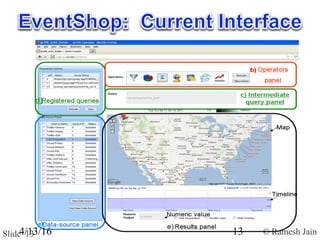
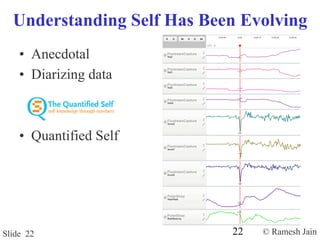
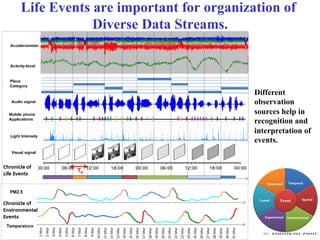
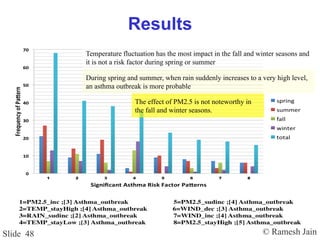
REALITY
DATA
MODEL
Modeling
Explain , Prevent , Understand
Predict
ABSTRACTION
[Sensors, Web2.0,
Infrastructures, etc.]
[Conceptual,
Mathematical,
Graphical, Statistical,
etc.]](https://image.slidesharecdn.com/objectiveself-modelingrealyou-160415114359/85/Objective-self-modeling-real-you-25-320.jpg)
![© Ramesh JainSlide 38
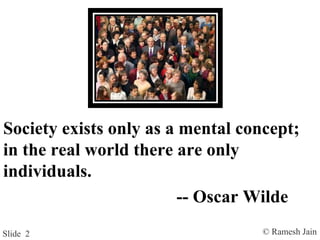
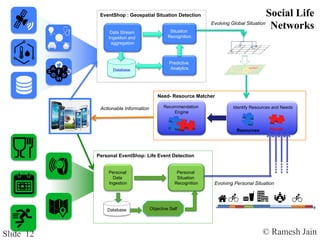
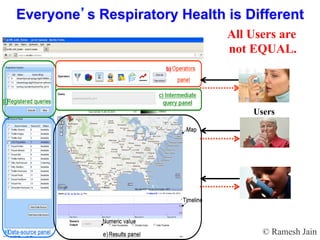
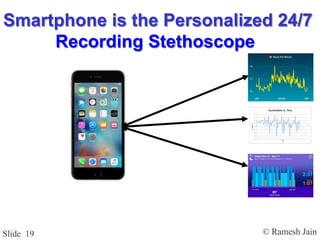
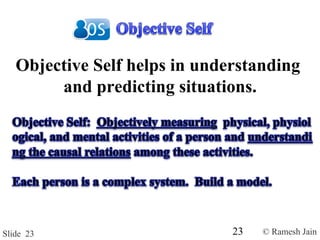
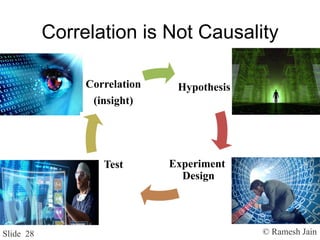
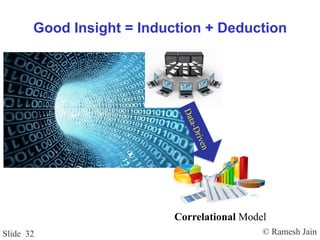
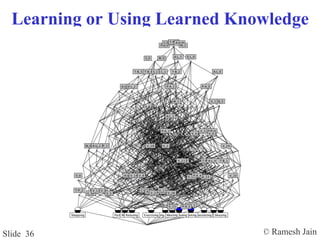
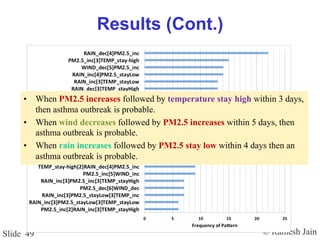
Pattern Formulation Operators
Selection Operation σP
Sequence Operation ( ρ1 ; ρ2 ; … ; ρk )
Conditional Sequence Operation ( ρ1 ;ωΔt1 ρ2 ;ωΔt2 … ; ωΔtk-1 ρk )
Concurrency Operation ( ρ1 ρ2 … ρk )
Alternation Operation ( ρ1 | ρ2 | … | ρk )
Time ( ωΔt ρ )
Co-occurrence ( COρ1 , ρ2 [Δt ] )](https://image.slidesharecdn.com/objectiveself-modelingrealyou-160415114359/85/Objective-self-modeling-real-you-38-320.jpg)
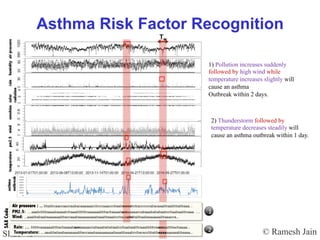

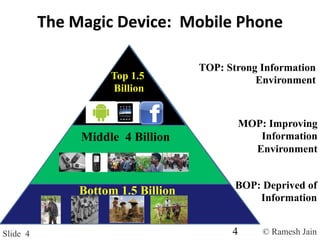
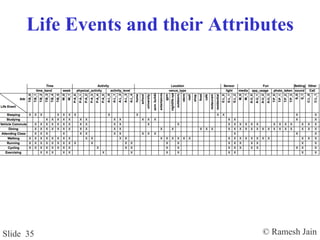
The document discusses utilizing data streams to better connect individual needs with resources, emphasizing the evolving roles of technology, particularly smartphones, in personal health monitoring and data collection. It highlights significant transformations in how personal and societal health data can improve disease models and quality of life, utilizing insights from event stream modeling and co-occurrence detection of health-related factors. The speaker advocates for a more proactive approach in healthcare, leveraging personal data to anticipate and address health issues.


![[DISC2013] Mood and Weather: Feeling the Heat?](https://cdn.slidesharecdn.com/ss_thumbnails/20131212-disc2013moodandweatherfeelingtheheatverpublish-141125181301-conversion-gate01-thumbnail.jpg?width=640&height=640&fit=bounds)


![CTEV [ clubfoot] DR ARUN LAL ,DR MOHAMED ASHRAF travancore medical college k...](https://cdn.slidesharecdn.com/ss_thumbnails/ctevclubfootdrarunlaldrmohamedashraftravancoremedicalcollegekollamkeralaindia-260208063247-18fc466c-thumbnail.jpg?width=640&height=640&fit=bounds)
