This document provides data on credit unions in New York with assets between $20 million and $50 million from 2015. It lists the credit unions that led in areas such as share capital growth, asset growth, loan growth, return on assets, member growth, loan to share ratio, and shares to assets ratio. For example, St. Josephs Parish FCU had the highest share capital growth at 23.89% and assets of $45,077,551. Great Meadow FCU led in loan growth at 29.57% with loans of $17,160,679. Brooklyn Cooperative FCU performed well with the highest return on assets at 3.26% and assets of $20,438,421.
A list of contracts issued by the Pennsylvania Dept. of Conservation and Natural Resources (DCNR) issued, as of February 2015, to allow Marcellus and Utica Shale drilling under what PA calls publicly-owned waterways--everything from large rivers to small/nameless creeks. The state receives $4,000 per acre as a signing bonus and a 20% royalty.
These life expectancy maps, created by Virginia Commmonwealth University with funding from Robert Wood Johnson Foundation, illustrate that opportunities to lead a long and healthy life can vary dramatically by neighborhood. In some cases, life expectancy can differ by as much as 20 years in neighborhoods only about five miles apart from one another.
Nate Edwards, Senior Director of Research at Cushman and Wakefield, presented a study on the DC Office Market at our September 14th, 2021 Board of Directors Meeting. This in-depth market analysis looks both at historic trends and predicts the future evolution of DC office space
See current (Q2 2016) Chicago office market statistics, including inventory, absorption, vacancy, average asking rents and construction. We analyze Class A and B space, as well as averages, across all of Chicago and in submarkets including the CBD, River North, West Loop, O'Hare, North Lake County and more.
The 77 acre site located within the Dan Evans Industrial Park of Ohio, is just one mile North of US 35 along SR 850. All utilities are available to site with excess capacities. Due diligence studies completed. Site is currently being evaluated for JobsOhio Site Authentication Program. Learn more about the Gallia County, OH and Dan Evans Industrial Park of Ohio - Phase II Site.
Cushman & Wakefield Q12018 Canadian Office Statistical SummaryGuy Masse
Q1 2018 Canadian Office Statistical Summary
Turning Up the Heat
The summer arrived about nine years ago for many Canadian office markets, marking one of the longest growth cycles on record. With CBD availability rates plunging as low as 2.5% in Toronto and 4.3% in Vancouver, the heat has intensified. Meanwhile, oil-producing markets are seeing the first signs of recovery.
KEY HIGHLIGHTS:
• After enduring a grinding bust cycle, top oil-producing markets -- Calgary, Edmonton, and St. John’s -- reached high-water CBD availability marks of 23.7%, 14.1%, and 26.7%, respectively. CBD Edmonton will see the Stantec Tower arrive in Q3 2018, pushing availability towards 20%.
• With oil prices gaining some buoyancy in recent months and CBD Calgary expected to hit peak availability by early 2019, expectations are growing that absorption will begin shifting to the positive side over the next few quarters.
• Remarkably, CBD Toronto saw the strongest absorption of the quarter, reaching close to 300,000 square feet (sf). Both Toronto and Vancouver downtown markets will remain notoriously tight until at least 2021.
• Of the major markets, Vancouver did it again, posting the strongest suburban expansionary momentum in the country, totaling about 300,000 sf. The runner up, surprisingly, was Calgary, where suburban absorption hit 115,000 sf over the quarter. Green shoots!
JLL just released the Q1 Chicago Suburbs Office Outlook. The report has some great insight into recent market activity and provides a forecast for the year ahead.
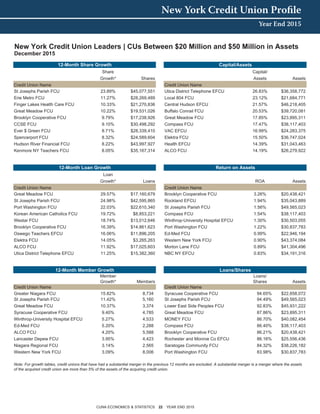
1. New York Credit Union Profile
Year End 2015
CUNA ECONOMICS & STATISTICS 22 YEAR END 2015
New York Credit Union Leaders | CUs Between $20 Million and $50 Million in Assets
December 2015
Share Capital/
Growth* Shares Assets Assets
Credit Union Name Credit Union Name
St Josephs Parish FCU 23.89% $45,077,551 Utica District Telephone EFCU 26.83% $36,358,772
Erie Metro FCU 11.27% $28,269,489 Local 804 FCU 23.12% $21,684,771
Finger Lakes Health Care FCU 10.33% $21,270,836 Central Hudson EFCU 21.57% $46,218,405
Great Meadow FCU 10.22% $19,531,026 Buffalo Conrail FCU 20.53% $39,720,081
Brooklyn Cooperative FCU 9.79% $17,238,926 Great Meadow FCU 17.85% $23,895,311
CCSE FCU 9.10% $30,498,292 Compass FCU 17.47% $38,117,403
Ever $ Green FCU 8.71% $28,339,410 VAC EFCU 16.99% $24,283,375
Spencerport FCU 8.32% $24,589,604 Elektra FCU 15.50% $36,747,024
Hudson River Financial FCU 8.22% $43,997,927 Health EFCU 14.39% $31,043,463
Kenmore NY Teachers FCU 8.05% $35,167,314 ALCO FCU 14.19% $26,279,922
Loan
Growth* Loans ROA Assets
Credit Union Name Credit Union Name
Great Meadow FCU 29.57% $17,160,679 Brooklyn Cooperative FCU 3.26% $20,438,421
St Josephs Parish FCU 24.98% $42,595,865 Rockland EFCU 1.94% $35,043,889
Port Washington FCU 22.03% $22,610,340 St Josephs Parish FCU 1.56% $49,565,023
Korean American Catholics FCU 19.72% $8,853,221 Compass FCU 1.54% $38,117,403
Westar FCU 18.74% $13,012,646 Winthrop-University Hospital EFCU 1.30% $30,503,055
Brooklyn Cooperative FCU 16.39% $14,861,623 Port Washington FCU 1.22% $30,837,783
Oswego Teachers EFCU 16.06% $11,896,205 Ed-Med FCU 0.99% $22,946,194
Elektra FCU 14.05% $3,265,263 Western New York FCU 0.90% $43,374,084
ALCO FCU 11.92% $17,025,603 Morton Lane FCU 0.89% $41,304,496
Utica District Telephone EFCU 11.25% $15,382,360 NBC NY EFCU 0.83% $34,191,316
Member Loans/
Growth* Members Shares Assets
Credit Union Name Credit Union Name
Greater Niagara FCU 15.82% 8,734 Syracuse Cooperative FCU 94.65% $22,658,072
St Josephs Parish FCU 11.42% 5,160 St Josephs Parish FCU 94.49% $49,565,023
Great Meadow FCU 10.37% 3,374 Lower East Side Peoples FCU 92.83% $45,931,222
Syracuse Cooperative FCU 9.40% 4,785 Great Meadow FCU 87.86% $23,895,311
Winthrop-University Hospital EFCU 5.27% 4,533 MONEY FCU 86.70% $40,082,454
Ed-Med FCU 5.20% 2,288 Compass FCU 86.40% $38,117,403
ALCO FCU 4.20% 5,588 Brooklyn Cooperative FCU 86.21% $20,438,421
Lancaster Depew FCU 3.95% 4,423 Rochester and Monroe Co EFCU 86.16% $25,556,436
Niagara Regional FCU 3.14% 2,565 Saratogas Community FCU 84.32% $38,226,182
Western New York FCU 3.09% 8,006 Port Washington FCU 83.98% $30,837,783
Note: For growth tables, credit unions that have had a substantial merger in the previous 12 months are excluded. A substantial merger is a merger where the assets
of the acquired credit union are more than 5% of the assets of the acquiring credit union.
12-Month Member Growth Loans/Shares
12-Month Share Growth Capital/Assets
12-Month Loan Growth Return on Assets