This article focuses on the numerical simulation of combustion behavior in direct injection diesel engines using computational fluid dynamics (CFD) techniques, emphasizing the importance of adaptive mesh refinement (AMR) and embedding strategies. The study finds that utilizing AMR in conjunction with embedding can significantly improve the accuracy of simulation results while reducing computational time. Results demonstrate a good agreement between numerical simulations and experimental data, highlighting the potential to enhance diesel engine efficiency and minimize emissions through improved modeling techniques.
![© Journal of the Society of Automotive Engineers Malaysia
www.journal.saemalaysia.org.my
116
Counter) model is used. The NTC method is based on techniques used in the gas dynamics for
DSMC (Direct Simulation Monte-Carlo). This model has been shown to be faster and more
reliable (Richards et al., 2008).
3.3 Combustion an Emissions Models
The experiment fuel is a diesel fuel; however, a surrogate fuel (C14H30) is used in this study.
A surrogate fuel is used because Diesel fuel contains many different chemical compounds and
thus to simplify the calculation a single compound is chosen.
The shell/CTC is a widespread model for diesel combustion modelling due to its
clearness, understandability and sufficient accuracy (Lakshminarayanan & Aghav, 2010; Shi
et al., 2011). The model involves two sub-models: CTC and shell. The CTC model handles the
conversion rate of the density of species at high temperature reactions while Shell models the
auto ignition process of diesel fuel (Halstead et al., 1977). Shell was primarily elaborated to
predict knock in spark ignition engines. This model uses a simplified reaction mechanism to
simulate Auto ignition in diesel engines. This model contains eight reactions given by:
𝐶 𝑛 𝐻2𝑚 + 𝑂2 → 2𝑅∗
𝑅∗
→ 𝑅∗
+ 𝑃 + 𝐻𝑒𝑎𝑡
𝑅∗
→ 𝑅∗
+ 𝐵
𝑅∗
→ 𝑅∗
+ 𝑄 (1)
𝑅∗
+ 𝑄 → 𝑅∗
+ 𝐵
𝐵 → 2𝑅∗
𝑅∗
→ 𝑇𝑒𝑟𝑚𝑖𝑛𝑎𝑡𝑖𝑜𝑛
2𝑅∗
→ 𝑇𝑒𝑟𝑚𝑖𝑛𝑎𝑡𝑖𝑜𝑛
The characteristic time-scale combustion model (CTC) model is used for high
temperature combustion (Abraham et al., 1985; Xin et al., 1997). CTC models the rate of
change of the density of species m, ρ, as:
𝜕𝜌 𝑚
𝜕𝑡
= −
𝜌 𝑚−𝜌 𝑚
∗
𝜏 𝑐
(2)
Where ρ*
is the local and instantaneous thermodynamic equilibrium value of the species
density and τc is the characteristic time to achieve equilibrium. The characteristic time is
calculated via:
𝜏 𝑐 = 𝜏 𝑐ℎ𝑒𝑚 + 𝑓𝜏 𝑡𝑢𝑟𝑏 (3)
Where τchem is the chemical-kinetics time, τturb is the turbulent mixing time and f is a delay
coefficient which simulates the increasing influence of turbulence on combustion. The
chemical timescale is modelled as follow (Kong et al., 1995):
𝜏 𝑐ℎ𝑒𝑚 =
[𝐶 𝑛 𝐻2𝑚]0.75
𝑒
𝐸 𝑐ℎ𝑒𝑚
𝑅 𝑢 𝑇 𝑔
2𝐴 𝑐ℎ𝑒𝑚[𝑂2]1.5
(4)
Where Achem is a constant. Echem is the activation energy given by 18475 cal/mol. Ru is the
universal gas constant and Tg is the gas temperature. In addition, the turbulent timescale is
given as:](https://image.slidesharecdn.com/jsaem-2-2-naima-181115204735/75/Numerical-Simulation-of-Combustion-Behavior-of-DI-Diesel-Engine-with-Conjunction-of-AMR-and-Embedding-Refinement-Strategies-5-2048.jpg)
![© Journal of the Society of Automotive Engineers Malaysia
www.journal.saemalaysia.org.my
117
𝜏 𝑡𝑢𝑟𝑏 = 𝐶2
𝑘
𝜀
(5)
Where C2 is a constant. For soot and NOx production Hiroyasu soot model and Zeldovich
NOx model were respectively used.
3.4 Turbulence Model
The rapid distortion RNG k-ε model is used. This model is designed for rapid compression or
rapid expansion; therefore, it is commonly used for ICE simulation. Han and Reitz (1995)
Demonstrated the efficiency of this model for spray injection modelling. In fact, the spray
generates a mean flow gradient which is responsible for the enhancement of turbulent to mean-
strain time scale ratio. In addition, Han and Reitz heat transfer wall model is used.
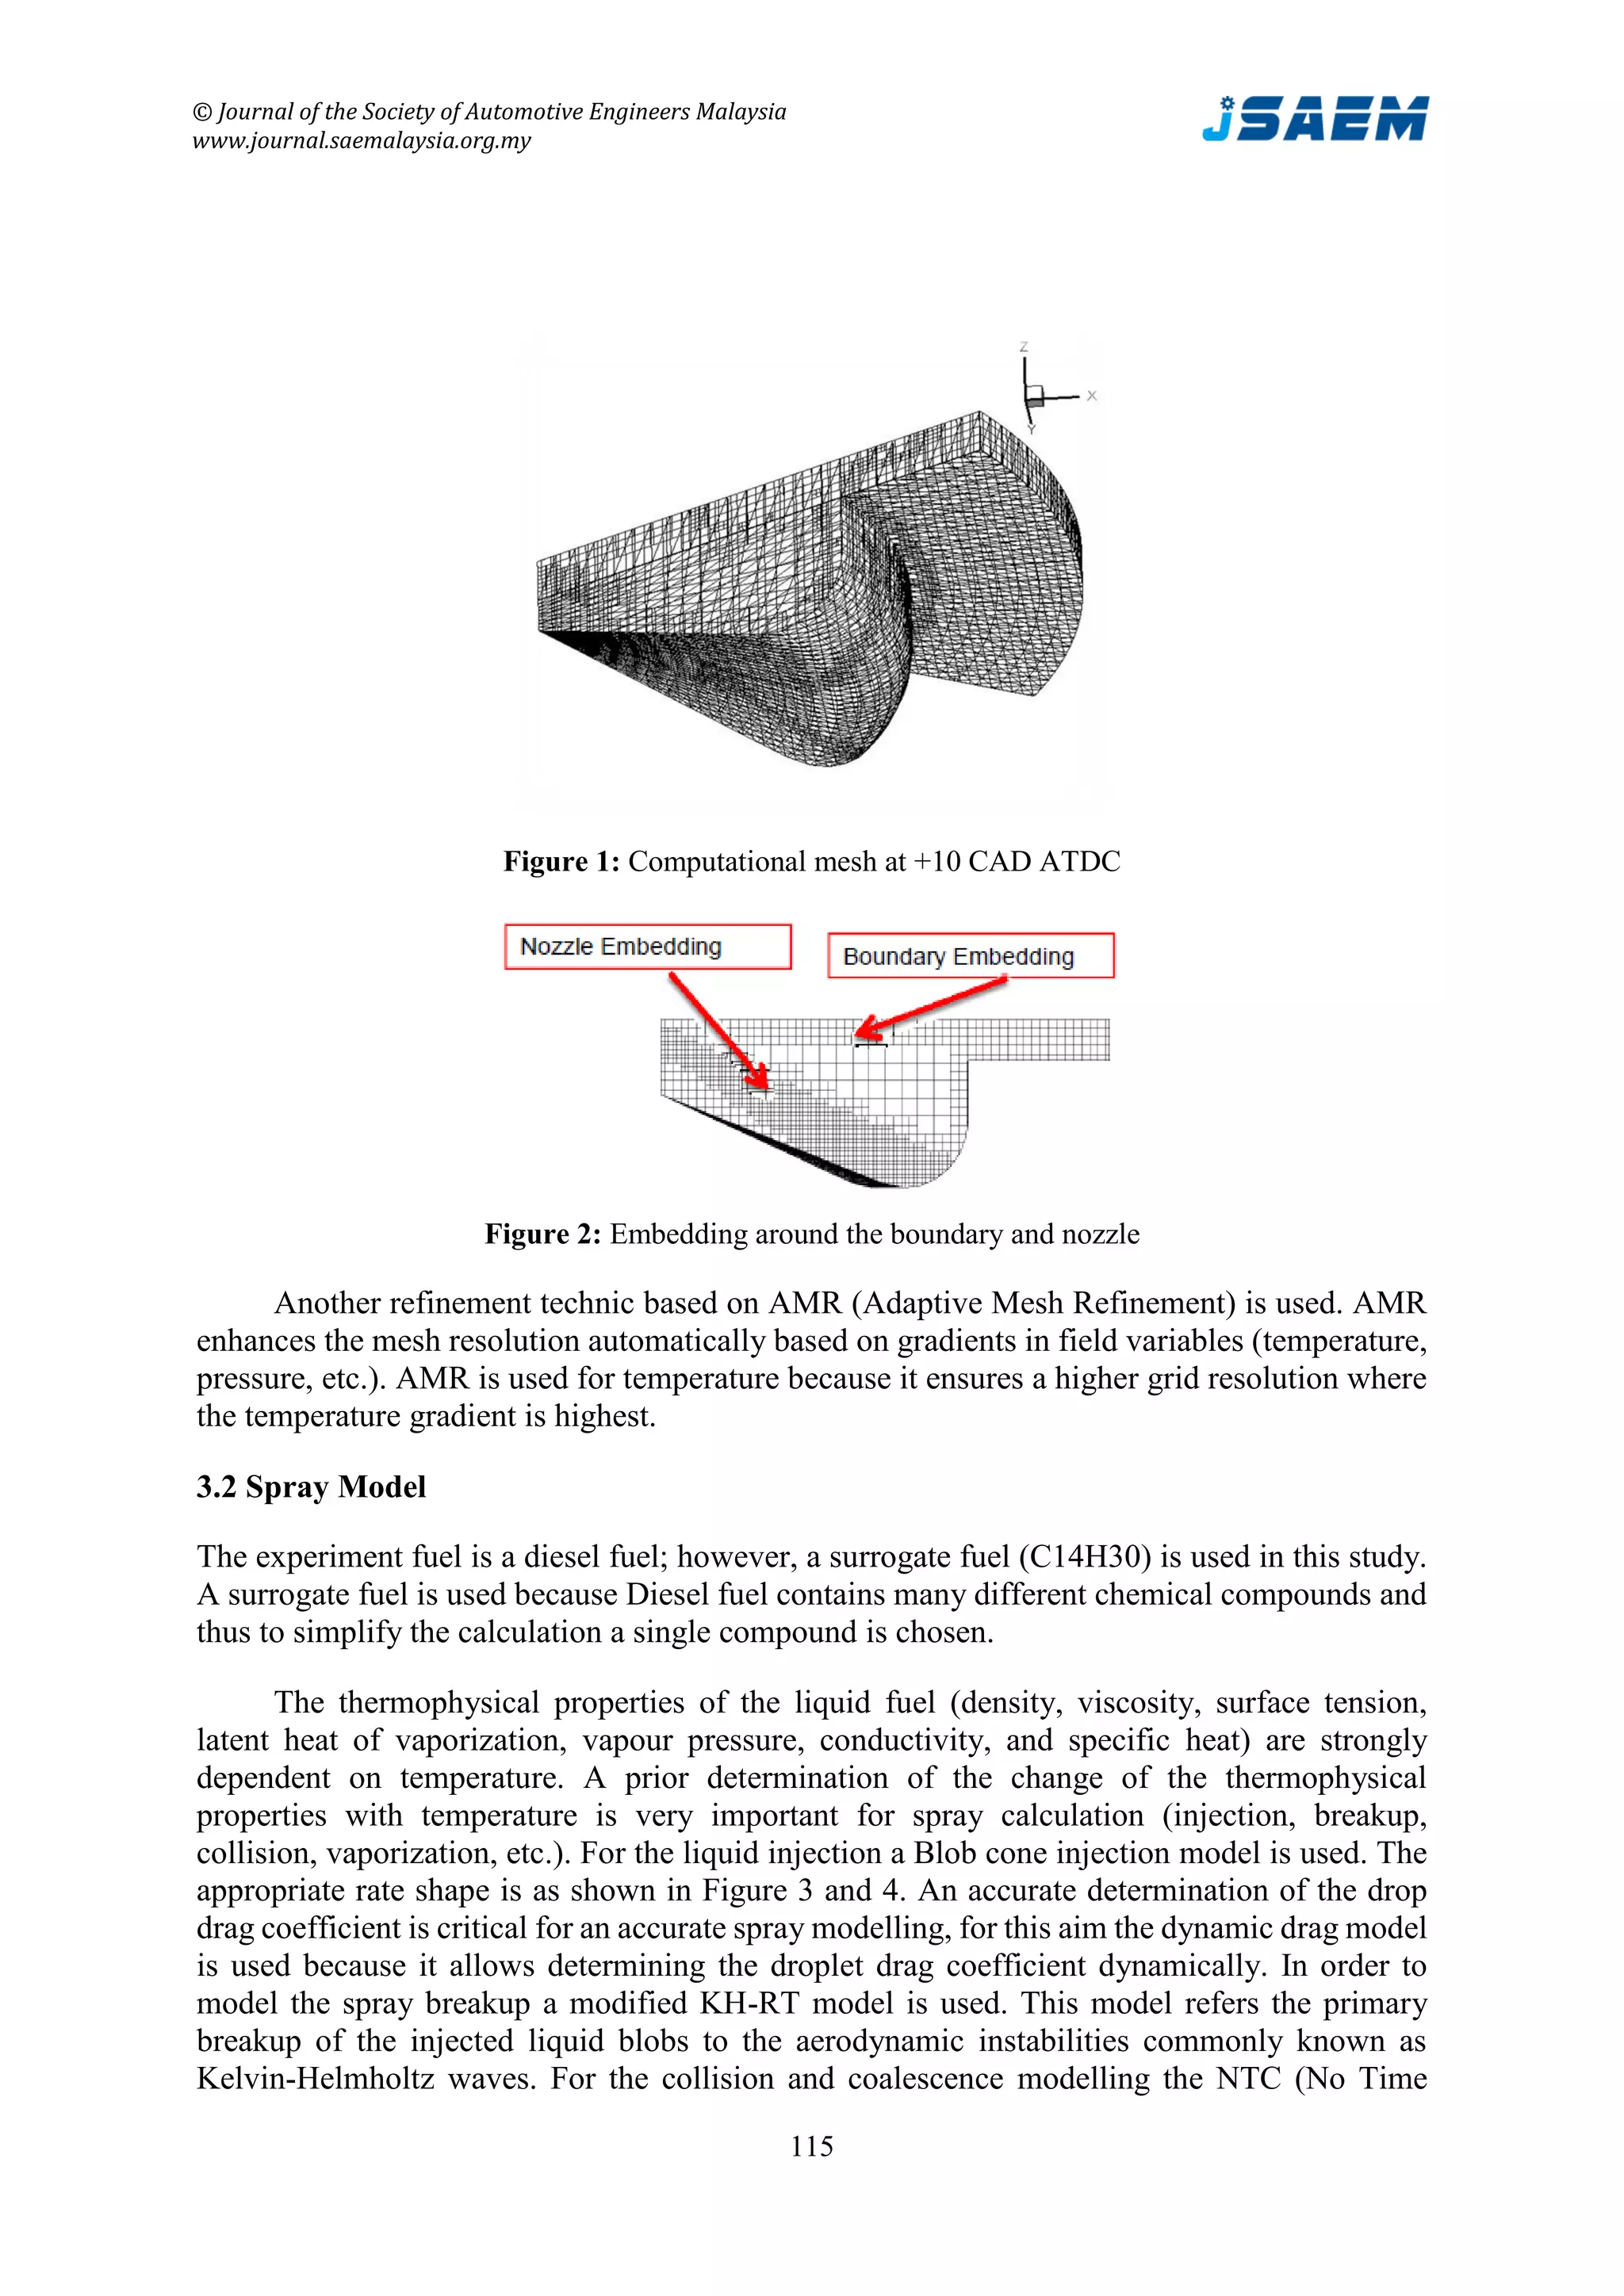
4.0 RESULTS AND DISCUSSION
The simulation was achieved in a three dimensional in-cylinder computational mesh. This mesh
represents one-sixth of the engine combustion chamber for a base cell size of 2 mm. In this
simulation AMR embedding scale of 2 is set for the spatial gradient in the temperature which
gives a minimum cell size of 0.5mm. The total cells at the start of the simulation is 58096.
Figure 5 gives the evolution of the number of cells in the computational domain with CAD. An
example of 2 mm base mesh with refinement at +37 CAD ATDC is illustrated in Figure 6. The
maximum cells provided with AMR is around 370000 cells at +37 CAD ATDC (Figure 6-a).
At this time (+37CA ATDC) the flame takes the largest volume on the computational domain
(Figure 6-b).
The simulation was performed on 5 cores and took approximately 18.83 hours. 77.73%
of this time is used for solving the transport equations, while 16.29% is used to move surface
and update grid.
-10 -5 0 5 10 15
0
20
40
60
80
100
120
140
Injectionpressure[MPa]
Crank angle [Deg]
-10 -5 0 5 10 15
0
100
200
300
400
500
600
InjectionVelocity[m/s]
Crank angle [Deg]
Figure 3: Injection profile Figure 4: Injection velocity](https://image.slidesharecdn.com/jsaem-2-2-naima-181115204735/75/Numerical-Simulation-of-Combustion-Behavior-of-DI-Diesel-Engine-with-Conjunction-of-AMR-and-Embedding-Refinement-Strategies-6-2048.jpg)
![© Journal of the Society of Automotive Engineers Malaysia
www.journal.saemalaysia.org.my
118
0 50 100 150
0
1E5
2E5
3E5
4E5
5E5
Totalcells
Crank angle [Deg]
Figure 5: Total cells in the computational domain
Figure 6: Computational domain at +37 CAD ATDC: (a) without contours;
(b) with temperature contours
Fuel is injected under high pressure at -9 CAD BTDC into the main combustion chamber
with a central hole nozzle. High injection pressure (Figure 3) and the small hole nozzle lead to
a good mixture formation. The shape of the bowl allows the spray to penetrate much longer
into the combustion chamber and gives it a sufficient time to evaporate and to mix with air. At
the same time the bowl avoids the injected fuel to collide with the wall.
Figure 7 shows the computed and experimental in-cylinder pressure (Montgomery &
Reitz, 1996; Xin et al., 1997). A good agreement between numerical and experimental in-
cylinder pressure is obtained. The zoomed view of Figure 7 shows a slight underprediction in
the pressure around the TDC. The underprediction of the pressure may be due to the mechanism
involved in the mixture formation and the spray atomization which may result in a slight
reduction in the temperature due to the absorption of heat during compression. The
overprediction showed in the zoomed view of Figure 7 may be due to RNG k- ε model which
apparently misrepresent the rate of mixing during combustion. (Huang et al., 2016).](https://image.slidesharecdn.com/jsaem-2-2-naima-181115204735/75/Numerical-Simulation-of-Combustion-Behavior-of-DI-Diesel-Engine-with-Conjunction-of-AMR-and-Embedding-Refinement-Strategies-7-2048.jpg)
![© Journal of the Society of Automotive Engineers Malaysia
www.journal.saemalaysia.org.my
119
-100 -50 0 50 100 150
0
2
4
6
8
10
12
Pressure[MPa]
Crank angle [Deg]
Measured pressure
CONVERGE Simulation
-10 -8 -6 -4 -2 0 2 4 6 8 10 12 14 16 18 20 22 24 26 28 30
0
2
4
6
8
10
12
Pressure[MPa]
Crank angle [Deg]
Measured pressure
CONVERGE Simulation
Figure 7: In-cylinder pressure evolution (experiment and CONVERGE simulation)
Figure 8 depicts the heat release rate evolution from -20 CA BTD to +40 CA ATDC.
Generally, heat release rate of the diesel engine is subdivided into four phases: The ignition
delay period, which is commonly defined as the period between start of fuel injection and the
start of combustion. The second phase is the premixed combustion, in which the homogenous
air/fuel mixture is brought into the flammability limits and burns rapidly in a few crank angle
degrees resulting in a high heat release rate. The next phase is mixing controlled combustion.
The burning rate is controlled by the fuel vapour air mixing process. In this phase the heat
release rate may not reach another peak, it decreases as this phase progresses (Heywood, 1988).
The last phase is post-combustion or late combustion phase where in-cylinder pressure and
temperature decrease significantly and the combustion is controlled by reaction kinetics.
-20 -10 0 10 20 30 40
-50
0
50
100
150
200
250
300
350
400
450
500
HeatReleaserate[J/CA]
Crank angle [Deg]
Figure 8: Heat release rate evolution
Figure 9 shows the temperature evolution during the simulation. At the premixed and
controlled mixing phase the temperature increases rapidly resulting in high heat release rate.
Carbon dioxide CO2 emissions are depicted in Figure 10. CO2 emissions are resulting from
complete combustion where the carbon atoms contained in the fuel are fully oxidized. They
are usually not regulated by emission legislations and not considered as a harmful gas, however
since they are a greenhouse gas, there is a strong requirement to reduce CO2 emissions.
Zoomed view to right](https://image.slidesharecdn.com/jsaem-2-2-naima-181115204735/75/Numerical-Simulation-of-Combustion-Behavior-of-DI-Diesel-Engine-with-Conjunction-of-AMR-and-Embedding-Refinement-Strategies-8-2048.jpg)
![© Journal of the Society of Automotive Engineers Malaysia
www.journal.saemalaysia.org.my
120
CO emissions are presented in Figure 11. They are a sign of incomplete combustion and
are predominantly dependent on the equivalence ratio and temperature. CO emissions from
diesel engines are typically scant because of the adequate oxygen levels (low equivalence ratio)
(Kalargaris et al., 2018). Figure 12 depicts NOx emissions. In diesel engines, the mechanism
that produces the majority of NOx is the thermal mechanism due to the elevated temperature
and high oxygen availability.
Figure 13 and Figure 14 present respectively the variation of unburned HC and soot
emissions. The HC emissions in the exhaust are mainly due to the under-mixing or over-leaning
(bulk-quenching) zones and wall flame-quenching (Heywood, 1988; Mendez et al., 2009). HC
and soot emissions increase strongly during the premixed combustion period reaching their
peak at the end of this stage and decrease to reach the minimum at the end of the mixing-
controlled combustion phase, at the same phase NOx and CO2 emissions reach their constant
peak at an advanced stage of the mixing-controlled combustion phase.
-160-140-120-100 -80 -60 -40 -20 0 20 40 60 80 100 120 140 160
200
400
600
800
1000
1200
1400
1600
1800
Temperature[K]
Crank angle [Deg]
-20 0 20 40 60 80 100 120 140 160
0.0
1.0x10
-4
2.0x10
-4
3.0x10
-4
4.0x10
-4
5.0x10
-4
6.0x10
-4
CO2emissions[Kg]
Crank Angle [Deg]
Figure 9: In-cylinder average temperature Figure 10: In-cylinder CO2 evolution
-20 0 20 40 60 80 100 120 140 160
0.0
5.0x10
-5
1.0x10
-4
1.5x10
-4
2.0x10
-4
COemissions[Kg]
Crank angle [Deg]
-20 0 20 40 60 80 100 120 140 160
-1.0x10
-6
0.0
1.0x10
-6
2.0x10
-6
3.0x10
-6
4.0x10
-6
5.0x10
-6
6.0x10
-6
7.0x10
-6
NOxemissions[Kg]
Crank angle [Deg]
Figure 11: In-cylinder CO evolution Figure 12: In-cylinder NOx evolution](https://image.slidesharecdn.com/jsaem-2-2-naima-181115204735/75/Numerical-Simulation-of-Combustion-Behavior-of-DI-Diesel-Engine-with-Conjunction-of-AMR-and-Embedding-Refinement-Strategies-9-2048.jpg)
![© Journal of the Society of Automotive Engineers Malaysia
www.journal.saemalaysia.org.my
121
-20 -10 0 10 20 30 40 50
0
1x10⁻⁵
2x10⁻⁵
3x10⁻⁵
4x10⁻⁵
HCemissions[Kg]
Crank angle [Deg]
-20 0 20 40 60 80 100 120 140 160
0.0
2.0x10
-7
4.0x10
-7
6.0x10
-7
8.0x10
-7
1.0x10
-6
1.2x10
-6
HiroySootemissions[Kg]
Crank angle [Deg]
Figure 13: In-cylinder HC evolution Figure 14: In-cylinder soot evolution
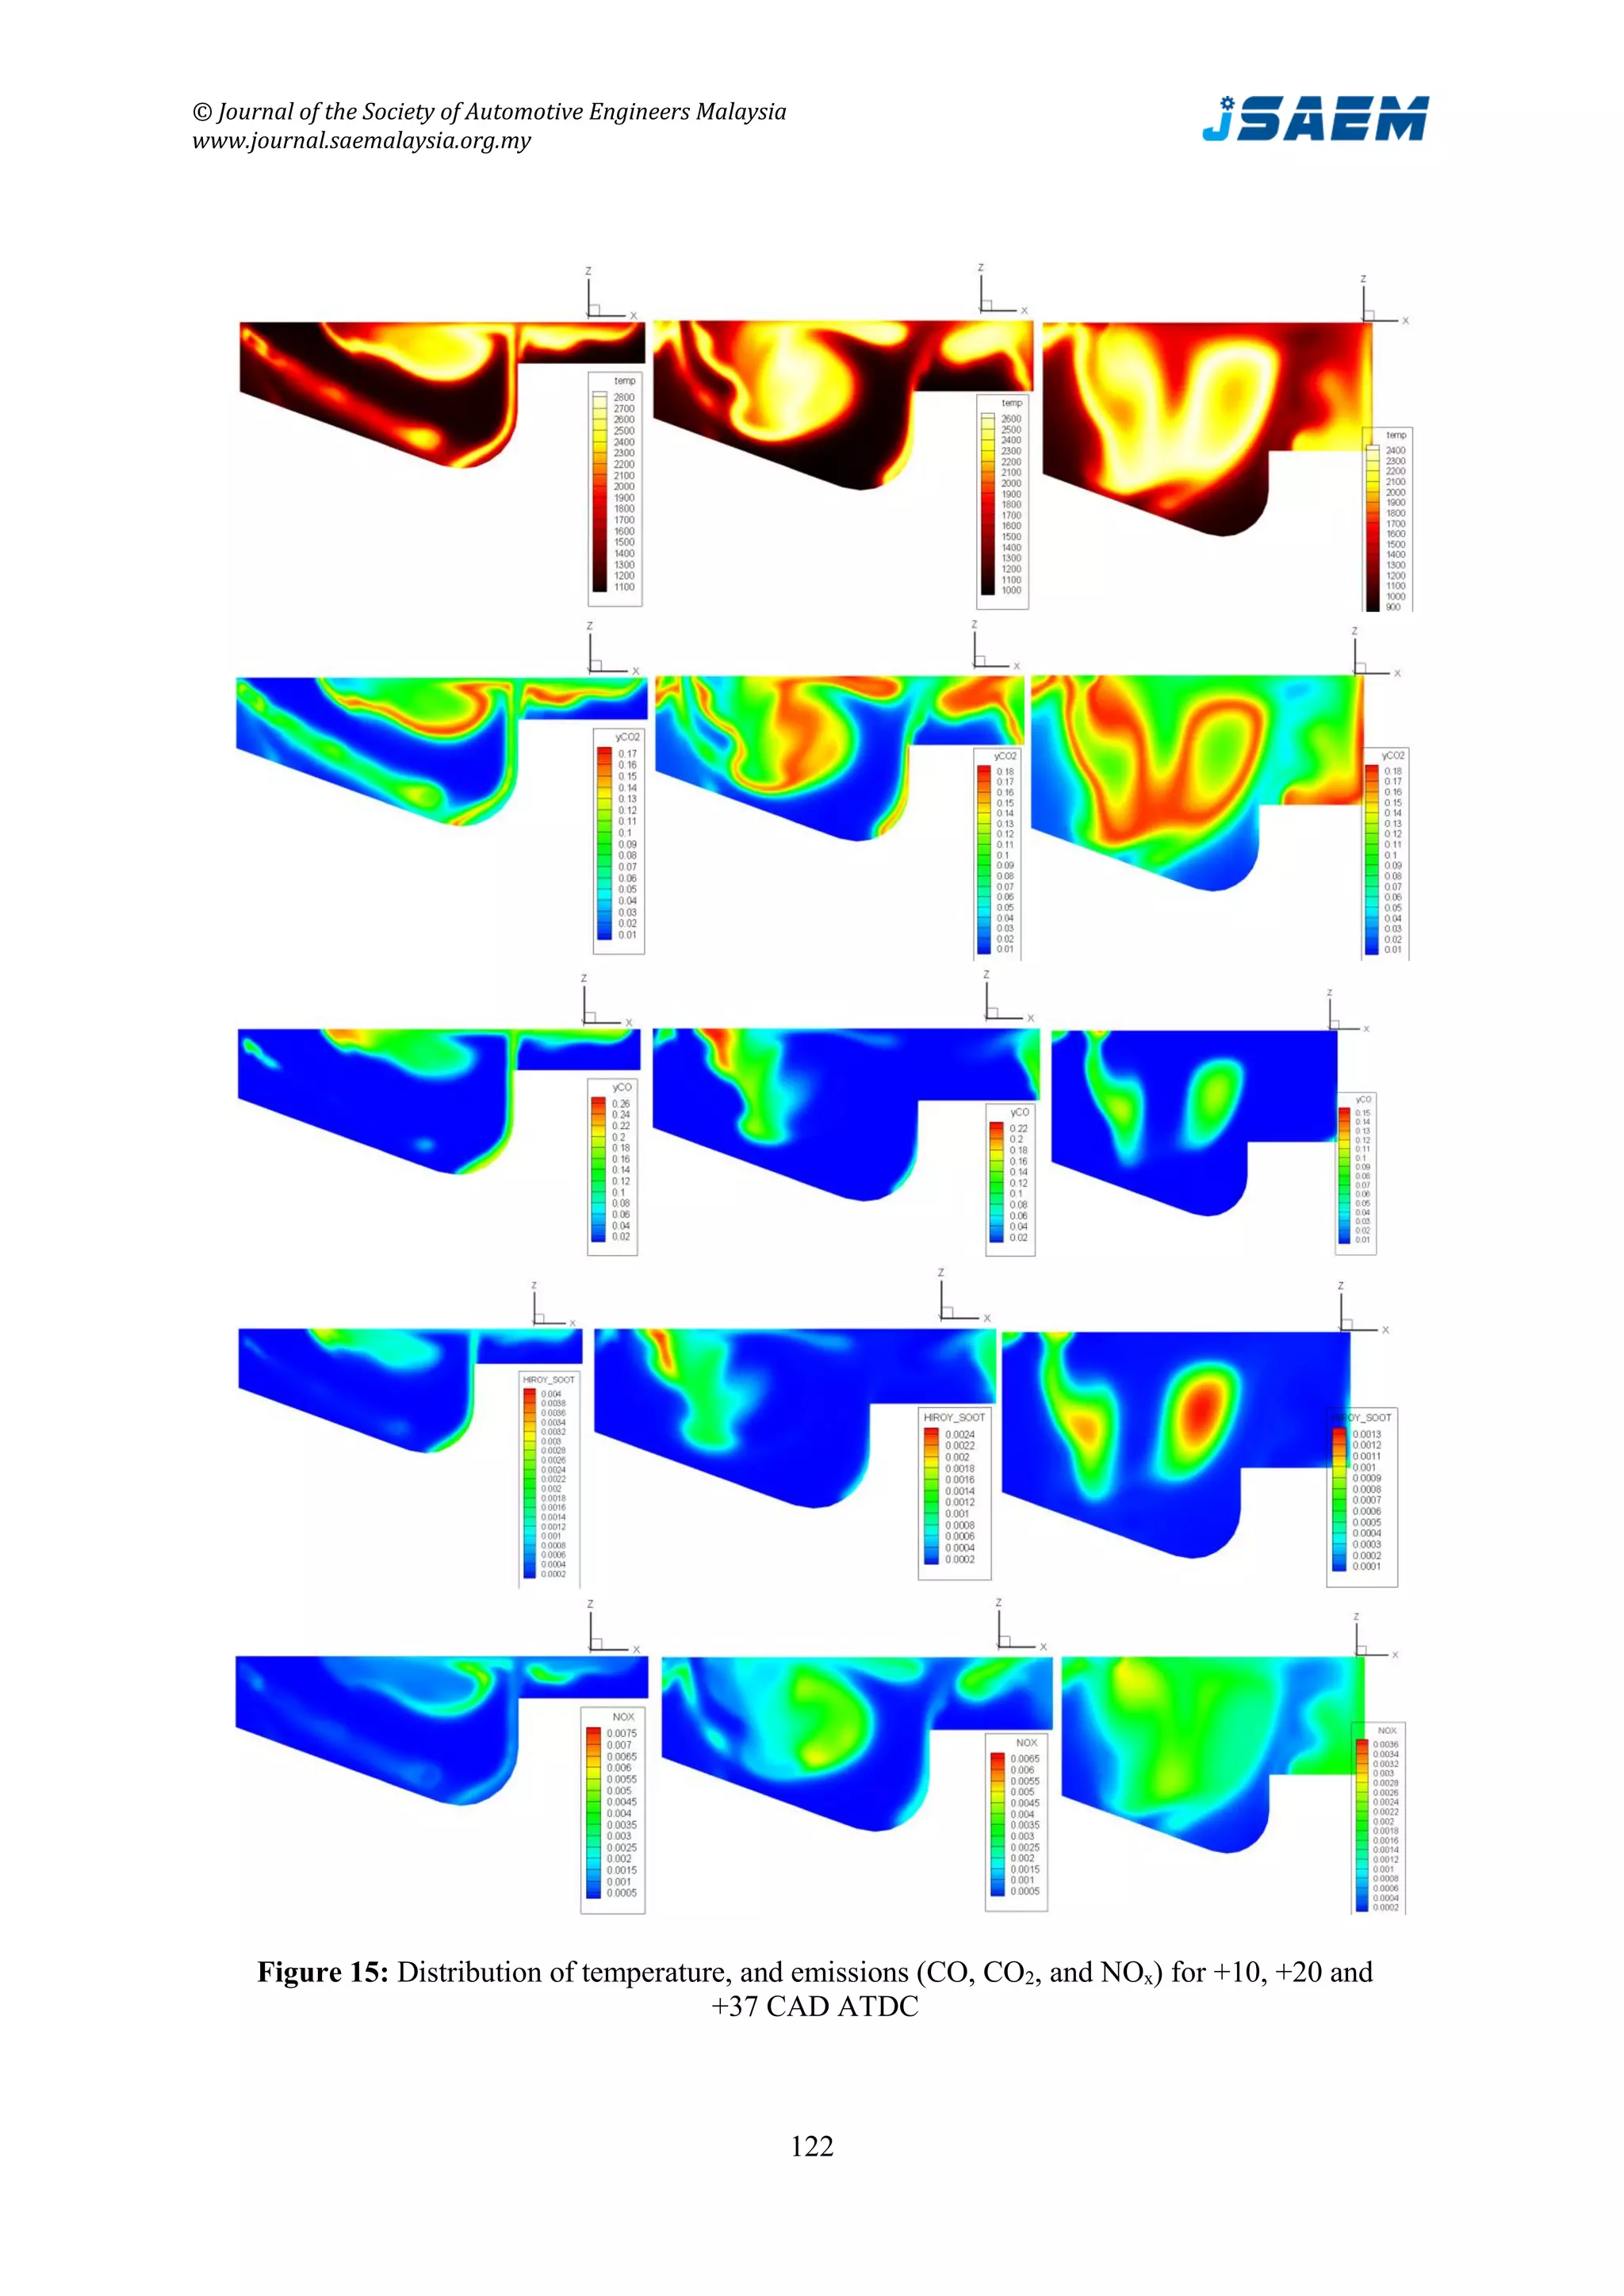
Figure 15 shows the different views of temperature, NOx, CO, CO2 and soot distribution
for +10, +20 and +37 CAD ATDC. Previous studies (Ferguson & Kirkpatrick, 2015; Heywood,
1988; Khatir & Liazid, 2013) have reported that the greater part of the heat release form the
combustion process occurs during the CO oxidation. CO emissions are mainly formed in
locally rich air/fuel mixture where O2 is insufficient to completely convert all carbon fuel to
CO2. (Ferguson & Kirkpatrick, 2015). Figure 15 shows clearly this interaction, especially at
+10 CAD ATDC. The high levels of CO are produced near the wall boundary due to the
incomplete combustion resulting from low temperature at the cylinder wall.
Nitrogen oxides (NOx) are composed of NO and NO2. They are produced from the
disassociation of N2 and O2 into their atomic states and subsequent reactions between them.
The thermal mechanism is the major chemical mechanism that produces NOx under high
temperature conditions. Figure 15 shows that NO emissions are formed during the combustion
at high-temperature regions especially behind and inside the flame front. Since the volume of
the high-temperature burned gases is much larger at +37 CAD ATDC, the emissions of NOx
are higher than those formed at +10 and +20 CAD ATDC. With AMR and embedding around
the nozzle being used, the prediction of CO, NO and soot formation can be efficiency achieved.
The reason for this is that the refinement process results in high peak gas phase velocities. If
this high gas phases velocities are not handled, the high drop/gas relative velocities may result.
This should increase the break-up rate and therefore reduce the penetration.
The use of the refinement process reduces the drop/gas relative velocities because the gas
velocity is computed accurately for the small cell size. This is very beneficial for enhancing
the mixing process. As the mixing is enhanced, a high prediction of the pressure, temperature,
heat release and emissions is achieved. It’s important to note that the embedding is important
as AMR is used, especially the embedding around the nozzle. Indeed, to save the computational
time, AMR is activated at -10 CAD ATDC, that means 1 CAD before the injection. If the
embedded around the nozzle is not activated, it may take too long for the AMR algorithm to
detect the need for additional cells, and therefore some of the spray/gas problems may occur
(Richards et al., 2008). The use of embedded around the boundary and around the nozzle before
the injection with a conjunction with AMR would enhance the results for both mean and cell-
by-cell results.](https://image.slidesharecdn.com/jsaem-2-2-naima-181115204735/75/Numerical-Simulation-of-Combustion-Behavior-of-DI-Diesel-Engine-with-Conjunction-of-AMR-and-Embedding-Refinement-Strategies-10-2048.jpg)