Download to read offline

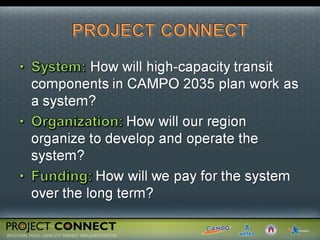
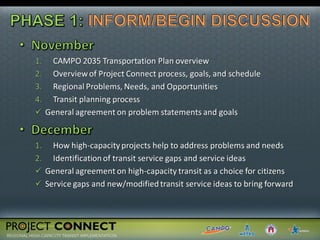
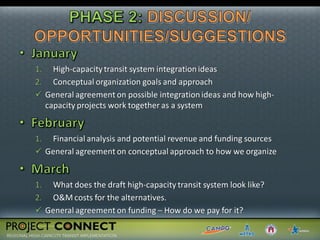
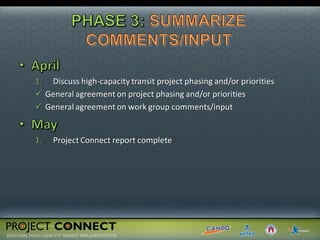
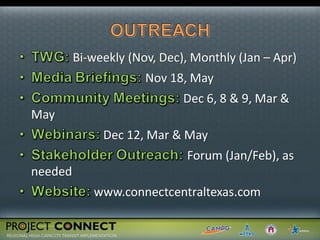

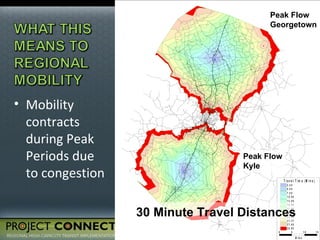
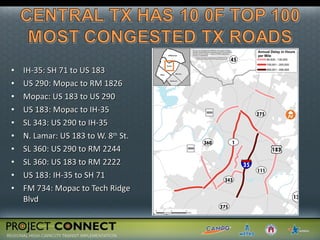
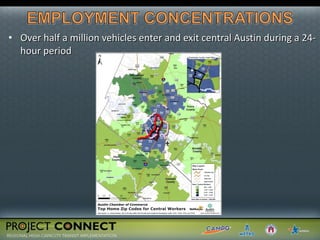
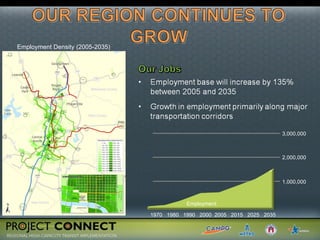
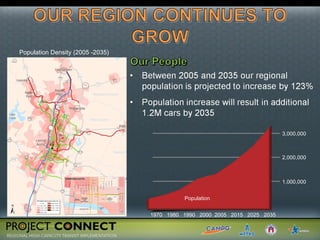
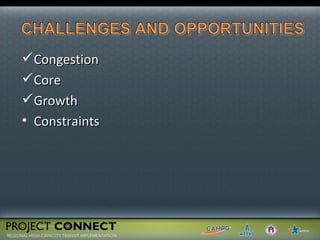
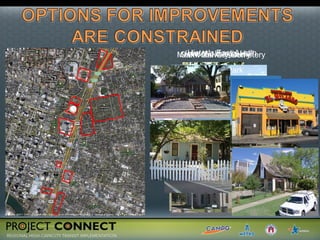
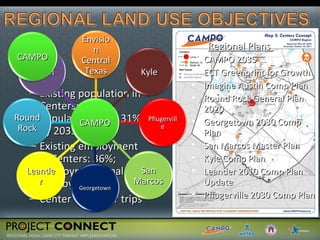

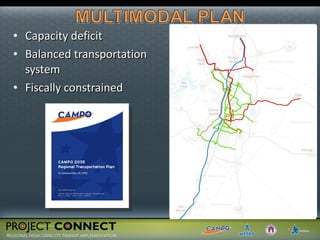
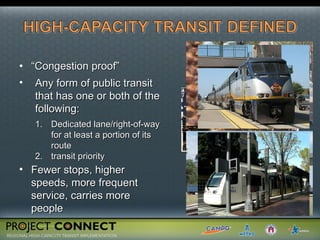
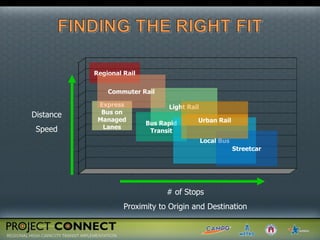
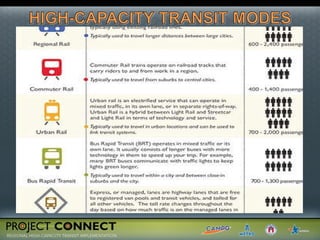
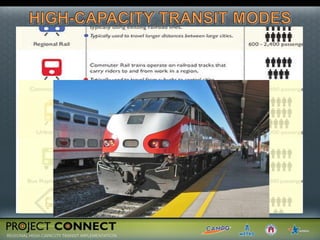
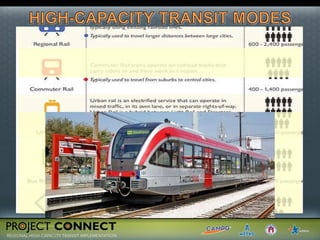
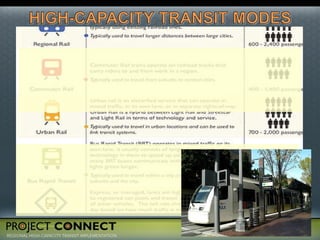
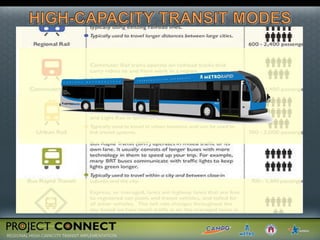
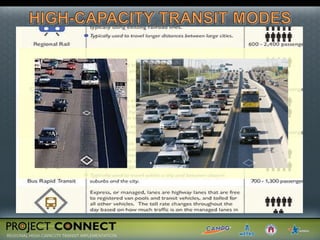
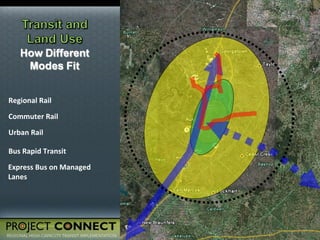

The document summarizes the agenda and discussion topics for a Transit Working Group meeting. It discusses regional transportation challenges like congestion, growth constraints, and the need for high-capacity transit options. It also provides an overview of different high-capacity transit modes and projects currently being considered to address mobility needs in the Austin metropolitan region.


