1. 0
50
100
150
200
250
300
1994 1996 1998 2000 2002 2004 2006 2008 2010 2012 2014
#ofvehiclesinoperation
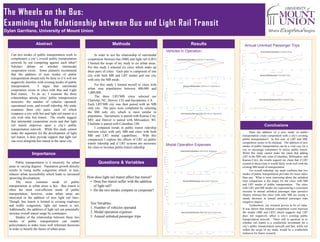
Sacramento/Kansas City Vehicles in Operation
Sacramento MB Kansas City MB Sacramento LRT
The Wheels on the Bus:
Examining the Relationship between Bus and Light Rail Transit
Dylan Garritano, University of Mount Union
Abstract
Importance
Methods Results
Conclusions
Can two modes of public transportation work to
complement a city’s overall public transportation
network by not competing against each other?
Scholars debate on whether intermodal
cooperation exists. Some planners recommend
that the addition of new modes of public
transportation should only be done so if it will not
negatively interfere with existing modes of public
transportation. I argue that intermodal
cooperation exists in cities with Bus and Light
Rail transit. To do so, I examine the three
relationships among cities’ public transportation
networks: the number of vehicles operated,
operational costs, and overall ridership. My study
examines three city pairs, each of which
compares a city with bus and light rail transit to a
city with only bus transit. The results suggest
that intermodal cooperation exists and that light
rail transit improves upon a city’s public
transportation network. While this study cannot
make the argument for the development of light
rail transit, it does provide support that light rail
can exist alongside bus transit in the same city.
Vehicles in Operation:
Modal Operation Expenses
Does the addition of a new mode of public
transportation create competition with a city’s existing
public transportation? In this case of LRT and MB,
competition seems to be minimal. The addition of new
modes of public transportation can be a vital way for a
city to encourage commuters to utilize public transit.
While this study cannot make the claim that adding
LRT to the MB only cities (Columbus; Milwaukee; and
Kansas City), the results support my claim that if LRT
existed in these cities it would likely work well with the
existing MB mode of transportation.
For overall ridership, my study confirms that two
modes of public transportation provides for more riders
than one. What is most interesting about the unlinked
trips comparison is the slopes for the cities with MB
and LRT modes of public transportation. The cities
with LRT and MB modes are experiencing a consistent
increase in annual unlinked passenger trips (positive
slopes) whereas the cities with only MB are seeing a
steady decrease in annual unlinked passenger trips
(negative slopes).
Furthermore, my research proves to be of value.
It was shown that minimal competition exists between
the modes (MB and LRT) which suggests that LRT
does not negatively affect a city’s existing public
transportation network. There still is question as to
whether rail transit is a worthwhile investment for a
city’s public transportation network and that, while not
within the scope of my study, would be a worthwhile
endeavor for future research.
Annual Unlinked Passenger Trips
In order to test the relationship of intermodal
cooperation between bus (MB) and light rail (LRT)
I limited the scope of my study to six urban areas.
For this study I selected six cities which make up
three pairs of cities. Each pair is comprised of one
city with both MB and LRT modes and one city
with only the MB mode.
For this study I limited myself to cities with
urban area populations between 400,000 and
1,000,000.
The three LRT/MB cities selected are
Charlotte, NC; Denver, CO; and Sacramento, CA.
Each LRT/MB city was then paired with an MB
only city. The pairs were completed by selecting
the MB only city which is most similar in
population. Sacramento is paired with Kansas City,
MO; and Denver is paired with Milwaukee, WI.
Charlotte is paired with Columbus, OH.
I compared trends in public transit ridership
between cities with only MB and cities with both
MB and LRT modal capabilities. With this
comparison I explore the effects of LRT on public
transit ridership and if LRT systems are necessary
for cities to increase public transit ridership.
Public transportation is a necessity for urban
areas in varying degrees. Population growth directly
results in rising traffic congestion which, in turn,
reduces urban accessibility which leads to increased
sprawling development.
The most common mode of public
transportation in urban areas is bus. Bus transit is
often the most cost-efficient mode of public
transportation; however, some urban areas are
interested in the addition of new light rail lines.
Though, bus transit is limited to existing roadways
and traffic congestion, light rail transit is not.
Additionally, the addition of light rail can potentially
increase overall transit usage by commuters.
Studies of the relationship between these two
modes of public transportation can enable
policymakers to make more well informed decisions
in order to benefit the future of urban areas.
0
50
100
150
200
250
300
350
1994 1996 1998 2000 2002 2004 2006 2008 2010 2012 2014
#ofvehicles
Charlotte/Columbus Vehicles in Operation
Charlotte MB Columbus MB Charlotte LR
0
100
200
300
400
500
600
700
1994 1996 1998 2000 2002 2004 2006 2008 2010 2012 2014
#ofvehiclesinoperation
Denver/Milwaukee Vehicles in Operation
Denver MB Milwaukee MB Denver LRT
$ M
$10 M
$20 M
$30 M
$40 M
$50 M
$60 M
$70 M
$80 M
$90 M
1994 1996 1998 2000 2002 2004 2006 2008 2010 2012 2014
ModalOperatingExpenses
Charlotte/Columbus Operation Expenses
Charlotte MB Columbus MB Charlotte LR
$ M
$50 M
$100 M
$150 M
$200 M
$250 M
$300 M
$350 M
1994 1996 1998 2000 2002 2004 2006 2008 2010 2012 2014
ModalOperatingExpenses
Denver/Milwaukee Operation Expenses
Denver MB Milwaukee MB Denver LR
$ M
$10 M
$20 M
$30 M
$40 M
$50 M
$60 M
$70 M
$80 M
$90 M
$100 M
1994 1996 1998 2000 2002 2004 2006 2008 2010 2012 2014
ModalOperatingExpenses
Sacramento/Kansas City Operation Expenses
Sacramento MB Kansas City MB Sacramento LR
-
5.0
10.0
15.0
20.0
25.0
30.0
1980 1985 1990 1995 2000 2005 2010 2015
AnnualUnlinkedTrips(millions)
Charlotte/Columbus Unlinked Trips
Charlotte Columbus
-
20.0
40.0
60.0
80.0
100.0
120.0
1980 1985 1990 1995 2000 2005 2010 2015
AnnualUnlinkedTrips(millions)
Denver/Milwaukee Unlinked Trips
Denver Milwaukee
-
5.0
10.0
15.0
20.0
25.0
30.0
35.0
40.0
1980 1985 1990 1995 2000 2005 2010 2015
AnnualUnlinkedTrips(millions)
Sacramento/Kansas City Unlinked Trips
Kansas City Sacramento
Questions & Variables
How does light rail transit affect bus transit?
• Does bus transit suffer with the addition
of light rail?
• Do the two modes compete or cooperate?
Test Variables:
1. Number of vehicles operated
2. Modal operation expenses
3. Annual unlinked passenger trips