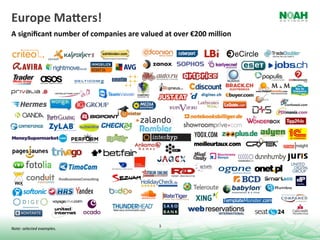
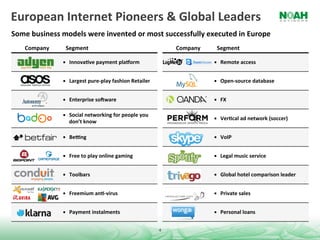
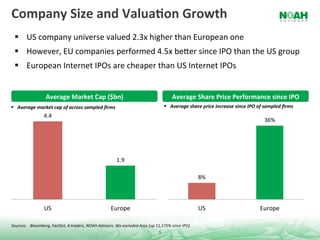
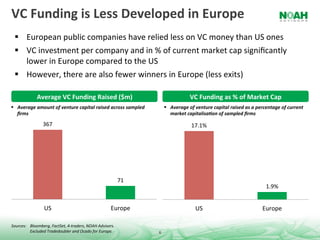
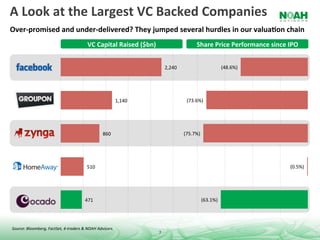
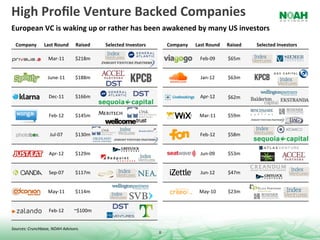
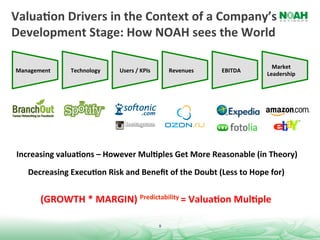
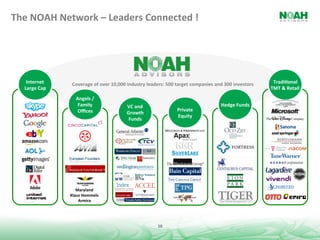
November	
  2012	
  

Strictly	
  Private	
  and	
  Confiden2al	
  
Reaching	
  to	
  New	
  Limits	
  …	
  We	
  Are	
  Proud	
  to	
  Be	
  Here	
  
      Guys,	
                           It	
  is	
  Really	
              Finally	
  
    Let’s	
  Go!	
                       Hot	
  Here	
                    Here!	


                                              2	
  
Europe	
  MaJers!	
  
A	
  significant	
  number	
  of	
  companies	
  are	
  valued	
  at	
  over	
  €200	
  million	


                                                                   3	
  
Note:	
  selected	
  examples.	
  
European	
  Internet	
  Pioneers	
  &	
  Global	
  Leaders	
  
Some	
  business	
  models	
  were	
  invented	
  or	
  most	
  successfully	
  executed	
  in	
  Europe	
  
     Company	
        Segment	
                                                     Company	
      Segment	
  

                       InnovaQve	
  payment	
  plaRorm	
                                           Remote	
  access	


                       Largest	
  pure-­‐play	
  fashion	
  Retailer	
                             Open-­‐source	
  database	


                       Enterprise	
  soTware	
                                                     FX	
  

                       Social	
  networking	
  for	
  people	
  you	
  
                        don’t	
  know	
                                                             VerQcal	
  ad	
  network	
  (soccer)	


                       BeVng	
                                                                     VoIP	


                       Free	
  to	
  play	
  online	
  gaming	
                                    Legal	
  music	
  service	


                       Toolbars	
                                                                  Global	
  hotel	
  comparison	
  leader	


                       Freemium	
  anQ-­‐virus	
                                                   Private	
  sales	


                       Payment	
  instalments	
                                                    Personal	
  loans	
  

                                                                            4	
  
Company	
  Size	
  and	
  ValuaQon	
  Growth	
  
    US	
  company	
  universe	
  valued	
  2.3x	
  higher	
  than	
  European	
  one	
  
    However,	
  EU	
  companies	
  performed	
  4.5x	
  beGer	
  since	
  IPO	
  than	
  the	
  US	
  group	
  
    European	
  Internet	
  IPOs	
  are	
  cheaper	
  than	
  US	
  Internet	
  IPOs	


                           Average	
  Market	
  Cap	
  ($bn)	
                                                                  Average	
  Share	
  Price	
  Performance	
  since	
  IPO	
  
  Average	
  market	
  cap	
  of	
  across	
  sampled	
  firms	
                                                             Average	
  share	
  price	
  increase	
  since	
  IPO	
  of	
  sampled	
  firms	
  
                         4.4	
  
                                                                                                                                                                                            36%	


                                                                                  1.9	
  

                                                                                                                                                 8%	


                         US	
                                                 Europe	
                                                           US	
                                    Europe	
  

Sources:	
   	
  Bloomberg,	
  FactSet,	
  4-­‐traders,	
  NOAH	
  Advisors.	
  We	
  excluded	
  Asos	
  (up	
  11,175%	
  since	
  IPO)	
  
                                                                                                                   5	
  
VC	
  Funding	
  is	
  Less	
  Developed	
  in	
  Europe	
  
    European	
  public	
  companies	
  have	
  relied	
  less	
  on	
  VC	
  money	
  than	
  US	
  ones	
  
    VC	
  investment	
  per	
  company	
  and	
  in	
  %	
  of	
  current	
  market	
  cap	
  significantly	
  
     lower	
  in	
  Europe	
  compared	
  to	
  the	
  US	
  
    However,	
  there	
  are	
  also	
  fewer	
  winners	
  in	
  Europe	
  (less	
  exits)	
  

                   Average	
  VC	
  Funding	
  Raised	
  ($m)	
                                                      VC	
  Funding	
  as	
  %	
  of	
  Market	
  Cap	
  
  Average	
  amount	
  of	
  venture	
  capital	
  raised	
  across	
  sampled	
                     Average	
  of	
  venture	
  capital	
  raised	
  as	
  a	
  percentage	
  of	
  current	
  
   firms	
                                                                                              market	
  capitalisa:on	
  of	
  sampled	
  firms	
  

                        367	
                                                                                         17.1%	


                                                                                   71	
  
                                                                                                                                                                        1.9%	


                         US	
                                               Europe	
                                    US	
                                         Europe	
  

Sources:	
   	
  Bloomberg,	
  FactSet,	
  4-­‐traders,	
  NOAH	
  Advisors.	
  
                 Excluded	
  Tradedoubler	
  and	
  Ocado	
  for	
  Europe.	
               6	
  
A	
  Look	
  at	
  the	
  Largest	
  VC	
  Backed	
  Companies	
  
Over-­‐promised	
  and	
  under-­‐delivered?	
  They	
  jumped	
  several	
  hurdles	
  in	
  our	
  valuaQon	
  chain	
  
                                                         VC	
  Capital	
  Raised	
  ($bn)	
                                 Share	
  Price	
  Performance	
  since	
  IPO	


                                                                                                        2,240	
                             (48.6%)	


                                                                                 1,140	
                             (73.6%)	


                                                                     860	
                                          (75.7%)	


                                                         510	
                                                                                                          (0.5%)	


                                                       471	
                                                                  (63.1%)	


Source:	
  Bloomberg,	
  FactSet,	
  4-­‐traders	
  &	
  NOAH	
  Advisors.	
  
                                                                                                7	
  
High	
  Profile	
  Venture	
  Backed	
  Companies	
  
European	
  VC	
  is	
  waking	
  up	
  or	
  rather	
  has	
  been	
  awakened	
  by	
  many	
  US	
  investors	
  
  Company	
           Last	
  Round	
       Raised	
     Selected	
  Investors	
             Company	
     Last	
  Round	
     Raised	
     Selected	
  Investors	
  

                         Mar-­‐11	
         $218m	
                                                           Feb-­‐09	
       $65m	


                         June-­‐11	
        $188m	
                                                           Jan-­‐12	
       $63m	


                          Dec-­‐11	
        $166m	
                                                           Apr-­‐12	
       $62m	


                          Feb-­‐12	
        $145m	
                                                          Mar-­‐11	
        $59m	


                          Jul-­‐07	
        $130m	
                                                           Feb-­‐12	
       $58m	


                          Apr-­‐12	
        $129m	
                                                           Jun-­‐09	
       $53m	


                          Sep-­‐07	
        $117m	
                                                           Jun-­‐12	
       $47m	


                         May-­‐11	
         $114m	
                                                          May-­‐10	
        $23m	


                          Feb-­‐12	
       ~$100m	


Sources:	
  Crunchbase,	
  NOAH	
  Advisors.	
  
                                                                                     8	
  
ValuaQon	
  Drivers	
  in	
  the	
  Context	
  of	
  a	
  Company’s	
  
Development	
  Stage:	
  How	
  NOAH	
  sees	
  the	
  World	
  

                                                                                                          Market	
  
 Management	
         Technology	
        Users	
  /	
  KPIs	
             Revenues	
     EBITDA	
  
                                                                                                        Leadership	


 Increasing	
  valuaQons	
  –	
  However	
  MulQples	
  Get	
  More	
  Reasonable	
  (in	
  Theory)	
  

     Decreasing	
  ExecuQon	
  Risk	
  and	
  Benefit	
  of	
  the	
  Doubt	
  (Less	
  to	
  Hope	
  for)	


          (GROWTH	
  *	
  MARGIN)	
  Predictability	
  =	
  ValuaQon	
  MulQple	
  

                                                                   9	
  
The	
  NOAH	
  Network	
  –	
  Leaders	
  Connected	
  !	


     Internet	
  	
      Coverage	
  of	
  over	
  10,000	
  industry	
  leaders:	
  500	
  target	
  companies	
  and	
  300	
  investors	
      TradiQonal	
  	
  
    Large	
  Cap	
                                                                                                                               TMT	
  &	
  Retail	
  
                           Angels	
  /	
  	
  
                            Family	
  	
                    VC	
  and	
  	
                                             Hedge	
  Funds	
  
                            Offices	
                                                         Private	
  	
  
                                                            Growth	
  	
  
                                                                                            Equity	
  
                                                             Funds	


                           Maryland	
  
                        Klaus	
  Hommels	
  
                            Armira	


                                                                                10	
  

NOAH Advisors - NOAH12 London

  • 1.
    November  2012   Strictly  Private  and  Confiden2al  
  • 2.
    Reaching  to  New  Limits  …  We  Are  Proud  to  Be  Here   Guys,   It  is  Really   Finally   Let’s  Go!   Hot  Here   Here!   2  
  • 3.
    Europe  MaJers!   A  significant  number  of  companies  are  valued  at  over  €200  million     3   Note:  selected  examples.  
  • 4.
    European  Internet  Pioneers  &  Global  Leaders   Some  business  models  were  invented  or  most  successfully  executed  in  Europe   Company   Segment   Company   Segment     InnovaQve  payment  plaRorm     Remote  access     Largest  pure-­‐play  fashion  Retailer     Open-­‐source  database     Enterprise  soTware     FX     Social  networking  for  people  you   don’t  know     VerQcal  ad  network  (soccer)     BeVng     VoIP     Free  to  play  online  gaming     Legal  music  service     Toolbars     Global  hotel  comparison  leader     Freemium  anQ-­‐virus     Private  sales     Payment  instalments     Personal  loans   4  
  • 5.
    Company  Size  and  ValuaQon  Growth     US  company  universe  valued  2.3x  higher  than  European  one     However,  EU  companies  performed  4.5x  beGer  since  IPO  than  the  US  group     European  Internet  IPOs  are  cheaper  than  US  Internet  IPOs   Average  Market  Cap  ($bn)   Average  Share  Price  Performance  since  IPO     Average  market  cap  of  across  sampled  firms     Average  share  price  increase  since  IPO  of  sampled  firms   4.4   36%   1.9   8%   US   Europe   US   Europe   Sources:    Bloomberg,  FactSet,  4-­‐traders,  NOAH  Advisors.  We  excluded  Asos  (up  11,175%  since  IPO)   5  
  • 6.
    VC  Funding  is  Less  Developed  in  Europe     European  public  companies  have  relied  less  on  VC  money  than  US  ones     VC  investment  per  company  and  in  %  of  current  market  cap  significantly   lower  in  Europe  compared  to  the  US     However,  there  are  also  fewer  winners  in  Europe  (less  exits)   Average  VC  Funding  Raised  ($m)   VC  Funding  as  %  of  Market  Cap     Average  amount  of  venture  capital  raised  across  sampled     Average  of  venture  capital  raised  as  a  percentage  of  current   firms   market  capitalisa:on  of  sampled  firms   367   17.1%   71   1.9%   US   Europe   US   Europe   Sources:    Bloomberg,  FactSet,  4-­‐traders,  NOAH  Advisors.   Excluded  Tradedoubler  and  Ocado  for  Europe.   6  
  • 7.
    A  Look  at  the  Largest  VC  Backed  Companies   Over-­‐promised  and  under-­‐delivered?  They  jumped  several  hurdles  in  our  valuaQon  chain   VC  Capital  Raised  ($bn)   Share  Price  Performance  since  IPO   2,240   (48.6%)   1,140   (73.6%)   860   (75.7%)   510   (0.5%)   471   (63.1%)   Source:  Bloomberg,  FactSet,  4-­‐traders  &  NOAH  Advisors.   7  
  • 8.
    High  Profile  Venture  Backed  Companies   European  VC  is  waking  up  or  rather  has  been  awakened  by  many  US  investors   Company   Last  Round   Raised   Selected  Investors   Company   Last  Round   Raised   Selected  Investors   Mar-­‐11   $218m   Feb-­‐09   $65m   June-­‐11   $188m   Jan-­‐12   $63m   Dec-­‐11   $166m   Apr-­‐12   $62m   Feb-­‐12   $145m   Mar-­‐11   $59m   Jul-­‐07   $130m   Feb-­‐12   $58m   Apr-­‐12   $129m   Jun-­‐09   $53m   Sep-­‐07   $117m   Jun-­‐12   $47m   May-­‐11   $114m   May-­‐10   $23m   Feb-­‐12   ~$100m   Sources:  Crunchbase,  NOAH  Advisors.   8  
  • 9.
    ValuaQon  Drivers  in  the  Context  of  a  Company’s   Development  Stage:  How  NOAH  sees  the  World   Market   Management   Technology   Users  /  KPIs   Revenues   EBITDA   Leadership   Increasing  valuaQons  –  However  MulQples  Get  More  Reasonable  (in  Theory)   Decreasing  ExecuQon  Risk  and  Benefit  of  the  Doubt  (Less  to  Hope  for)     (GROWTH  *  MARGIN)  Predictability  =  ValuaQon  MulQple   9  
  • 10.
    The  NOAH  Network  –  Leaders  Connected  !   Internet     Coverage  of  over  10,000  industry  leaders:  500  target  companies  and  300  investors   TradiQonal     Large  Cap   TMT  &  Retail   Angels  /     Family     VC  and     Hedge  Funds   Offices   Private     Growth     Equity   Funds   Maryland   Klaus  Hommels   Armira   10