1. The document discusses creating a robust asset management strategy to optimize performance and reliability. It aims to reduce costs through non-asset solutions, maximizing asset life, lowering ownership costs, and ensuring accountability.
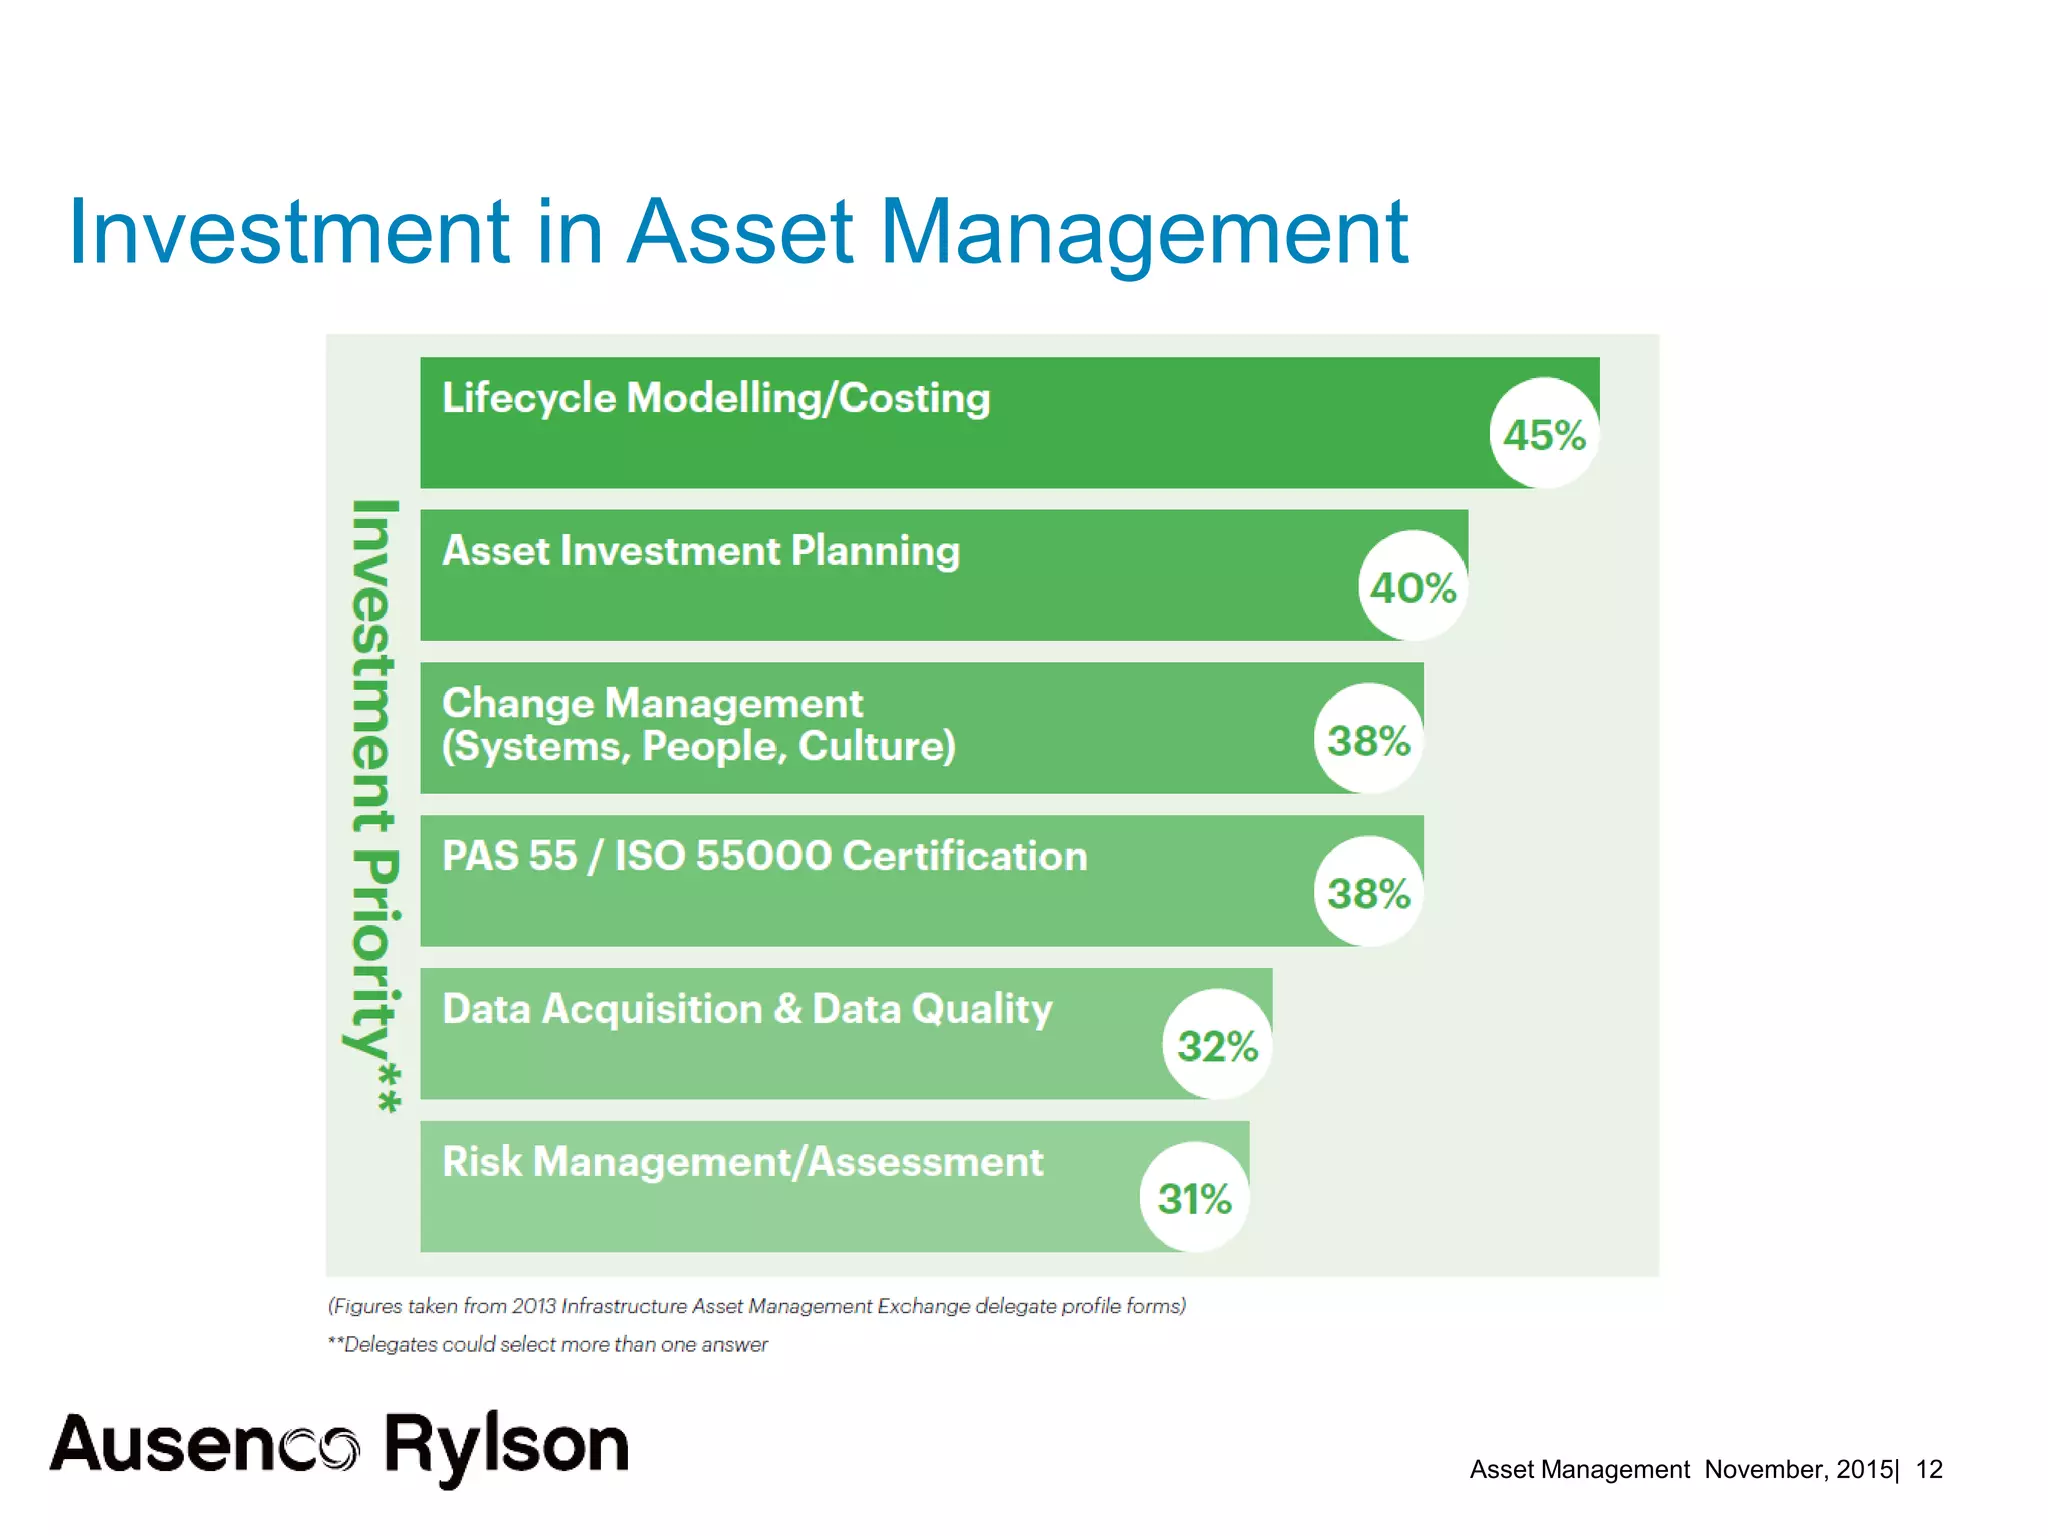
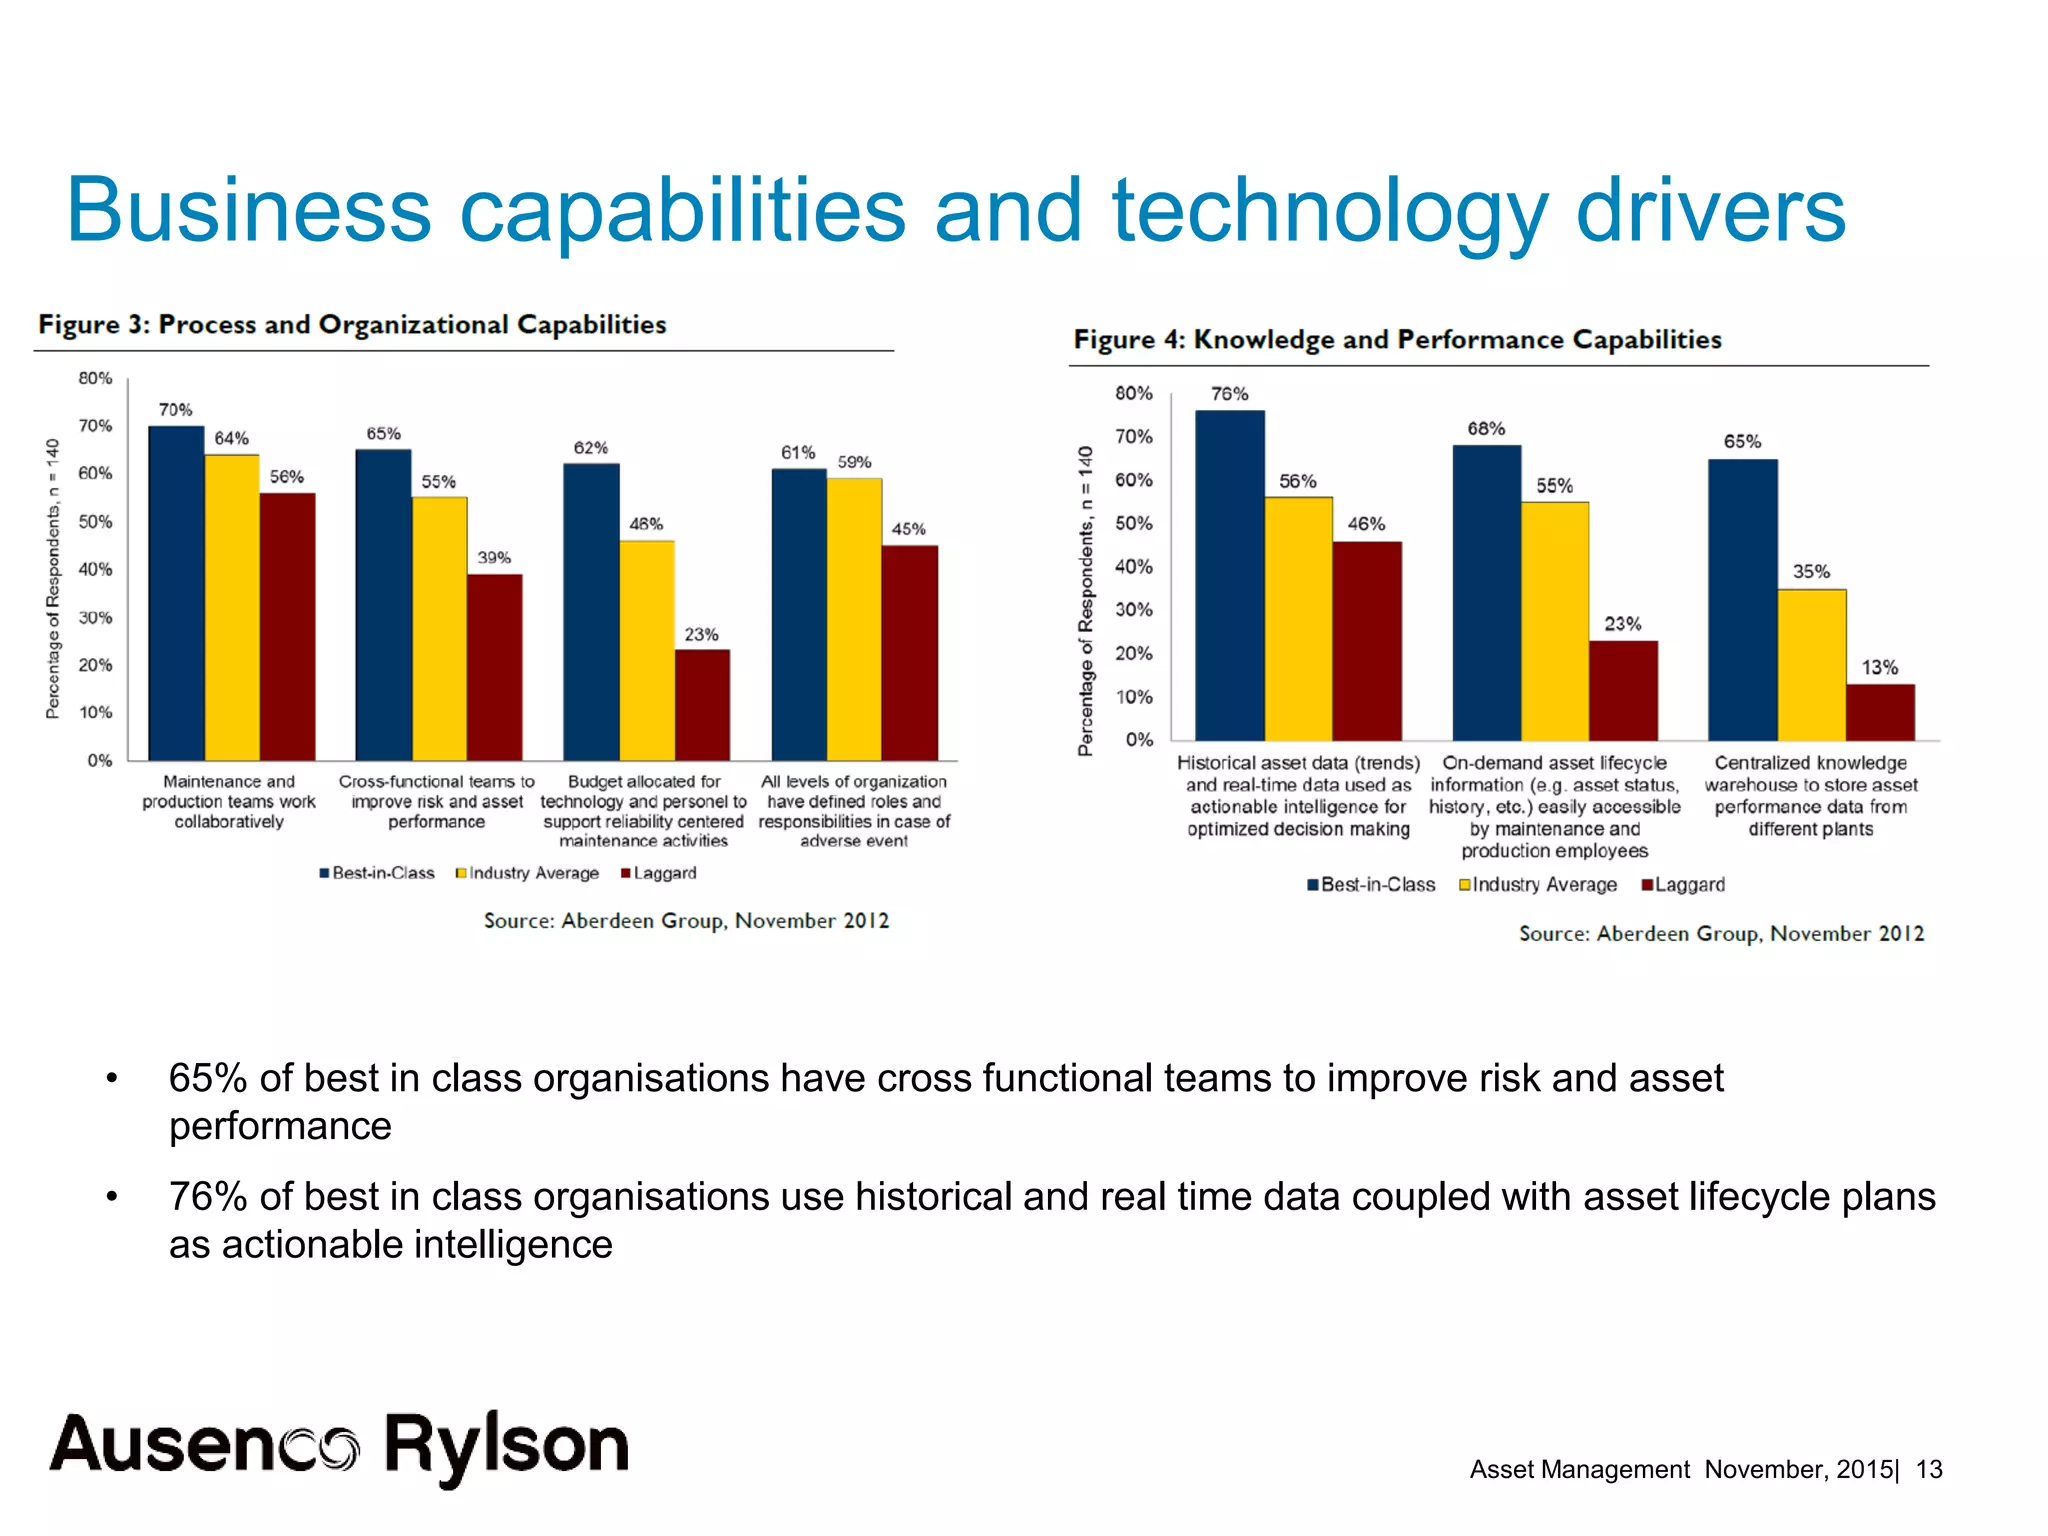
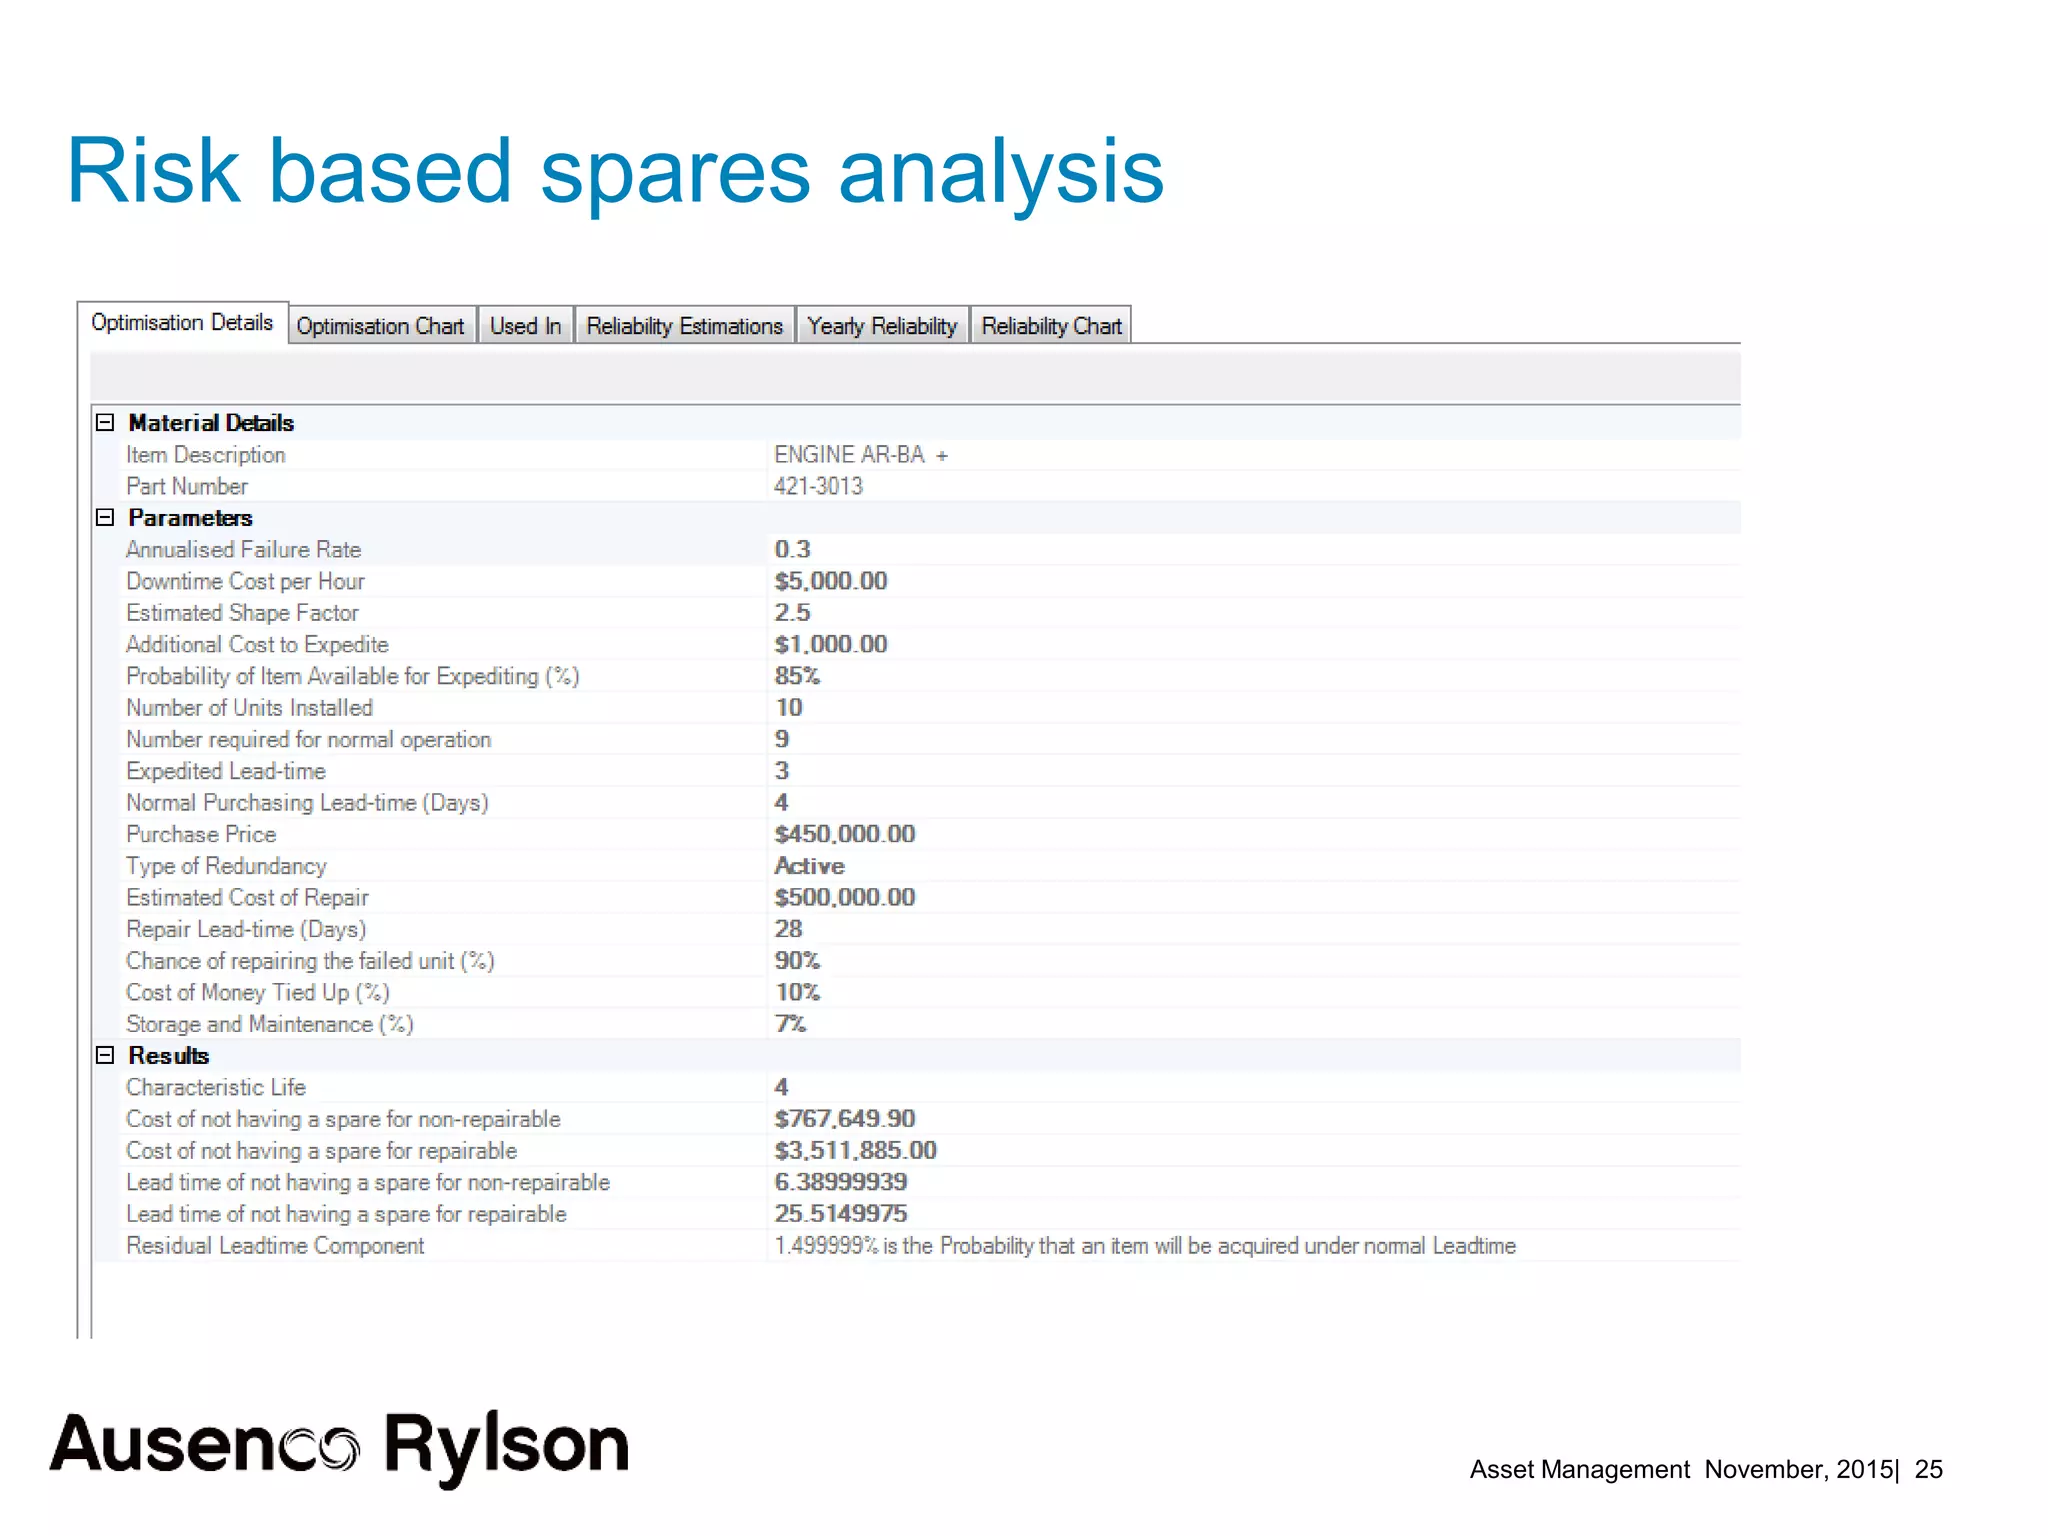
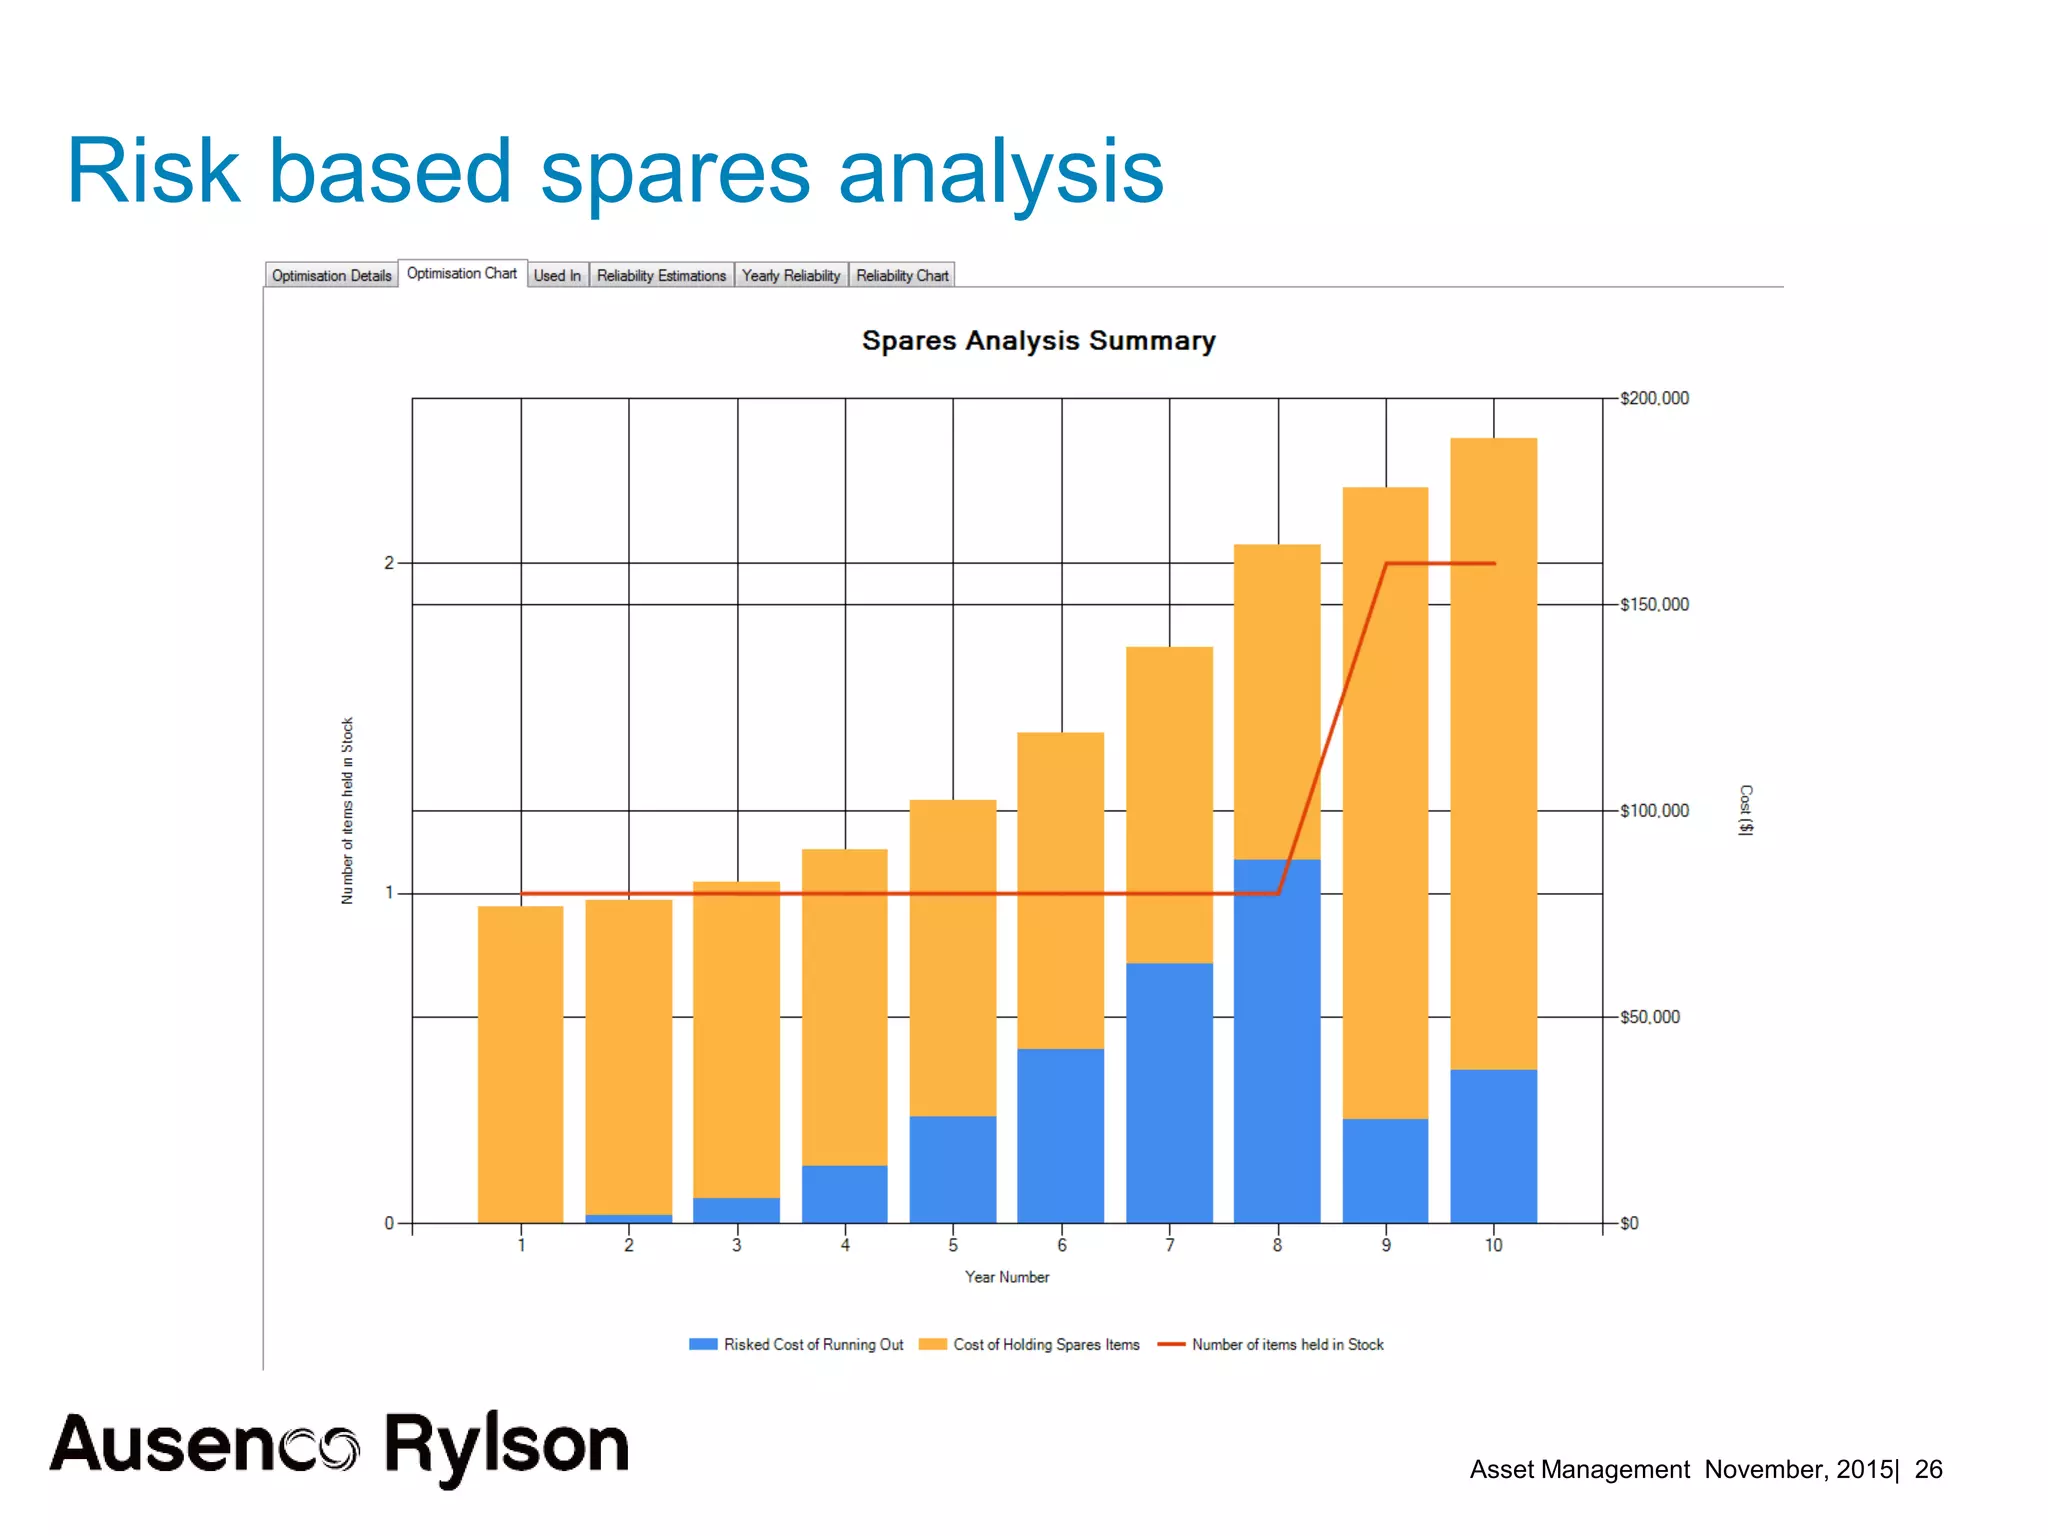
2. Current benchmarks show best performers invest heavily in asset management using historical and real-time data in lifecycle plans. Risk management techniques applied to maintenance reduce downtime.
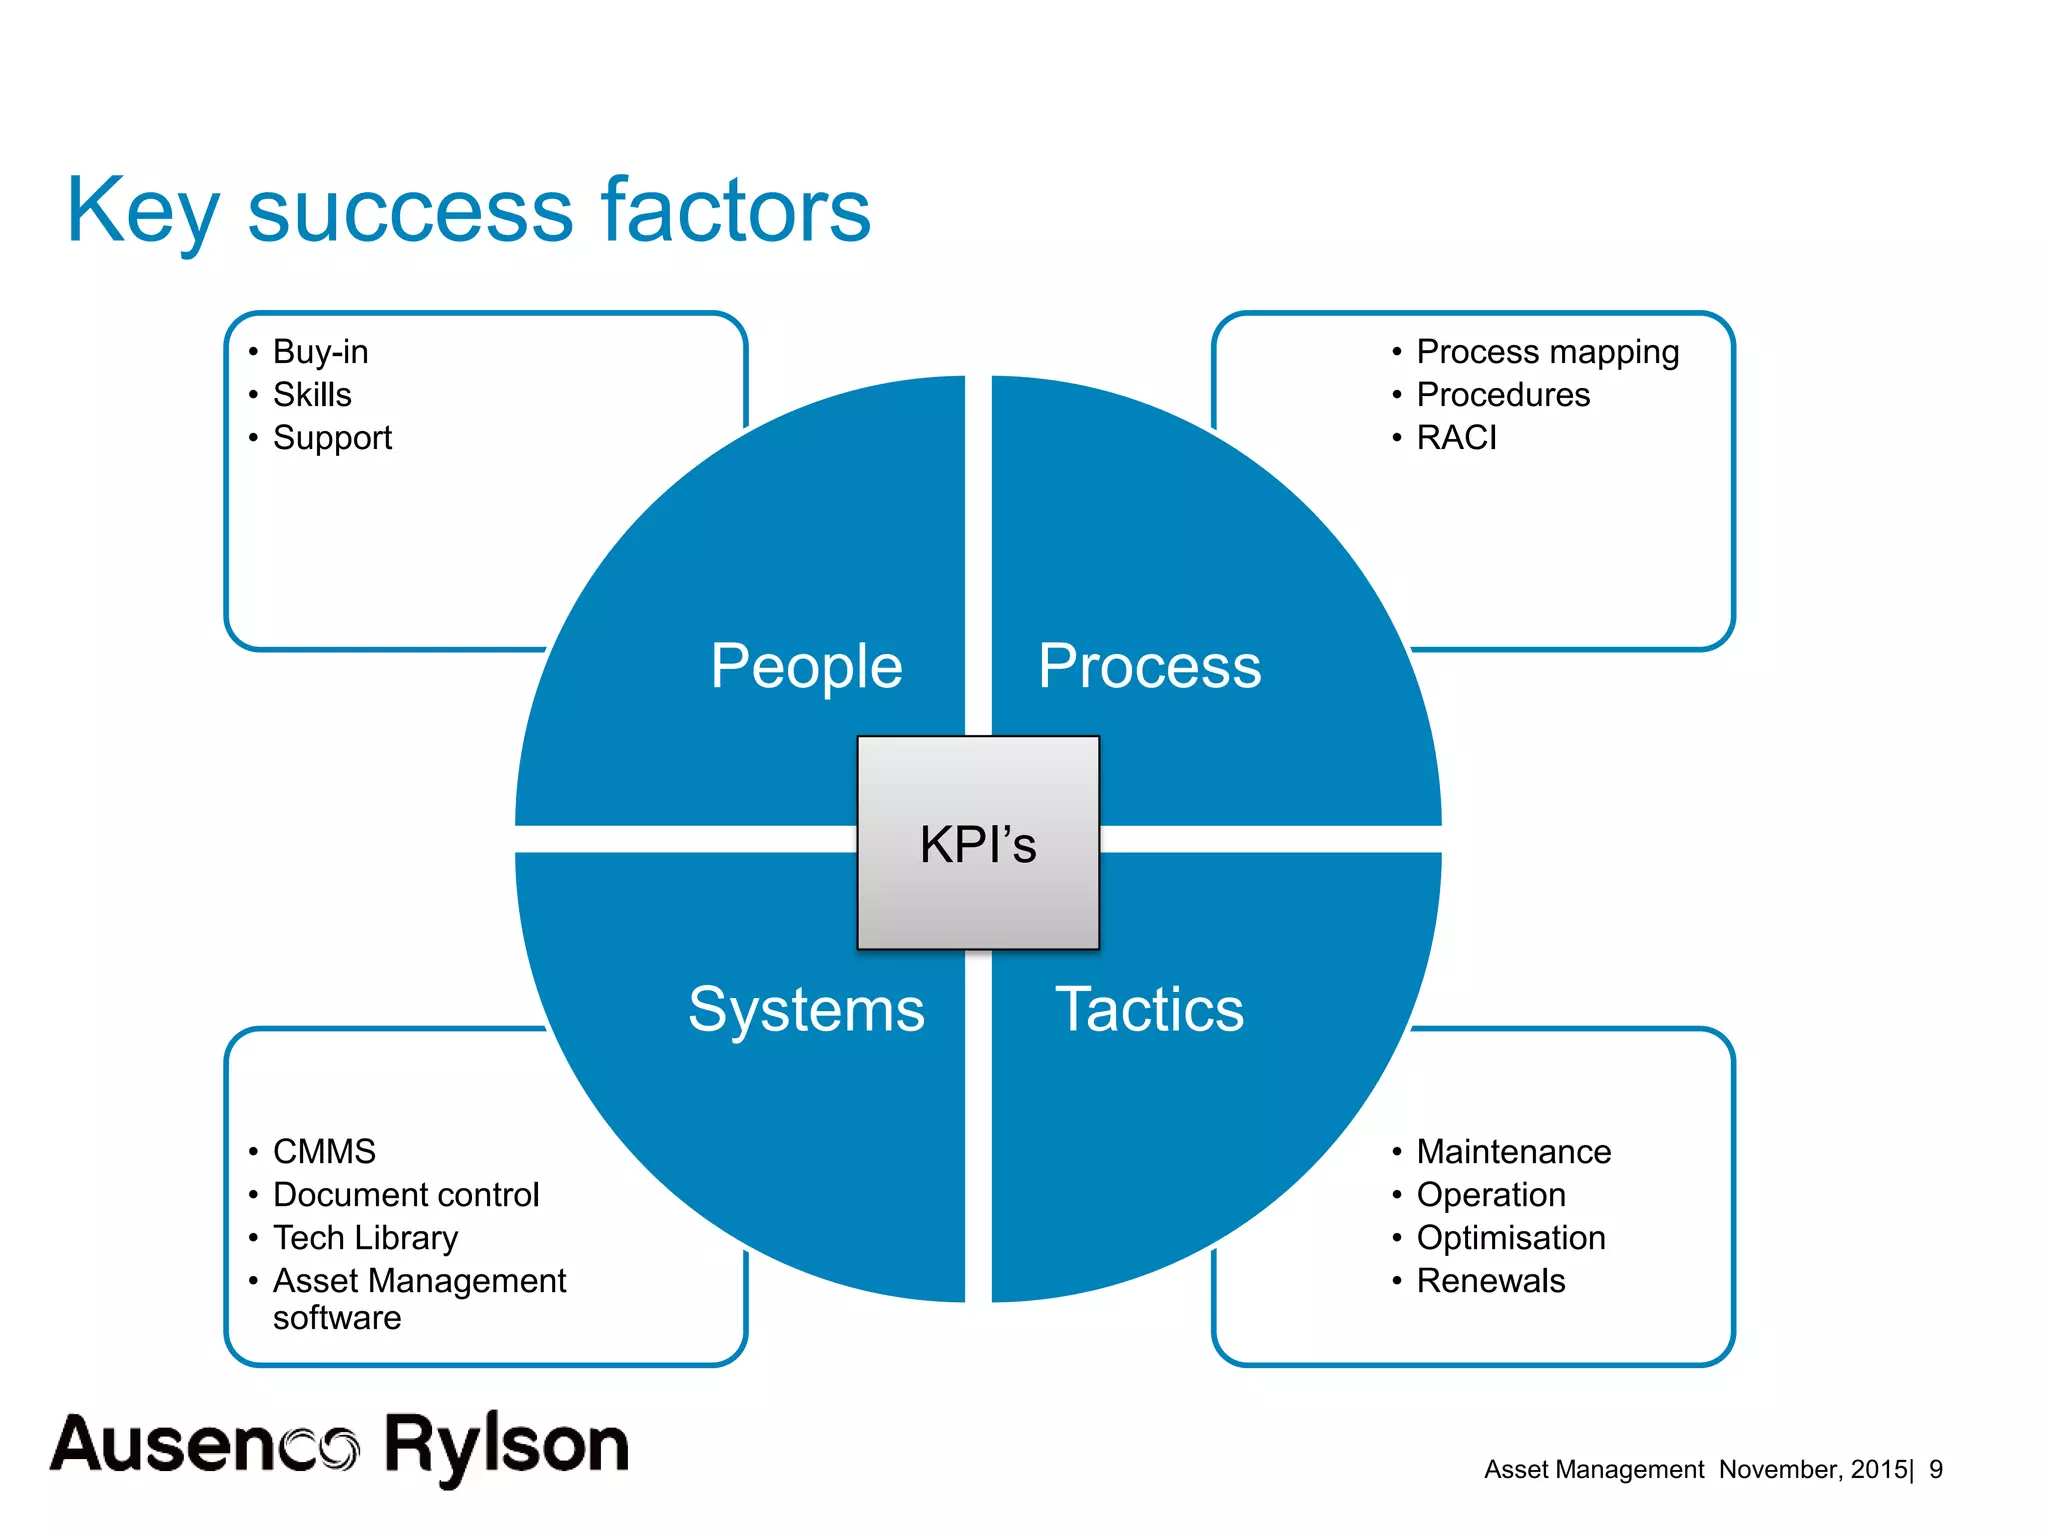
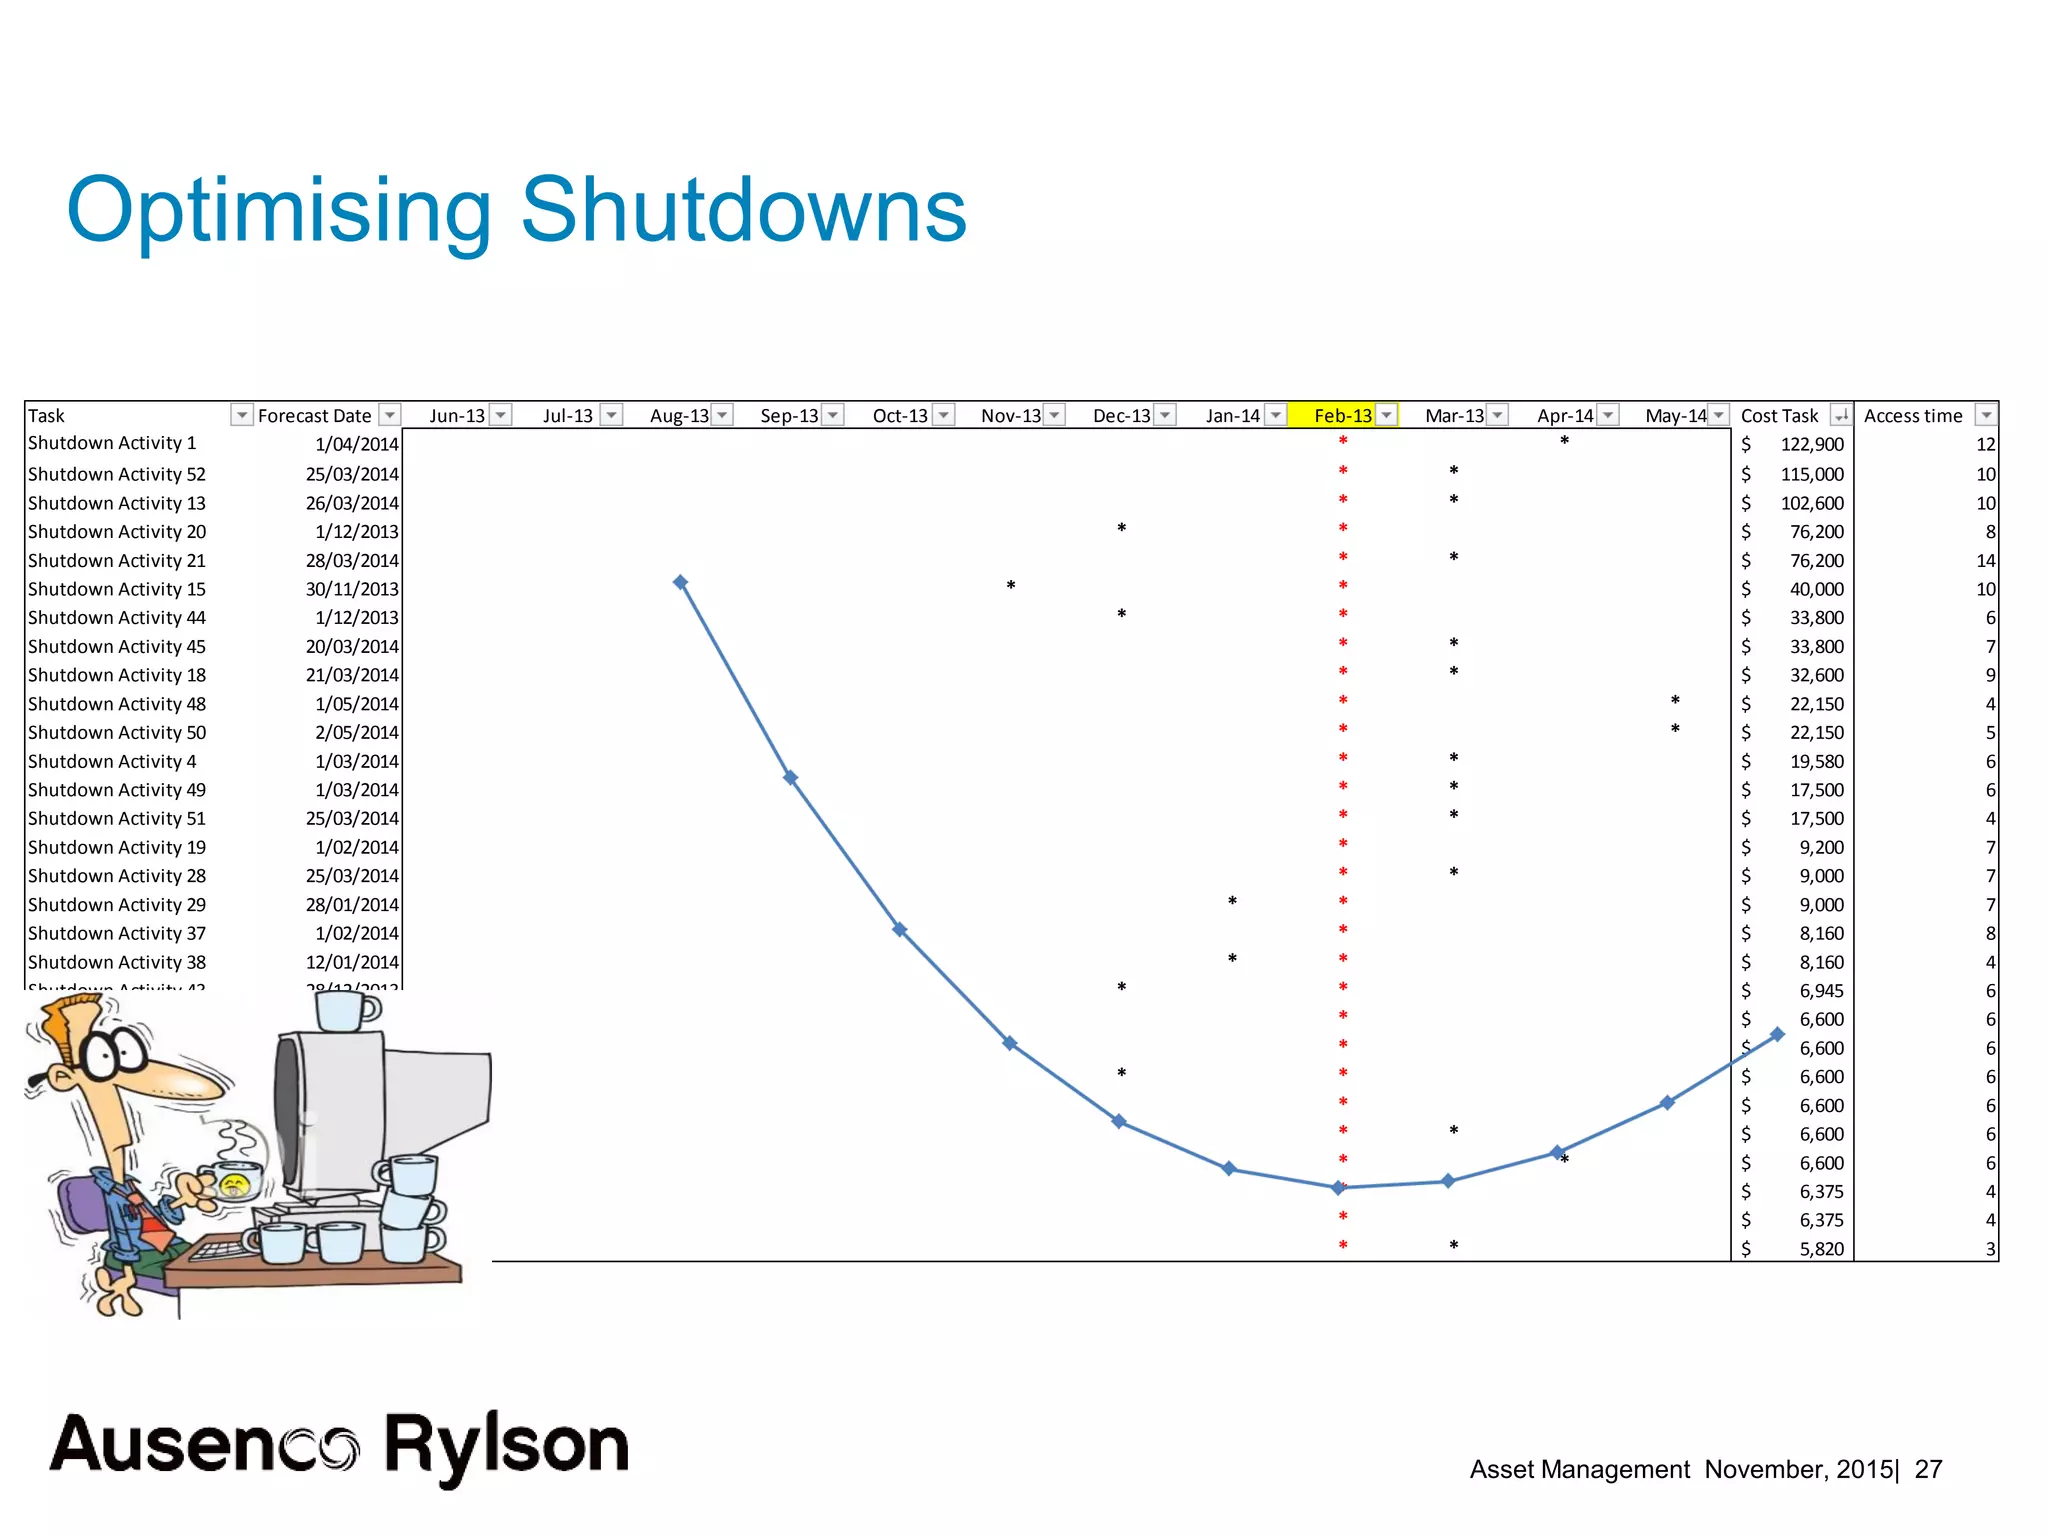
3. A successful strategy considers the organization holistically with buy-in from senior leadership and accountability at the corporate level, not just an isolated team. Condition monitoring, lifecycle analysis, and optimization of maintenance and shutdowns can improve outcomes.