Download as PDF, PPTX

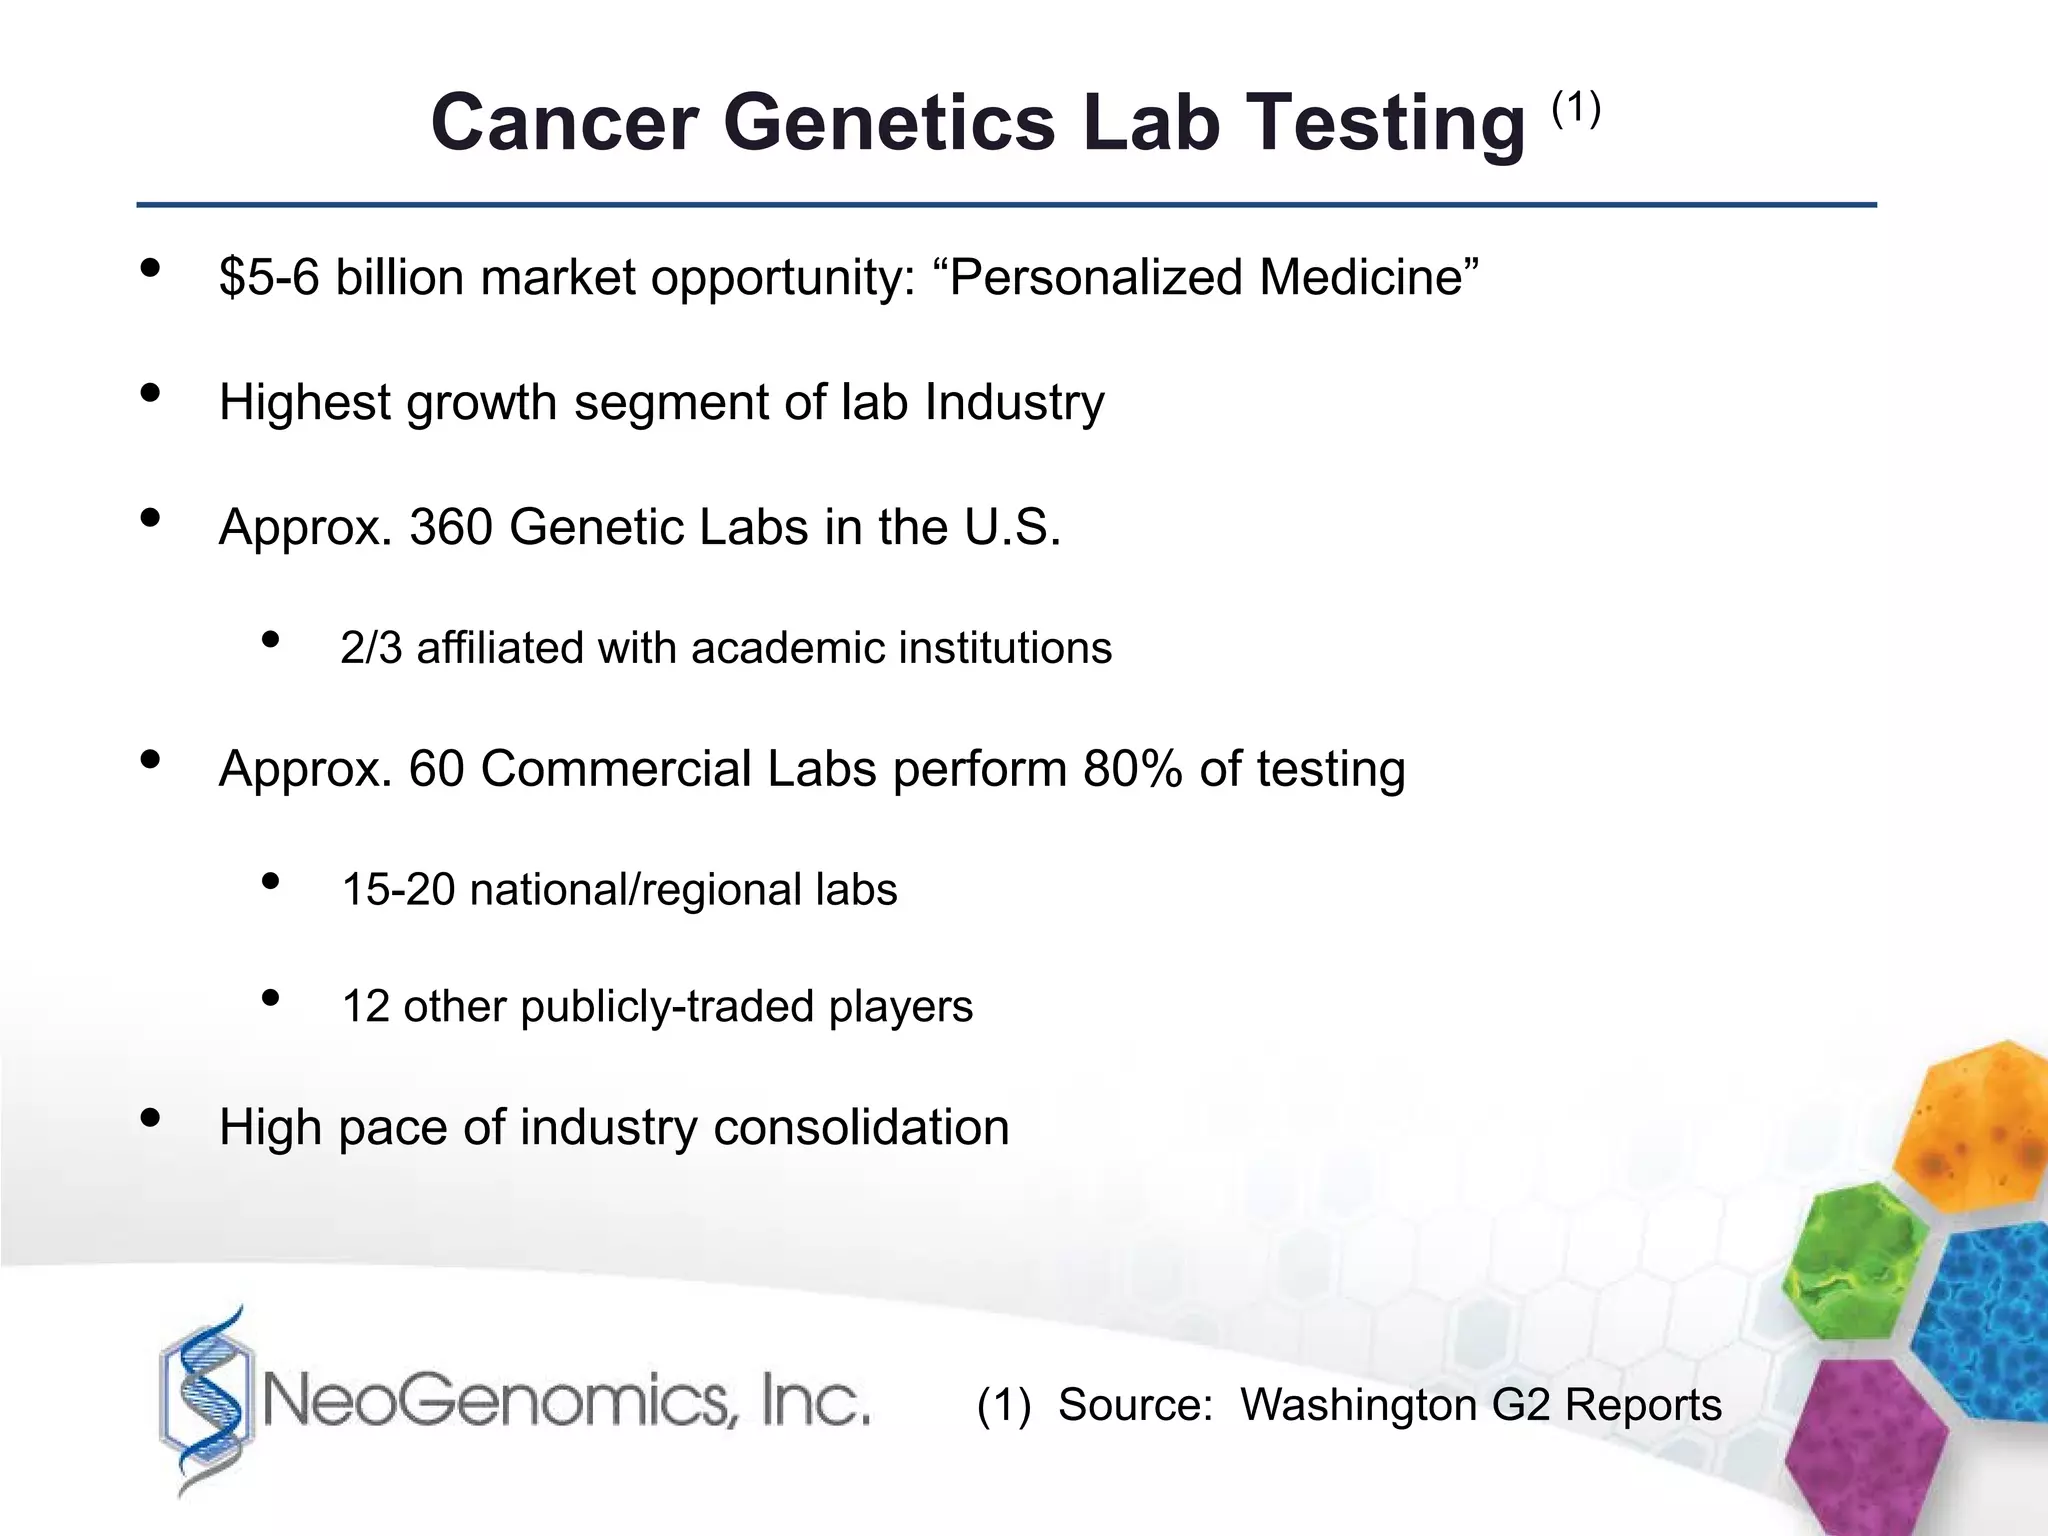
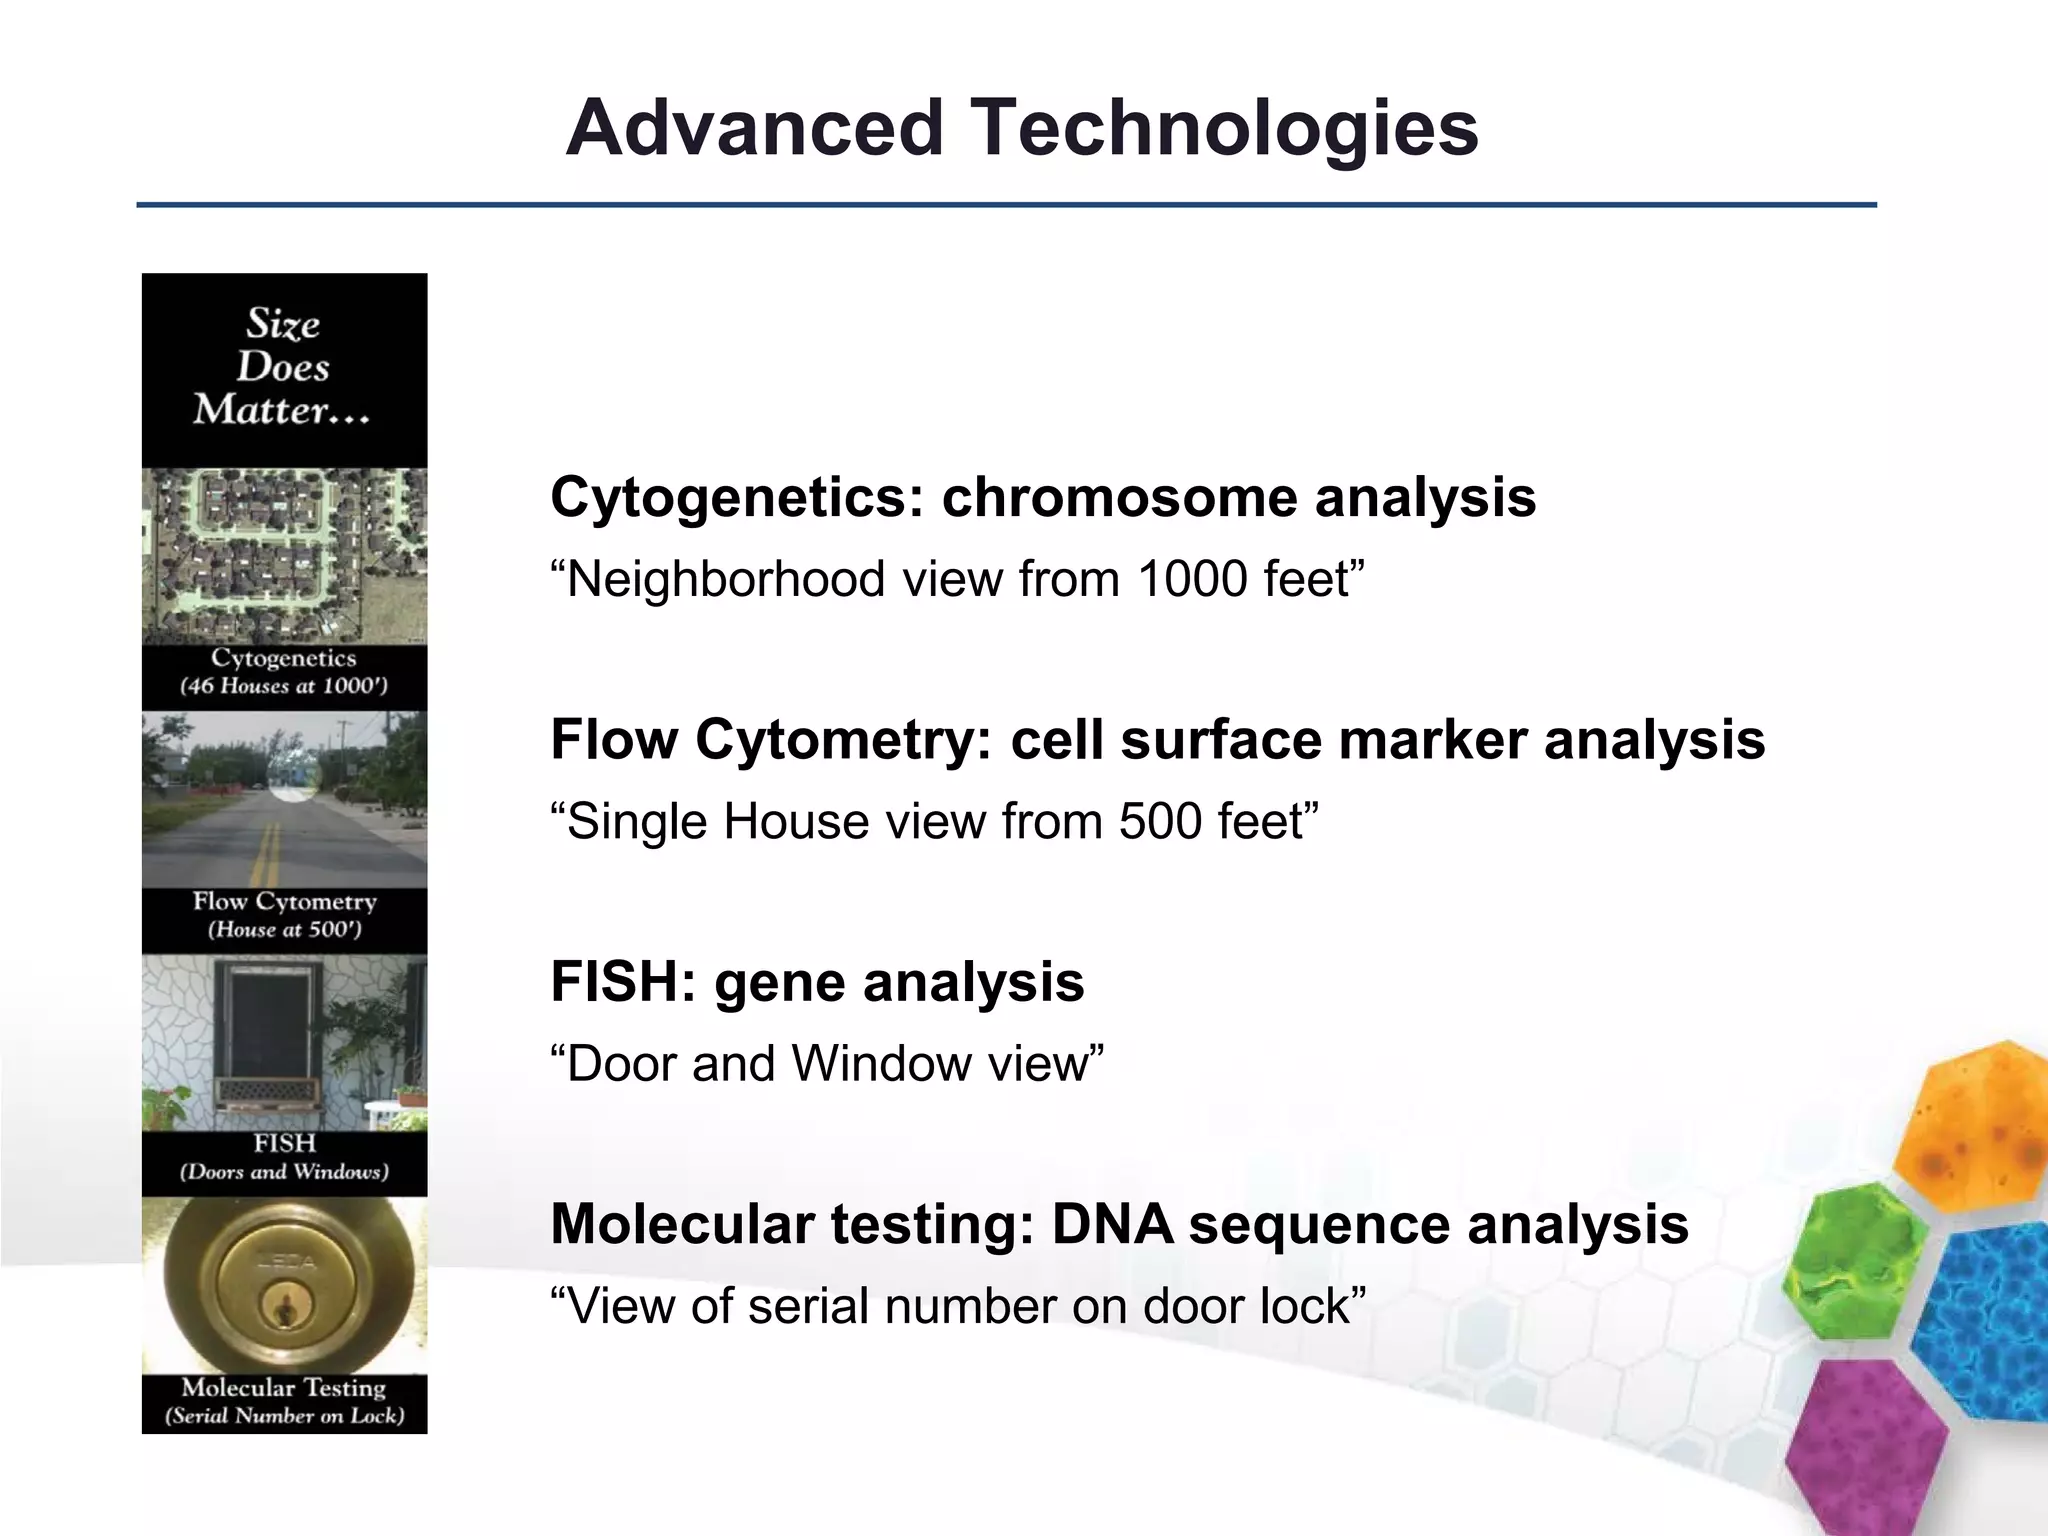
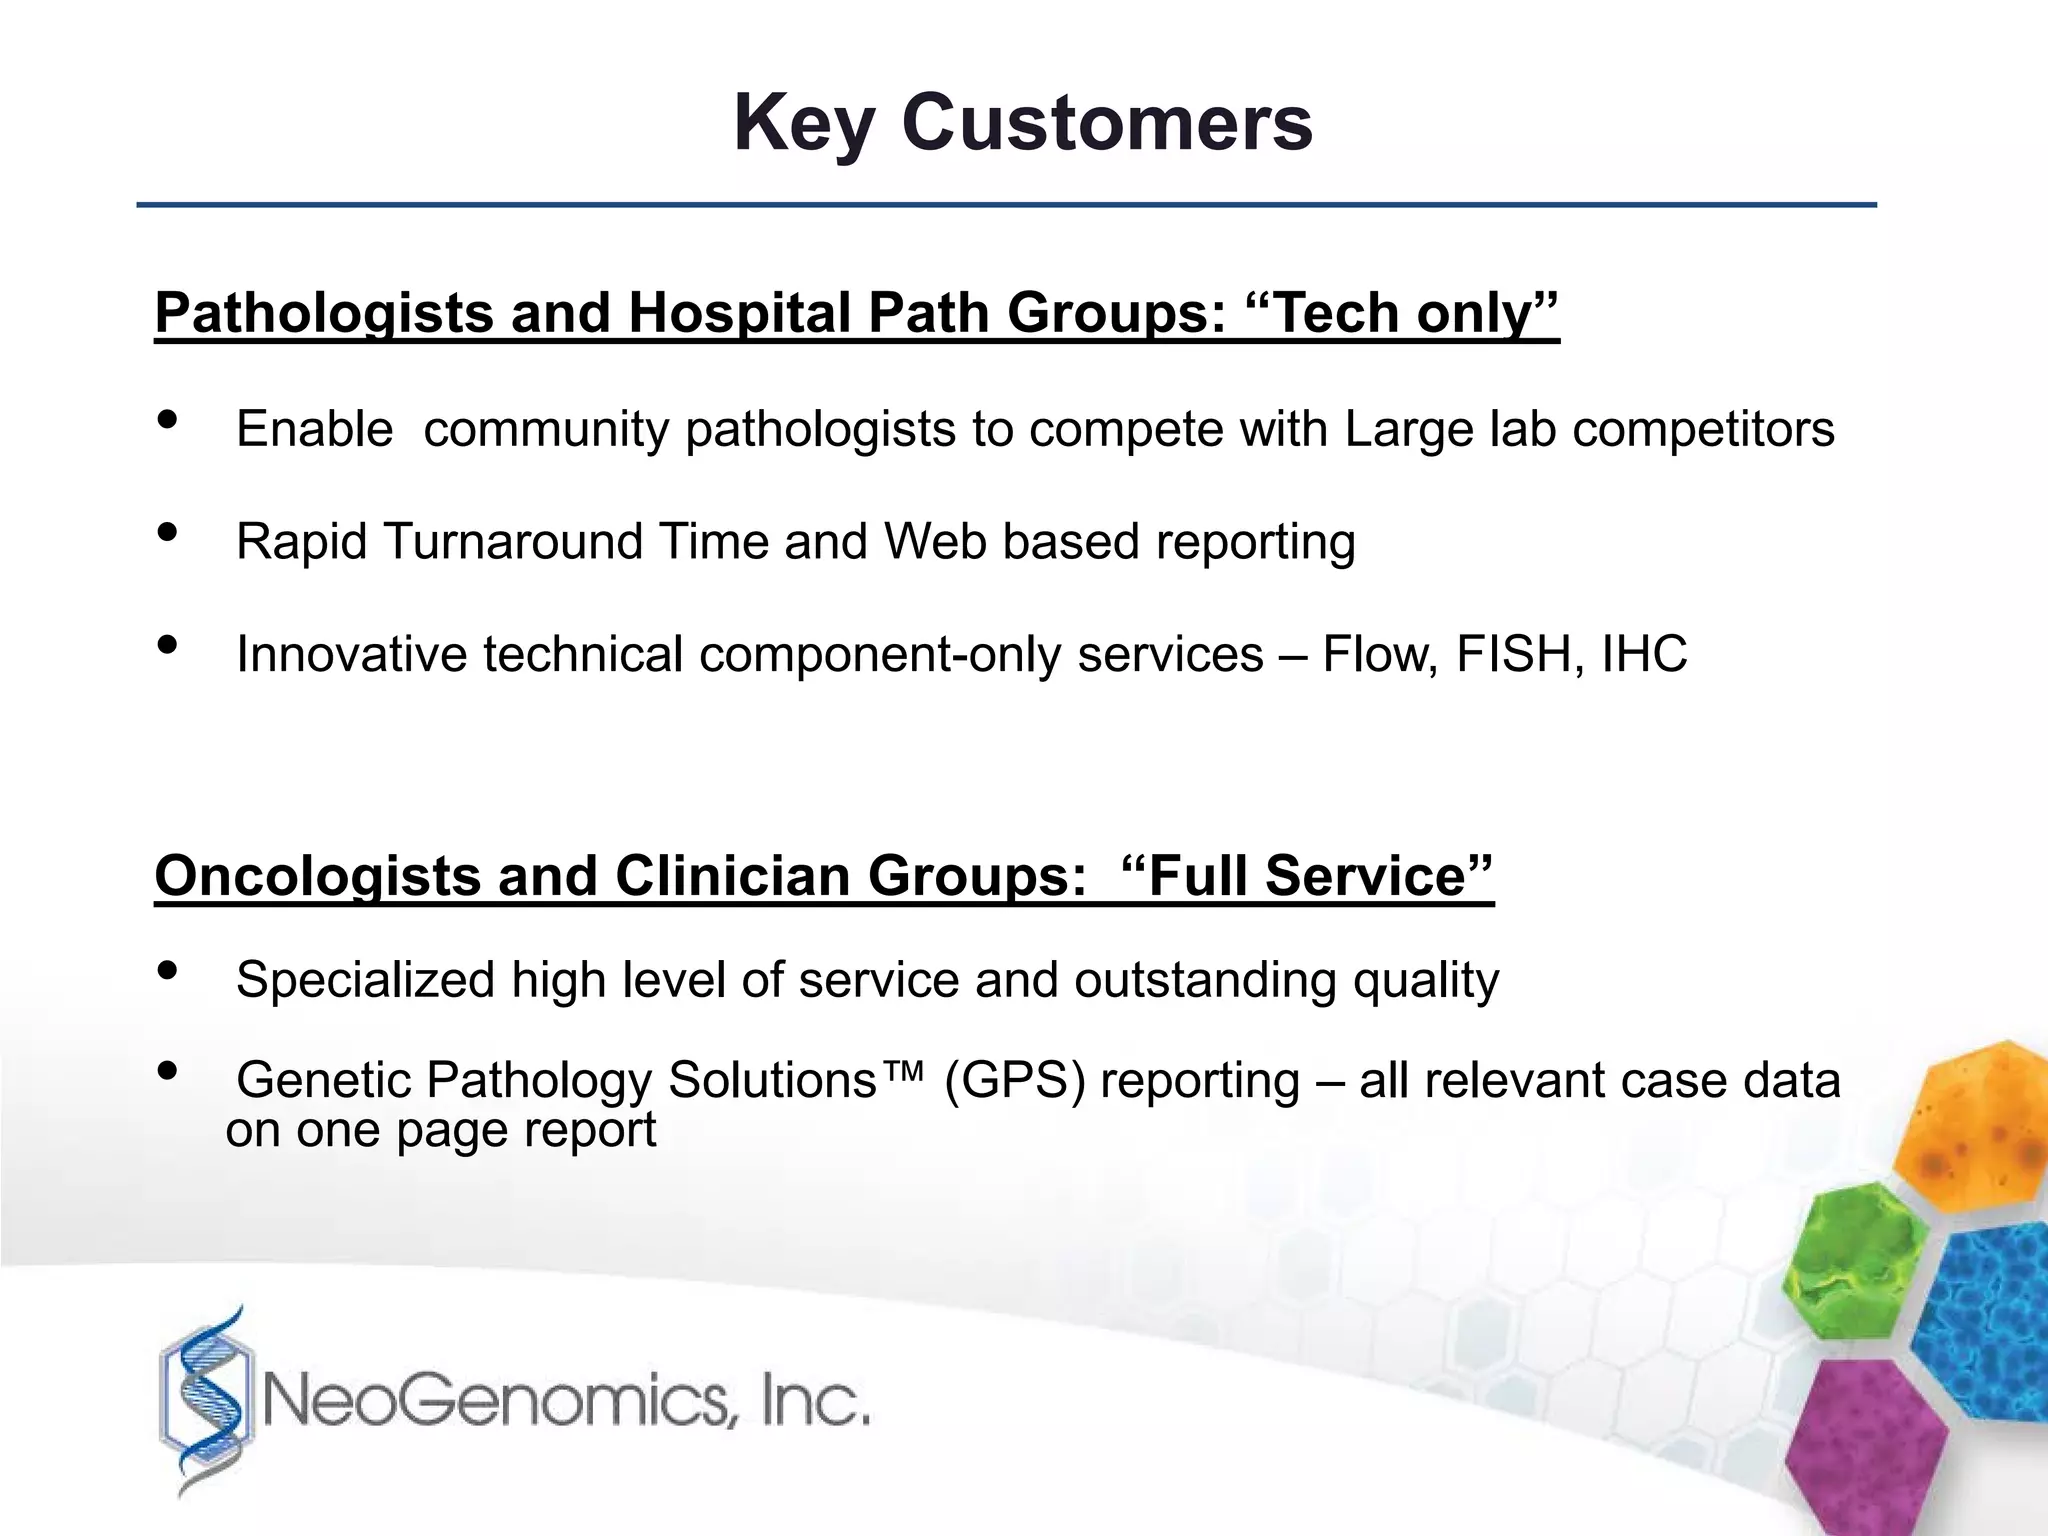
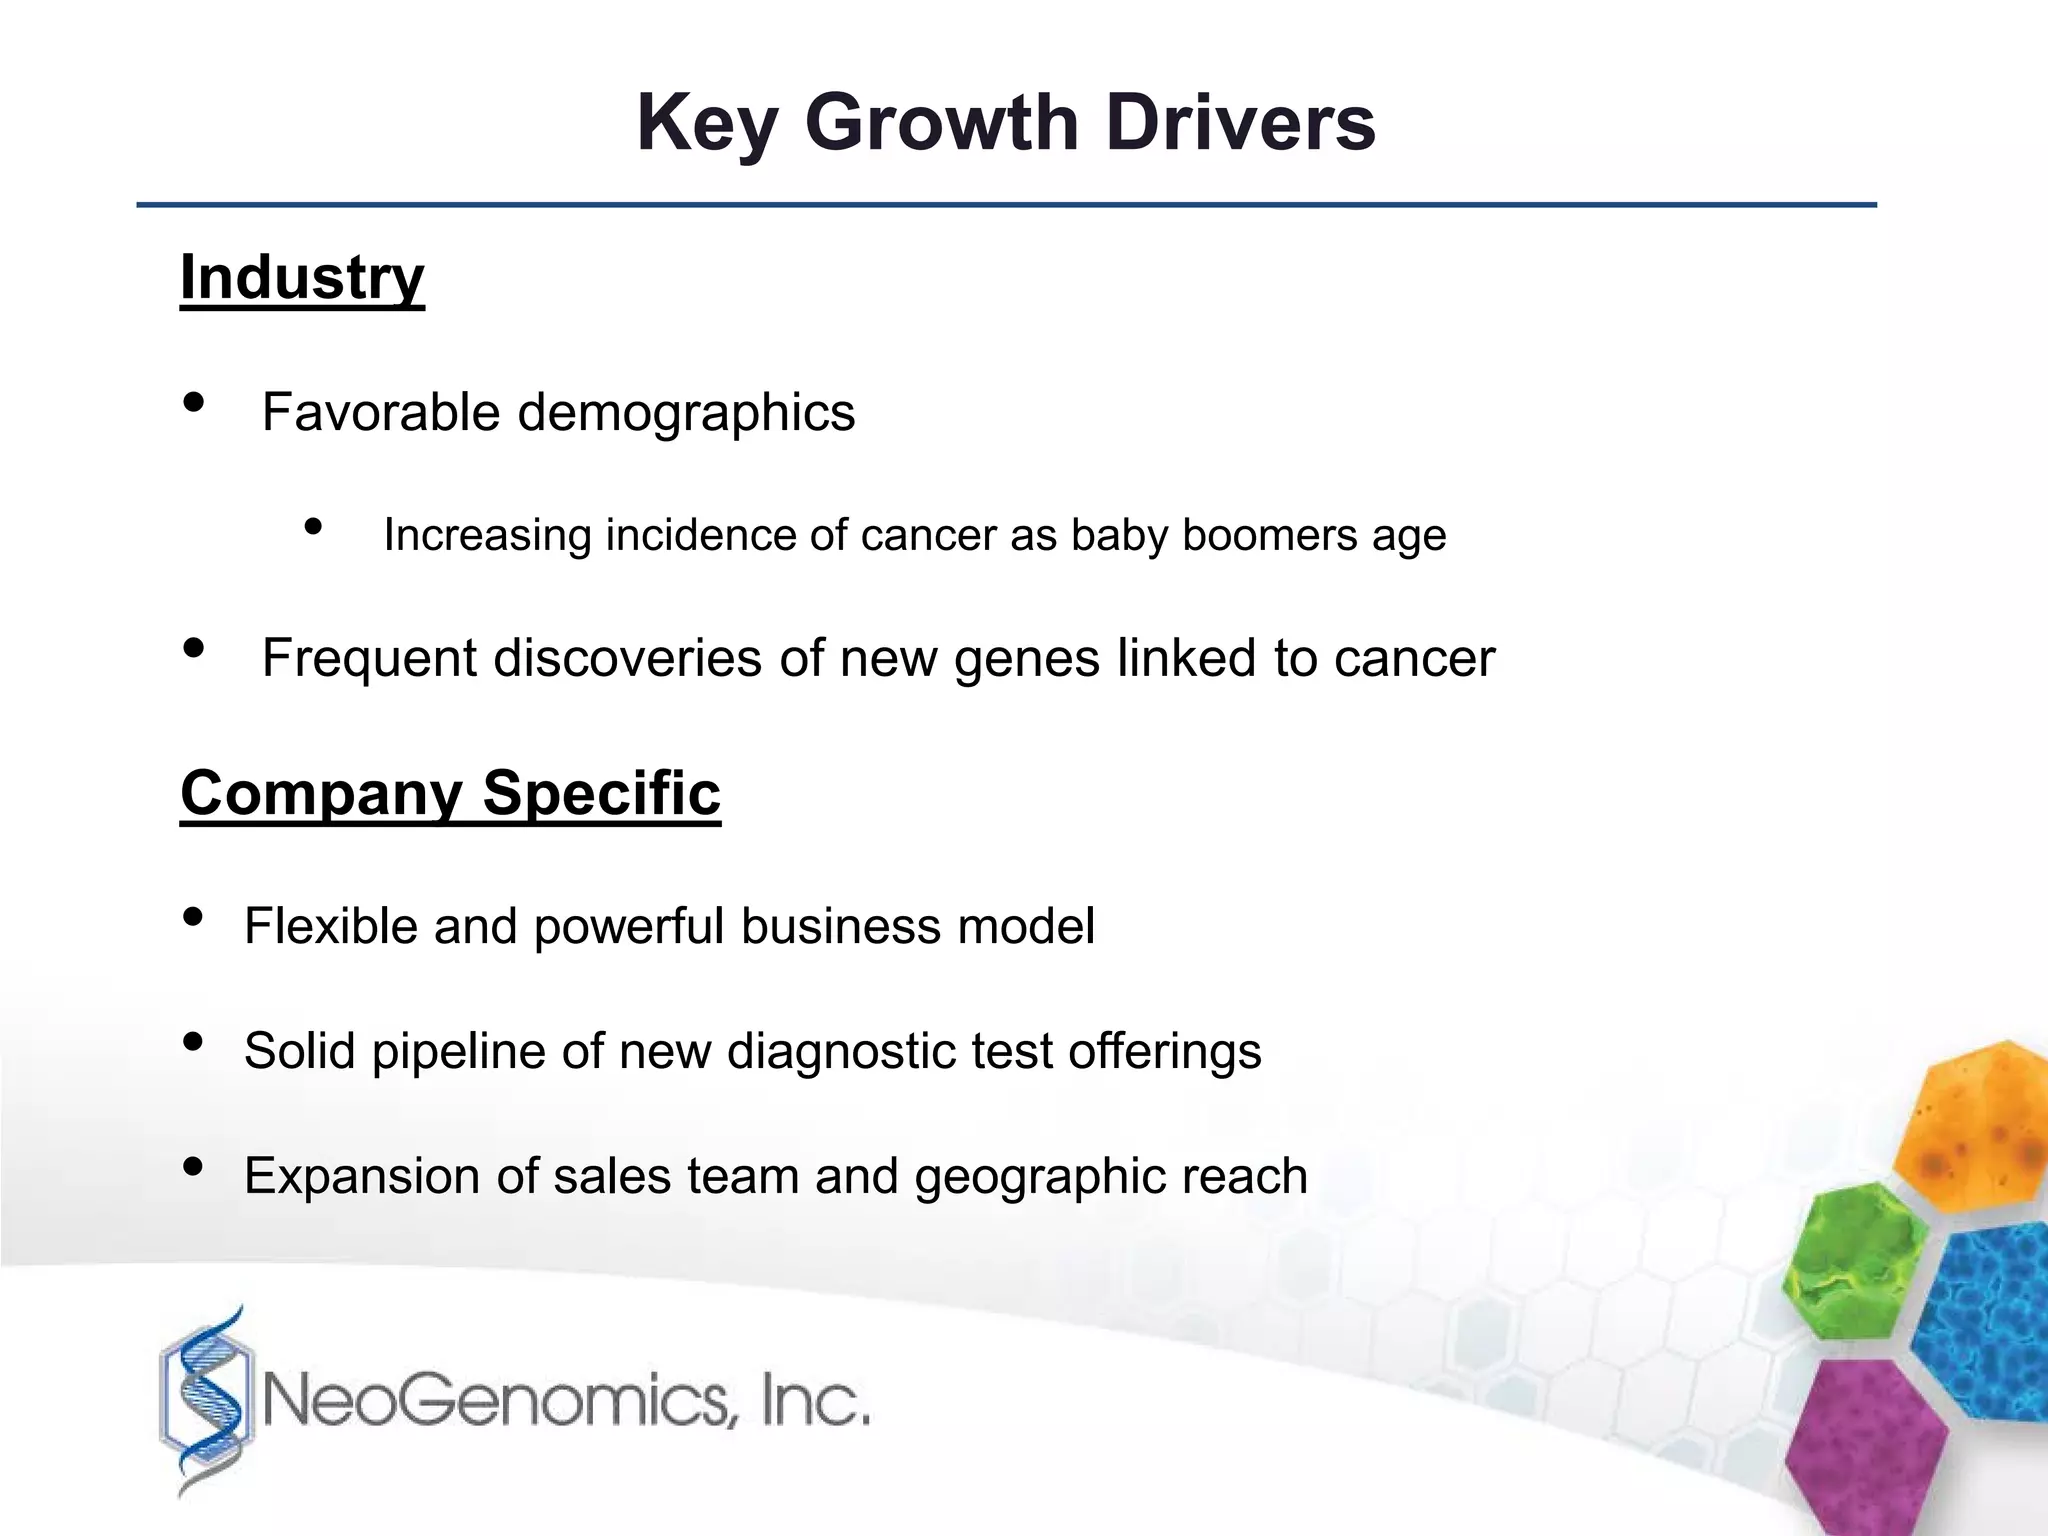


NeoGenomics is a pure play cancer genetics laboratory that provides diagnostic testing services to oncologists, pathologists, and hospitals throughout the US. The company utilizes advanced technologies like cytogenetics, flow cytometry, FISH, and molecular testing to analyze cancer samples. Key growth drivers include the aging US population which is increasing cancer incidence, and frequent discoveries linking new genes to cancer. NeoGenomics aims to accelerate its revenue growth and increase operating leverage through expanding its sales team, test offerings, and geographic reach.


