Download as PDF, PPTX
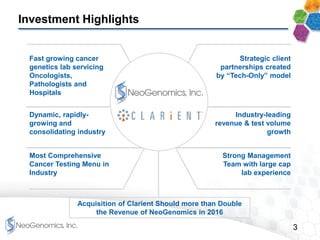
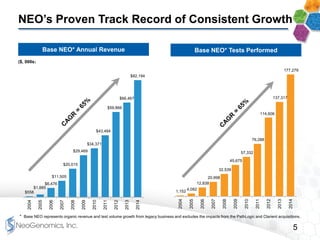


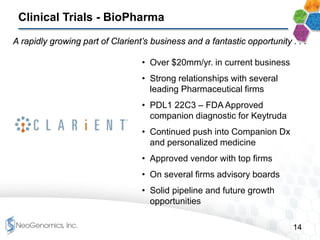
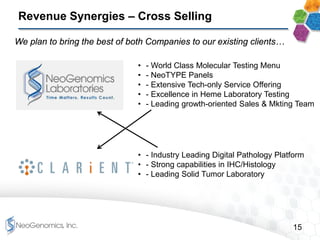
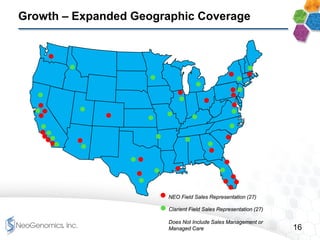
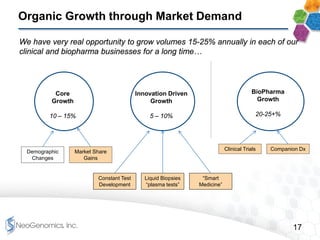
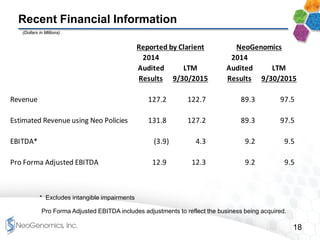
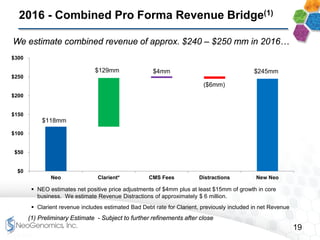
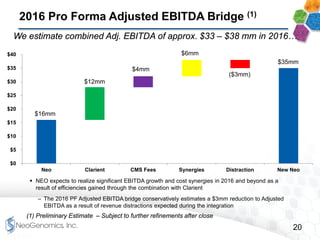


This presentation provides an overview of NeoGenomics' proposed acquisition of Clarient, which would more than double NeoGenomics' revenue. The strategic rationale is that the combined company would have greater scale and a more balanced oncology product portfolio, allowing it to be a lower-cost provider. It would also gain a larger clinical trials business and enhanced geographic coverage. Synergies of $20-30 million annually are projected from consolidating laboratories, purchasing, cross-selling and other areas. The acquisition supports NeoGenomics' strategy of using M&A to accelerate its vision of becoming a leading cancer testing and information company.


