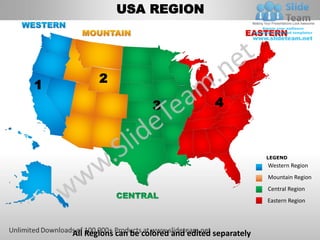
The document shows a map of the USA divided into 4 regions - Western, Mountain, Central, and Eastern. It includes a legend identifying the different colored regions. Additional details are provided allowing users to color and edit each region separately on the map.
Usa central region country editable powerpoint maps with states and counties ...SlideTeam.net
1) The document displays a map of the continental United States divided into four regions: Western, Mountain, Central, and Eastern.
2) The Central region includes the states of North Dakota, South Dakota, Nebraska, Kansas, Minnesota, Iowa, Missouri, Wisconsin, Illinois, Arkansas, Oklahoma, and Louisiana.
3) The map can be edited to color and label each individual region.
Usa eastern region country editable powerpoint maps with states and counties ...SlideTeam.net
The document displays a map of the Eastern United States region divided into states, with each state labeled. Below the map is a table that lists cities in the Eastern region, along with the sales representative and contact number assigned to each city. The map and table provide information about sales representatives and their contact information for cities within the Eastern United States region.
Usa mountain region country editable powerpoint maps with states and counties...SlideTeam.net
1) The document shows a map of the United States divided into four regions: Western, Mountain, Central, and Eastern.
2) The Mountain region includes the states of Montana, Idaho, Wyoming, Utah, Colorado, Arizona, and New Mexico.
3) Additional documents provide examples of how text or other elements can be added to the individual regions on the map.
Usa eastern region country editable powerpoint maps with states and countiesSlideTeam.net
The document contains a map of the Eastern United States divided into regions. It includes labels for each state and details on sales representatives and their contact numbers for cities within those states. Additional text can be added to the regions to describe key details. All regions on the map can be customized with colors and edits.
Usa central region country editable powerpoint maps with states and countiesSlideTeam.net
The document contains a map of the United States divided into four regions: Western, Mountain, Central, and Eastern. The Central region includes the states of North Dakota, South Dakota, Nebraska, Kansas, Minnesota, Iowa, Missouri, Wisconsin, Illinois, Oklahoma, and Arkansas. The map can be edited to color and modify each region separately.
Usa mountain region country editable powerpoint maps with states and countiesSlideTeam.net
The document provides a map of the United States divided into four regions: Western, Mountain, Central, and Eastern. It includes a legend identifying the regions and text indicating the regions can be edited separately. Additional slides provide more detailed maps of the Mountain region, with placeholders for text insertion.
This document provides guidelines and timelines for navigating partnerships with Microsoft. It discusses why partners should work with Microsoft at both the corporate and field level, including opportunities for joint selling, marketing, and leveraging Microsoft resources. It outlines Microsoft's field structure in the US and key players on Microsoft account teams. It also describes Microsoft's budget and sales cycles, how Microsoft sells products and compensates employees, and the process partners should follow for joint account planning, knowledge sharing, and setting expectations to strengthen partnerships.
Mary Takach, MPH, RN, Program Manager, NASHP moderates and discusses Medical Home Project at webinar New Tactics for Building Medical Homes in State Medicaid and CHIP Programs on December 16, 2010
Sandra Koch, MD discusses the impact of health care reform on the uninsured. The Affordable Care Act is estimated to reduce the number of uninsured women ages 19-64 from 20% to 8% when fully implemented. However, health care costs and access to providers will still be challenges as millions gain coverage. Electronic health records and data sharing aim to improve care coordination and lower costs but introducing technology brings privacy concerns. Overall the reforms seek to make health insurance and costs more transparent while shifting payment models to value health outcomes over procedures.
The document discusses Massachusetts' state fiscal conditions and budgets. It shows that the state faced a large budget gap in FY2009 that was addressed through spending cuts. The state also had preliminary budget gaps in FY2010 that were filled through additional cuts, withdrawals from savings funds, and new revenues. The document includes charts and graphs showing trends in state spending, revenues, taxes, and aid to education, higher education, municipalities, and other areas over time.
Usa rocky mountain region country editable powerpoint maps with states and co...SlideTeam.net
1. The document displays a map of the United States divided into 6 regions: Pacific, Rocky Mountain, Southwest, Midwest, Northeast, and Southeast.
2. Each region is represented by a different color and labeled on the map.
3. Additional details are provided in the legend about editing and customizing the regions.
NeoGenomics is a pure play cancer genetics laboratory that provides diagnostic testing services to oncologists, pathologists, and hospitals throughout the US. The company utilizes advanced technologies like cytogenetics, flow cytometry, FISH, and molecular testing to analyze cancer samples. Key growth drivers include the aging US population which is increasing cancer incidence, and frequent discoveries linking new genes to cancer. NeoGenomics aims to accelerate its revenue growth and increase operating leverage through expanding its sales team, test offerings, and geographic reach.
Medicaid Medical Homes Initiatives: Promising Practices to Inform 2703 SPAsNASHP HealthPolicy
This document summarizes Medicaid medical home initiatives across multiple states. It describes initiatives led by NASHP to inform state plan amendments for health homes under the Affordable Care Act. It provides details on how states define eligible populations, standards for provider infrastructure and payment methodologies. Key challenges for states include integrating care for dual eligibles, behavioral health, and long-term care. The document aims to share promising practices across states.
This document discusses the Centering Pregnancy model of group prenatal care. It defines the 13 essential elements of the Centering model and outlines some of the benefits seen from implementing this model, such as improved patient experience and birth outcomes. The document also discusses factors for successfully implementing and sustaining the Centering model, such as support from administration, dedicated space, and evaluation of outcomes. It provides an overview of the role of the March of Dimes in funding Centering Pregnancy sites in Virginia and the reporting requirements for sites that receive March of Dimes funding.
The document discusses the Center for Integrated Health Solutions, which provides training and technical assistance to promote integrated primary and behavioral health care. It aims to increase the number of individuals and organizations using integrated care approaches. The center works with SAMHSA and HRSA grantees and provides services like individual technical assistance, webinars, and toolkits to support the integration of physical and mental health care.
Editable map of the USA. High resolution design.
High-quality customizable map
Detailed border design
Can be edited, resized, customized and colored
Single slide
Usa country editable powerpoint maps with states and countiesSlideTeam.net
The document contains a map of the United States with all 50 states labeled. The map can be edited by coloring each state separately. Additional text promotes the ability to bring presentations to life and amaze audiences using customizable maps, slides, diagrams and templates from a website.
Este documento describe la litósfera, la capa externa sólida de la Tierra. Explica que la litósfera está compuesta de corteza continental y oceánica, y que hay dos tipos de litósfera - oceánica y continental. También describe las fuerzas internas como placas tectónicas que se mueven y causan terremotos y volcanes, y las fuerzas externas como la erosión que modifican la litósfera y forman el paisaje.
Este documento describe la hidrosfera, que se define como el conjunto de aguas que cubren parte de la superficie terrestre en forma líquida, sólida o gaseosa. Explica que el 71% de la superficie de la Tierra está cubierta por agua, principalmente en los océanos. También describe los diferentes tipos de aguas como ríos, mares, lagos y océanos, e indica la importancia vital del agua para los seres vivos.
El documento presenta un cuestionario sobre el uso de Internet en China. Pregunta sobre el porcentaje de la población con acceso a Internet, las horas semanales de uso, el porcentaje de usuarios urbanos, el género predominante, los usos más comunes y lugares de acceso, la red social más popular y cantidad de reglas básicas.
El documento describe los ríos más importantes del mundo. Señala que el Río Amazonas es el más largo con 6,800 km y el Río Nilo es el segundo más largo con 6,680 km. También menciona otros ríos notables como el Río Danubio en Europa y el Río Misisipi en Norteamérica.
El documento trata sobre las aguas en la naturaleza. Explica que el agua cubre el 71% de la superficie terrestre y que el 97% es agua salada en mares y océanos, mientras que el 3% restante son aguas continentales dulces en ríos, lagos y subterráneas. Describe también el ciclo del agua y características de ríos, corrientes marinas, mareas, lagos y aguas subterráneas.
Inventos menos conocidos de Leonardo da Vinci, Luis VelasquezLuis Velasquez
Leonardo Da Vinci fue es sin duda alguna la persona más polifacética de la historia. A pesar de que fue famoso en todo el mundo por sus pinturas y algunos inventos, no todos son conocidos.
This document contains plans and details for the pitched roof structure of a restaurant project located in Ajmer, India. The front elevation drawing shows the principal rafters, purlins, gutters, king post, struts, and tie beams that make up the pitched roof carcass. An isometric view further illustrates the roof framing. Additional information provided includes the land and covered areas, scale, legend, ceiling schedule, and a note about the iron frame carcass dimensions to be determined by civil engineers.
Los ríos más contaminados del mundo incluyen el Salween, Danubio, La Plata, Bravo, Ganges, Indo, Nilo, Yangtze, Murray Darling y Mekoong. Más de la mitad de los 500 ríos principales del mundo están altamente contaminados y los principales proveedores de agua del mundo están en riesgo.
La población española ha experimentado un crecimiento lento hasta 1900, un rápido crecimiento entre 1900 y 1980 debido a la disminución de la mortalidad, y un lento crecimiento entre 1980 y 2001 debido a la reducción de la natalidad. Desde 2001, el crecimiento ha sido mayor debido a los inmigrantes. La población se distribuye de manera desigual, concentrada principalmente en Madrid, la periferia, Baleares y Canarias, mientras que el interior peninsular está más despoblado.
This document lists several famous American landmarks and provides brief descriptions of each one. It describes the locations and key features of the Statue of Liberty, Mount Rushmore, the Golden Gate Bridge, the Empire State Building, the US Capitol, the Gateway Arch, the Alamo, the Grand Canyon, and the Space Needle.
El documento presenta biografías breves de importantes inventores e investigadores como Ampère, Einstein, Edison, Ohm, Curie, Bell, Tesla, Faraday, Volta, Marconi y Morse. Describe sus principales logros e inventos, como el magnetismo, la teoría de la relatividad, la bombilla, la ley de Ohm, la radiactividad, el teléfono, la radio, la pila eléctrica, la telegrafía sin hilos y el telégrafo.
La litosfera es la capa externa de la Tierra compuesta de rocas. El documento presenta un breve resumen de la litosfera y fue escrito por Alfonso Cuevas Mantecón.
La litosfera se encuentra fragmentada en placas tectónicas que se mueven continuamente. Está compuesta por la corteza terrestre y la capa más externa del manto, y flota sobre la astenosfera. En los bordes de las placas se concentran fenómenos geológicos como volcanes y terremotos.
La Cordillera de los Andes determina la variedad de accidentes geográficos en Perú, incluyendo cerros, lomas, montañas, nevados, volcanes, valles, mesetas, desiertos, dunas y depresiones. Algunos ejemplos notables son el Nevado Huascarán, el Volcán Misti, el Valle de Huaura y el Desierto de Sechura.
El documento describe la dinámica de las aguas oceánicas y su importancia. Las aguas oceánicas presentan movimientos como las mareas, olas, corrientes marinas y tsunamis debido a factores como la rotación de la Tierra, la gravedad lunar y solar, y el viento. Estos movimientos influyen en la distribución de climas y recursos marítimos. Además, la dinámica de las aguas oceánicas es importante para la navegación, los cambios climáticos y los us
La Tierra está formada por capas concéntricas: la litosfera (corteza), mesosfera (manto) y núcleo. La litosfera está compuesta de rocas y minerales y se divide en suelos de acuerdo a su composición, como suelos arcillosos, arenosos y orgánicos. La erosión del suelo por agua y viento reduce su fertilidad, por lo que es importante la reforestación y uso controlado de fertilizantes y plaguicidas para conservar los suelos.
El documento presenta el contexto histórico, político, social y cultural de la independencia del Perú. Resume las principales revoluciones que llevaron a la independencia, como la Revolución Francesa y la Revolución Americana. También describe la sociedad científica "Amantes del País" y su contribución al periódico "Mercurio Peruano". Explica que José de la Riva Agüero fue el primer presidente del Perú en 1823 tras la independencia declarada por San Martín. Finalmente, resume las 28 causas de la Revolución
Este documento describe los grandes conjuntos bioclimáticos de la Tierra, los cuales se diferencian por la temperatura y precipitación. Se mencionan las zonas templadas, frías y cálidas. También se hace referencia a bioclimas mediterráneos y de montaña, y cómo la acción humana puede afectar los espacios naturales y originar riesgos.
This document provides information about each US state in 3 sentences or less summaries. It begins with Washington state, known for Starbucks, Microsoft, and apples. It then summarizes each state alphabetically, highlighting famous places, history, or attractions for each one. The summaries are concise, highlighting the most essential details about each state.
This document maps out each U.S. state's response and stance regarding key aspects of the Affordable Care Act, also known as Obamacare, including whether they have decided to expand Medicaid, who will run their health insurance exchange, and whether they are plaintiffs in any lawsuits against the law. The maps show that 25 states have decided to expand Medicaid, 20 have not, and 6 are uncertain. 18 states will run their own exchange, 7 as a state-federal partnership, and 26 will default to the federal exchange. 27 states in total are involved in lawsuits against Obamacare.
This document provides information on vaccination exemptions allowed by state. It shows that most states allow medical exemptions for vaccines, some allow religious exemptions, and only a handful (such as California, West Virginia and Mississippi) do not allow philosophical or personal belief exemptions for school-required vaccinations.
The document outlines the different time zones in the United States. It provides a map showing the six main time zones: Pacific, Mountain, Central, Eastern, Alaska, and Hawaii. Tables show the hour differences between the US time zones and Seoul, South Korea during standard time and daylight saving time. Notes provide additional details about time zone treatment in Arizona, states split between two zones, and differences within Alaska.
Usa rocky mountain region country editable powerpoint maps with states and co...SlideTeam.net
The document depicts a map of the United States divided into 6 regions: Pacific, Rocky Mountain, Southwest, Midwest, Northeast, and Southeast. Each region is designated by a number and color. The map can be edited to change the colors of each individual region.
Usa northeast region country editable powerpoint maps with states and countie...SlideTeam.net
The document is a map of the United States divided into regions. It shows 6 main regions across the country which can each be edited separately. The legend indicates the different regions are the Pacific, Rocky Mountain, Southwest, Midwest, Northeast and Southeast regions.
Usa south west region country editable powerpoint maps with states and counti...SlideTeam.net
The document contains a map of the United States divided into 6 regions. It provides details on how to edit individual regions, including changing colors, sizes, and inserting text boxes to add labels or names. Key capabilities include ungrouping objects to edit colors, using the format tab to adjust sizes, and inserting text boxes to add identifying information to the map regions.
Usa pacific region country editable powerpoint maps with states and counties ...SlideTeam.net
The document provides a map of the United States divided into 6 regions. Each region is numbered and labeled. Additional details are provided on how to edit the map including changing colors, sizes, and inserting text boxes with names. The key highlights are that the US is divided into 6 numbered regions on the map, and instructions are given on customizing the map by editing colors, sizes, and inserting text.
Usa midwest region country editable powerpoint maps with states and counties ...SlideTeam.net
The document shows a map of the United States divided into 6 regions: Pacific, Rocky Mountain, Southwest, Midwest, Northeast, and Southeast. The Midwest region includes Minnesota, Wisconsin, Iowa, Missouri, Illinois, Indiana, Ohio, and Kentucky.
bStable - Depression and Bipolar Disorder Disease State Management System - P...McGraw Systems LLC
bStable is the only comprehensive personal health record system for patients diagnosed with affective disorders such as Depression and/or Bipolar Disorder, their loved ones, psychiatrists, and psychologists to manage the patient's disease state. Using this patent pending technology, patients and the individuals in the patient's support team use bStable together to collect and analyze data from various angles of the patient's life for optimal patient - clinican communication and as a crisis prevention solution.
In addition to powerful patient monitoring features, bStable includes support for psychotherapeutic approaches such as cognitive behavioral therapy (CBT) and other affective disorders such as: attention deficit hyperactivity disorder (ADHD), social phobia disorder, anxiety disorder, and premenstrual dysphoric disorder. bStable also has support for Chronic Fatigue Syndrome (CFS) monitoring.
Usa pacific region country editable powerpoint maps with states and countiesSlideTeam.net
The document shows a map of the United States divided into 6 regions. The Pacific Region includes Alaska, Washington, Oregon and Hawaii. All regions on the map can be individually colored and edited.
Usa south region country editable powerpoint maps with states and countiesSlideTeam.net
The document displays a map of the United States divided into 6 regions. The South region includes Tennessee, South Carolina, Alabama, Georgia, Mississippi, Louisiana and Florida. Text boxes can be added to provide additional information for each region. All regions and elements on the map can be customized and edited separately in PowerPoint.
Usa south west region country editable powerpoint maps with states and countiesSlideTeam.net
Here are the steps to insert names using text boxes:
1. Select the "Insert" tab and click the "Text Box" button.
2. Click on the map where you want to place the text box and start typing the name.
3. Repeat step 2 for each name you want to add to the map.
4. Format the text boxes and names as needed, such as changing the font size or style.
Usa midwest region country editable powerpoint maps with states and countiesSlideTeam.net
The document displays a map of the United States divided into 6 regions: Pacific, Rocky Mountain, Southwest, Midwest, Northeast, and Southeast. The Midwest region includes 6 states: Minnesota, North Dakota, South Dakota, Nebraska, Iowa, and parts of Wisconsin, Michigan, Illinois, Indiana, Ohio, and Missouri. Additional text prompts the user to add their own text summary and notes to the customizable Midwest region map slide.
This document summarizes hepatitis C treatment and hepatitis A and B vaccine coverage on AIDS Drug Assistance Programs (ADAP) formularies in June 2007. Twenty-two ADAPs covered hepatitis C treatment while 31 did not. Twenty-eight ADAPs covered hepatitis A and B vaccines while 25 did not. The document also notes that some states refer clients to free treatment slots for hepatitis C.
The Functional Art: Design and Infographics | Journalism Interactive Conferen...Journalism Interactive
PRESENTER: Alberto Cairo (@albertocairo), Instructor, University of Miami.
DESCRIPTION: Too many journalists still relate the word "design" to making pages and websites look prettier. As a consequence, they think that the main goal of an infographic is to be eye-catching, engaging, and fun. They argue that infographics are means to "simplify" data that only specialized professionals are capable of creating. This presentation will debunk all these myths and propose an alternative view of infographics and visualizations as means to make messages richer, deeper, and more effective.
This document summarizes the work of Sherilyn Pruitt at the Office for the Advancement of Telehealth within the Health Resources and Services Administration. It discusses the office's role in advocating for rural health issues within HHS, conducting research and policy development on rural health topics, and administering grant programs to expand telehealth access. These programs include licensure portability grants, telehealth network grants, telehealth resource centers, and grants to expand rural veterans' healthcare access through telehealth.
Dealing With Payers With Physician Driven Cost AndWilliam Cockrell
The document provides Medicare cost and discharge data for 17 physicians treating patients with a principal diagnosis of coronary atherosclerosis of the native coronary artery. It includes average length of stay, case mix index, volume of patients, average payment per patient, total actual payment, and discharge disposition breakdown for each physician. Payment amounts ranged from $4,312 to $165,517 across physicians, with most patients being discharged home or to home health.
The American Society of Addiction Medicine (ASAM) aims to improve addiction treatment access and quality. Its mission is to educate providers, support research/prevention, and promote physicians' role in addiction care while establishing addiction medicine as a specialty. ASAM's members are primarily psychiatrists and those in addiction/family medicine. It communicates with members through a weekly newsletter and advocates on insurance/policy issues at state/local levels.
This document is from CBRE's Economic Incentives Group and ranks states based on their overall incentives competitiveness in 2013. It shows a map of the United States color-coded to indicate states that are aggressive, competitive, or not competitive in offering economic incentives like tax credits, payroll rebates, and grants. Other cost factors should also be considered when evaluating the total cost of doing business in a state. Contact information is provided for additional details.
Similar to Usa western region country editable powerpoint maps with states and counties templates (20)
Business powerpoint presentations process diagram six decisions cycle flow ch...SlideTeam.net
The document describes how to edit and customize a business process diagram template in PowerPoint. It includes 6 steps represented by diverging arrows. At each step, text or images can be added and modified. All images are fully editable in terms of color, size, orientation, and other properties using the formatting and drawing tools in PowerPoint. This allows the template to be customized while maintaining a consistent visual structure.
Powerpoint presentations process management solution cycle flow network templ...SlideTeam.net
The document describes a 7 step converging arrows business process management solution. It includes 7 steps represented by arrows that converge on a central text box. All images are 100% editable in PowerPoint and allow the user to change color, size, orientation or any icon to their liking. The document also provides instructions on how to ungroup objects and edit their color using theme colors or by selecting fill and solid options.
Group of nine coverging arrows circular layout process power point slidesSlideTeam.net
The document describes how to edit a group of nine converging arrows diagram in PowerPoint. It includes instructions on ungrouping the object, editing the color, and editing the color by theme colors. The diagram can be customized by changing the color, size, and orientation of any icon. All images are fully editable in PowerPoint.
Four leading reason for cause cycle process diagram power point slidesSlideTeam.net
The document discusses editing images in PowerPoint. It provides instructions on how to ungroup objects, edit colors, and change colors using theme colors. The key steps are to right click objects to ungroup or access formatting options, select fill and color options to change the appearance, and choose from built-in theme colors.
To good world business powerpoint templates ideas processs andSlideTeam.net
The document contains instructions for editing business diagram images in PowerPoint. It explains how to ungroup objects, edit colors, and change colors using built-in theme colors. The purpose is to allow users to customize diagram images for business presentations.
Three converging arrows managing process layout cycle network power point slidesSlideTeam.net
The document describes how to edit icons in a PowerPoint presentation. It provides instructions on ungrouping objects, changing colors, and using theme colors. The steps include right clicking objects, choosing format options, and selecting fill and color options. The overall purpose is to demonstrate how to customize icons and make images fully editable.
Six coverging arrows for process to carried out charts and power point slidesSlideTeam.net
The document describes how to edit a diagram template with six converging arrows. Key points:
- The template can be used to bring presentations to life and capture audiences' attention.
- All images are 100% editable in PowerPoint, allowing the user to change color, size, and orientation of any icon.
- To ungroup objects, right click, select "Ungroup", and drag the selection arrow over parts to edit individually.
- To change an object's color, right click it, select "Format Shape", and choose a "Fill" color or gradient from the options provided. Colors can also be changed using the built-in theme colors.
Powerpoint presentations process management solution cycle flow network templ...SlideTeam.net
The document describes a 7 step converging arrows business process management solution. It includes 7 steps represented by arrows that converge on a central text box. All images are 100% editable in PowerPoint and allow the user to change color, size, orientation or any icon to their liking. The document also provides instructions on how to ungroup objects and edit their color using theme colors or by selecting fill and solid options.
Diverging arrows pointing specific directions processs and power point templatesSlideTeam.net
The document shows a diagram with diverging arrows pointing in different directions. The arrows can be edited in PowerPoint by ungrouping the object, changing the color using the format shape option or theme colors, and dragging the arrow to change its orientation. The diagram brings presentations to life and captures audiences' attention. It is fully editable and customizable in PowerPoint.
Templates process diagram with diverging arrows circular layout power point s...SlideTeam.net
The document is an illustration of a business process diagram with diverging arrows. It shows a process splitting into multiple parallel processes represented by arrows branching in different directions. All images in the diagram are fully editable in PowerPoint and can be modified by changing properties like color, size, and orientation. The document provides instructions on how to perform actions like ungrouping objects and editing colors using options in the PowerPoint interface.
Steps layout with converging arrows pointing to center cycle process power po...SlideTeam.net
The document describes how to edit icons in a PowerPoint presentation. It provides instructions for ungrouping objects, editing colors, and changing colors using built-in theme colors. The steps allow presenters to customize icons by changing their size, orientation, and colors to suit their liking.
Seven factors arrow pointing business process charts and power point slidesSlideTeam.net
The document appears to be a template for a diagram or presentation with 7 factors pointing to a central business process. The template includes placeholder text and images that can be customized. It is meant to bring presentations to life and capture audience attention. All elements are editable in PowerPoint.
Diverging arrows pointing different directions circular motion network power ...SlideTeam.net
The document shows a diagram template with diverging arrows pointing in different directions. The template can be customized with text in 8 boxes to bring presentations to life and capture audience attention. The images are fully editable in PowerPoint.
Diverging arrow process project activity diagram cycle power point slidesSlideTeam.net
The document describes a diverging arrow process project activity diagram. It includes steps numbered 1 through 5 with arrows connecting each step. Text placeholders throughout suggest editing the text to describe your own process. The document encourages downloading the diagram and editing it in PowerPoint to bring your own presentation to life and capture your audience's attention. It specifies that all images are 100% editable in terms of color, size, orientation, and text.
Diverging arrow pointing strategic planning process arrows network software p...SlideTeam.net
The document describes a diverging arrow diagram for strategic planning. It includes 11 points labeled 1 through 11 with arrows pointing in different directions. Below the diagram are bullet points describing how the diagram can be used to bring presentations to life, capture audiences' attention, and is fully editable in PowerPoint by changing colors, sizes, orientations of icons, ungrouping objects, and editing colors using theme colors. The document provides instructions for customizing a diverging arrow diagram template for strategic planning presentations.
Diverging arrows graphical view of different aspects cycle flow chart power p...SlideTeam.net
The document describes how to edit and customize diverging arrow diagrams created in PowerPoint. It includes 6 arrows branching from a central point and labeled text boxes that can be edited. The summary provides instructions on how to:
1. Ungroup individual elements to edit them separately.
2. Change colors by right clicking, selecting format shape, and choosing a solid or gradient fill color.
3. Change colors using built-in theme colors under the Design tab.
Diverging arrow pointing strategic planning process arrows network software p...SlideTeam.net
The document describes a diverging arrow diagram for strategic planning. It includes placeholders for text and logos. The diagram has 11 points connected by arrows and can be edited in PowerPoint. It is meant to help presentations and capture audience attention.
Business powerpoint presentations process diagram six decisions cycle flow ch...SlideTeam.net
The document shows a diverging arrows business process diagram with 6 decision points. The diagram can be edited in PowerPoint by changing the text, ungrouping objects to edit individual parts, and changing colors. All images are fully editable and the diagram is meant to capture audience attention and bring presentations to life.
Business powerpoint templates download process diagram cycleSlideTeam.net
The document is a 9 step converging arrows business process diagram template that allows users to customize each step with text and download the finished diagram. It provides an editable template to create a process flow chart for presentations.
Arrow diagram shows required order of tasks arrows software power point templ...SlideTeam.net
The document describes how to edit an arrow diagram in PowerPoint. It outlines the following steps:
1. Ungroup the object by right clicking, selecting group, and then ungroup to edit individual elements.
2. Edit the color of shapes by right clicking, selecting format shape, and choosing a solid or gradient fill color from the options.
3. Alternatively, colors can be changed by selecting a shape and choosing from the built-in theme colors in the design tab.
Arrow diagram shows required order of tasks arrows software power point templ...
Usa western region country editable powerpoint maps with states and counties templates
1. USA REGION
2
1
3 4
LEGEND
Western Region
Mountain Region
Central Region
Eastern Region
All Regions can be colored and edited separately
2. USA REGION
WA
ME
MT ND
VT
OR NH
MN NY
ID SD MA
WI MI
WY CT RI
PA
IA
NE OH
NJ
IN
NV UT IL WV VA DE
CO
KS KY MD
MO
NC
CA TN
OX
AR SC
AZ
NM
MS AL GA
LA
TX LEGEND
Western Region
FL
AR Mountain Region
Central Region
Eastern Region
All Regions can be colored and edited separately
3. USA REGION
WA
ME
MT
ND VT
NH
OR NY
ID MN MA
SD WI MI
WY RI
PA CT
IA OH
NE NJ
IN
UT WV VA DE
NV CO IL
KY MD
KS MO
NC
TN
CA
OX SC
AZ AR
NM
MS AL GA
LA LEGEND
TX Western Region
FL
Mountain Region
AR
Central Region
Eastern Region
All Regions can be colored and edited separately
4. USA - WESTERN REGION
AK
WA
PUT TEXT HERE
OR
• Your Text Goes here
• Download this
awesome diagram
• Bring your presentation
to life
NV
• Capture your audience’s
attention
CA
• All images are 100%
editable in PowerPoint
• Pitch your ideas
convincingly
HI
All Regions can be colored and edited separately
5. USA - WESTERN REGION
ALASKA WASHINGTON
OREGON PUT TEXT HERE
• Your Text Goes here
• Download this
awesome diagram
• Bring your presentation
NEVADA to life
• Capture your audience’s
attention
CALIFORNIA • All images are 100%
editable in PowerPoint
• Pitch your ideas
convincingly
HAWAII
All Regions can be colored and edited separately
6. USA - WESTERN REGION
Juneau
Olympia
ALASKA WASHINGTON
Salem PUT TEXT HERE
OREGON • Your Text Goes here
• Download this
awesome diagram
Carson City • Bring your presentation
NEVADA to life
Sacramento • Capture your audience’s
attention
CALIFORNIA • All images are 100%
editable in PowerPoint
Honolulu • Pitch your ideas
convincingly
HAWAII
All Regions can be colored and edited separately
7. USA - WESTERN REGION
Your Text Goes here. Juneau
Put your text here. Olympia
ALASKA WASHINGTON
Your Text Goes here. Salem
Put your text here.
OREGON
Your Text Goes here. Carson City
Put your text here.
NEVADA
Sacramento
Your Text Goes here. CALIFORNIA
Put your text here.
Honolulu
Your Text Goes here. HAWAII
Put your text here.
Your Text Goes here.
Put your text here.
All Regions can be colored and edited separately
8. USA - WESTERN REGION
AK WA
OR
PUT TEXT HERE
NV
• Your Text Goes here
CA • Download this
awesome diagram
• Bring your presentation
HI to life
• Capture your audience’s
attention
• All images are 100%
Carson City editable in PowerPoint
• Pitch your ideas
convincingly
NEVADA
All Regions can be colored and edited separately
9. USA - WESTERN REGION
AK WA
OR
PUT TEXT HERE
NV • Your Text Goes here
• Download this
CA
awesome diagram
• Bring your presentation
HI to life
• Capture your audience’s
attention
• All images are 100%
editable in PowerPoint
• Pitch your ideas
OLYMPIA convincingly
WASHINGTON
All Regions can be colored and edited separately
10. USA - WESTERN REGION
AK WA
OR
PUT TEXT HERE
NV
• Your Text Goes here
CA • Download this
awesome diagram
• Bring your presentation
HI to life
• Capture your audience’s
attention
• All images are 100%
editable in PowerPoint
• Pitch your ideas
convincingly
SALEM
OREGON
All Regions can be colored and edited separately
11. USA - WESTERN REGION
AK WA
OR
PUT TEXT HERE
NV
• Your Text Goes here
CA • Download this
awesome diagram
• Bring your presentation
HI to life
• Capture your audience’s
Sacramento attention
• All images are 100%
editable in PowerPoint
• Pitch your ideas
convincingly
CALIFORNIA
All Regions can be colored and edited separately
12. USA - WESTERN REGION
Your Text Goes here.
Put your text here.
AK
WA
Your Text Goes here.
Put your text here. OR
Your Text Goes here.
Put your text here.
NV
Your Text Goes here. CA
Put your text here.
Your Text Goes here. HI
Put your text here.
Your Text Goes here.
Put your text here.
All Regions can be colored and edited separately
13. USA - WESTERN REGION
Your Text Goes Here
• Download this awesome diagram AK
• Bring your presentation to life WA
• Capture your audience’s attention
• All images are 100% editable in
OR
PowerPoint
• Pitch your ideas convincingly
Your Text Goes Here NV
• Download this awesome diagram CA
• Bring your presentation to life
• Capture your audience’s attention
• All images are 100% editable in
PowerPoint HI
• Pitch your ideas convincingly
All Regions can be colored and edited separately
14. USA - WESTERN REGION
Your Text Goes Here
• Download this awesome diagram AK
• Bring your presentation to life WA
• Capture your audience’s attention
• All images are 100% editable in
OR
PowerPoint
• Pitch your ideas convincingly
Your Text Goes Here NV
• Download this awesome diagram CA
• Bring your presentation to life
• Capture your audience’s attention
• All images are 100% editable in
PowerPoint HI
• Pitch your ideas convincingly
All Regions can be colored and edited separately
15. USA - WESTERN REGION
AK
WA
OR
NV
CA
HI
Your Text Goes here. Put Your Text Goes here. Put
your text here. your text here.
Your Text Goes here. Put
your text here.
your text here.
16. USA - WESTERN REGION
AK
WA
OR
NV
CA
HI
Your Text Goes here. Your Text Goes here.
All Regions can be colored and edited separately
17. USA - WESTERN REGION
AK
WA
PUT TEXT HERE
• Your Text Goes here
OR • Download this
awesome diagram
• Bring your presentation
to life
• Capture your audience’s
NV attention
• All images are 100%
CA editable in PowerPoint
• Pitch your ideas
convincingly
HI
All Regions can be colored and edited separately
18. USA - WESTERN REGION
AK
WA
PUT TEXT HERE
OR
• Your Text Goes here
• Download this
awesome diagram
• Bring your presentation
to life
NV
• Capture your audience’s
attention
CA
• All images are 100%
editable in PowerPoint
• Pitch your ideas
convincingly
HI
All Regions can be colored and edited separately
19. USA - WESTERN REGION
AK WA
OR
NV
CA
Sacramento
HI
CALIFORNIA
PUT TEXT HERE
• Your Text Goes here
• Download this awesome diagram
• Bring your presentation to life
• Capture your audience’s attention
• All images are 100% editable in
PowerPoint
• Pitch your ideas convincingly
All Regions can be colored and edited separately
20. USA - WESTERN REGION
AK WA
OR
NV
SALEM
CA
OREGON
HI
PUT TEXT HERE
• Your Text Goes here
• Download this awesome diagram
• Bring your presentation to life
• Capture your audience’s attention
• All images are 100% editable in
PowerPoint
• Pitch your ideas convincingly
All Regions can be colored and edited separately
21. USA - WESTERN REGION
AK WA
OR
PUT TEXT HERE
NV
• Your Text Goes here
CA • Download this
awesome diagram
• Bring your presentation
HI to life
• Capture your audience’s
Sacramento attention
• All images are 100%
editable in PowerPoint
• Pitch your ideas
convincingly
CALIFORNIA
All Regions can be colored and edited separately
22. USA - WESTERN REGION
AK WA
OR
PUT TEXT HERE
NV
• Your Text Goes here
CA • Download this
awesome diagram
• Bring your presentation
HI to life
• Capture your audience’s
attention
SALEM • All images are 100%
editable in PowerPoint
• Pitch your ideas
OREGON convincingly
All Regions can be colored and edited separately
23. USA - WESTERN REGION
ALASKA WASHINGTON
OREGON
city Sales Representative Contact No.
ALASKA Mr. ABC 000.111.2222
NEVADA WASHINGTON Mr. XYZ 000.111.2222
OREGON Mr. EFG 000.111.2222
CALIFORNIA CALIFORNIA Mr. PQR 000.111.2222
HAWAII Mr. BCD 000.111.2222
HAWAII
NEVADA
Mr. BCD 000.111.2222
All Regions can be colored and edited separately
24. USA - WESTERN REGION
ALASKA WASHINGTON
OREGON
NEVADA
CALIFORNIA
HAWAII
<Your Company> Distributor Map
Distributors in 2011 Regions with Distributors Regions without Distributors
All Regions can be colored and edited separately
25. Edit Color– Inside the Group
2
1
3
1. Right click the object.
2. Choose Group and then Ungroup.
3. Click beside the object and drag the arrow over it.
26. Edit Color
3
1 2
1. Select the shape to change the color and Right click the object( click any object which you
want to change color)
2. Choose Format Shape in the dialog box
3. Choose “Fill” in the Format Shape box then “Solid” or “Gradient” depending on the
appearance of the object. Change colour as shown in the picture.
27. Edit size 2
1
1. Click map you want to edit size.
2. Choose Rotate in the Format Tab, change height or width depending on the appearance of
the object
OR
1. To increase or decrease the size in one or more directions, drag a sizing handle away from or
toward the center, while doing one of the following:
2. To keep the center of an object in the same place, press and hold CTRL while you drag the
sizing handle.
3. To maintain the object's proportions, press and hold SHIFT while you drag the sizing handle.
4. To both maintain the object's proportions and keep its center in the same place, press and
hold both CTRL and SHIFT while you drag the sizing handle.
28. Insert names using text boxes
1 2
3
1) Open the PowerPoint Slide in which you have to insert the Text Box. Then click on the “Insert
Tab’ in the Ribbon and then inside the Insert Tab, in the ‘Text’ category click on the “Text Box”
icon.
2) Now to insert the Text box, click on the Portion of the Slide where you want the Text box to be
inserted. Once you click, the Text box will be inserted. You can change the size and the shape of
the Text box as per your requirements.
3) Now click on the Text box to enter data into it.