1. FOR RELEASE SEPTEMBER 6, 2017
BY Elisa Shearer and Jeffrey Gottfried
FOR MEDIA OR OTHER INQUIRIES:
Amy Mitchell, Director, Journalism Research
Hannah Klein, Communications Associate
202.419.4372
www.pewresearch.org
RECOMMENDED CITATION
Pew Research Center, September, 2017, “News
Use Across Social Media Platforms 2017”
3. 2
PEW RESEARCH CENTER
www.pewresearch.org
45%
55
78% 78
2016 2017
50+
Ages
18-49
60
6968
63
2016 2017
Some college
or less
College+
64
74
62
64
2016 2017
Nonwhite
White
2018%
27
26%
20
18%
20172016
62%
67
Often
Sometimes
Hardly ever
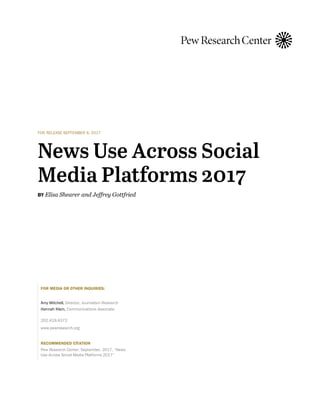
News Use Across Social Media
Platforms 2017
As of August 2017, two-thirds (67%) of Americans report that
they get at least some of their news on social media – with two-
in-ten doing so often, according to a new survey from Pew
Research Center. This is a modest increase since early 2016,
when (during the height of the presidential primaries) 62% of
U.S. adults reported getting news from social media. While a
small increase overall, this growth is driven by more substantial
increases among Americans who are older, less educated, and
nonwhite. This study is based on a survey conducted August 8-
21, 2017, with 4,971 U.S. adults who are members of Pew
Research Center’s nationally representative American Trends
Panel.
For the first time in the Center’s surveys, more than half (55%)
of Americans ages 50 or older report getting news on social
media sites. That is 10 percentage points higher than the 45%
who said so in 2016. Those under 50, meanwhile, remain more
likely than their elders to get news from these sites (78% do,
Social media news use increases among older, nonwhite and less educated
Americans
% of U.S. adults who get news from social media sites …
Note: Nonwhite includes all race and ethnic groups other than non-Hispanic whites.
Source: Survey conducted Aug. 8-21, 2017.
“News Use Across Social Media Platforms 2017”
PEW RESEARCH CENTER
In 2017, two-thirds of
U.S. adults get news from
social media
% of U.S. adults who get news from
social media sites …
Source: Survey conducted Aug. 8-21, 2017.
“News Use Across Social Media Platforms
2017”
PEW RESEARCH CENTER
4. 3
PEW RESEARCH CENTER
www.pewresearch.org
unchanged from 2016).
Furthermore, about three-quarters of nonwhites (74%) get news on social media sites, up from
64% in 2016. This growth means that nonwhites1 are now more likely than whites to get news
while on social media. And social media news use also increased among those with less than a
bachelor’s degree, up nine percentage points from 60% in 2016 to 69% in 2017. Alternatively,
among those with at least a college degree, social media news use declined slightly.
1 Nonwhite includes all racial and ethnic groups, except non-Hispanic white.
5. 74%
32
29
59%
21
17
52%
20
Twitter
YouTube
'16-'17
CHANGE
+15*
+11*
+12*
2017
2016
2013
Snapchat
Sites where news usership
increased since 2016
68
68
39
27
23
23
70
66
31
23
19
62
47
29
13
13
Reddit
Facebook
Tumblr
Instagram
LinkedIn
-2
+2
+8
+4
+4
WhatsApp N/A
Sites where news usership
did not change since 2016
Twitter, YouTube and Snapchat have grown
in share of users who get news on each
site
Because of the vastly different audience sizes
across major social media sites, there are two
different ways to think about measuring
change in news use on these platforms. One is
to compare the share of each site’s users that
get news on the site, while the second is to
measure the total percentage of Americans
that report seeing news on the site.
We first look at the share of each site’s users
who get news there. Overall, three of the sites
measured — Twitter, YouTube and Snapchat
— had an increase in the share of their
audience that gets news on the site. Since
2013, at least half of Twitter users have
reported getting news on the site, but in 2017,
with a president who frequently makes
announcements on the platform, that share
has increased to about three-quarters (74%),
up 15 percentage points from last year. On
YouTube, about a third of users now get news
there (32%), up from 21% in 2016. And news
use among Snapchat’s user base increased 12
percentage points to 29% in August 2017, up
from 17% in early 2016.
Growth on these three sites follows
investments the companies have made over
the last year in developing their news usability.
Twitter, in addition to getting nearly daily
attention from the president’s posts, spent the
year promoting the platform’s potential for
news publishers and has announced launches
for multiple news streaming partnerships. YouTube launched and expanded YouTube TV, and the
Twitter, YouTube and Snapchat have
grown since 2016 in portion of users
who get news on each site
% of each social media site’s users who get news there
*Change from 2016 to 2017 is statistically significant.
Note: Snapchat not asked about in 2013. WhatsApp not asked
about in 2013 or 2016.
Source: Survey conducted Aug. 8-21, 2017.
“News Use Across Social Media Platforms 2017”
PEW RESEARCH CENTER
6. 5
PEW RESEARCH CENTER
www.pewresearch.org
site added a “breaking news” summary on its homepage. It also continues to be used for
disseminating information to small, dispersed communities. Snapchat won over a number of big
news names this year for its group of Discover publishers: CNN, NBC, The New York Times all
joined, and the platform plans on continuing to bring in others.
For five of the six remaining sites asked about – Facebook, Reddit, Instagram, LinkedIn and
Tumblr –users were about as likely to get news from each as they were last year. The last site,
WhatsApp, was asked about for the first time this year, and nearly a quarter, 23%, of its users get
news there.
7. 6
PEW RESEARCH CENTER
www.pewresearch.org
Overall, Facebook outstrips all other social media sites as a source of news; YouTube now
reaches second highest percentage
Looking at the population as a whole, Facebook by far still leads every other social media site as a
source of news. This is largely
due to Facebook’s large user
base, compared with other
platforms, and the fact that
most of its users get news on
the site. Specifically, about
two-thirds of Americans (66%)
use Facebook, and a majority
of those users get news on the
site, similar to 2016. Looked at
as a portion of all U.S. adults,
this translates into just under
half (45%) of Americans
getting news on Facebook.
Even though YouTube has a
large user base – 58% of the
population – a smaller portion
gets news there. In 2017, both
the user base and the share
getting news on YouTube
grew. The result: 18% of all
Americans now get news on
YouTube, making it the second
most common social media
site for news – albeit still far
behind Facebook.
Twitter has the reverse structure from YouTube: While a large share of its users get news on the
site (74% say they do), its audience is significantly smaller overall. This means that overall, fewer
Americans get news on Twitter (11% of U.S. adults).
Social media sites as pathways to news
% of U.S. adults who use each social media site and % of U.S. adults who get
news from each site
Source: Survey conducted Aug. 8-21, 2017.
“News Use Across Social Media Platforms 2017”
PEW RESEARCH CENTER
8. 7
PEW RESEARCH CENTER
www.pewresearch.org
15%
18
26
2013 2016 2017
Not only have Americans grown somewhat in their use of social media for news overall, but now
they are more likely than ever to get news from multiple social media sites. About one quarter of
all U.S. adults (26%) get news from two or more of these sites, up from 18% in 2016 and 15% in
2013.
News users of Instagram, Snapchat and WhatsApp are
particularly likely to get news on multiple social networks; at
least 90% of their news users get news on at least two social
media sites.
There are also some interesting differences in where the
overlaps occur – in other words, which sites tend to share users.
Instagram’s news users, for example, are much more likely to
also get news on Snapchat (40% do so) than are LinkedIn’s
news users (8% of LinkedIn news users also get news on
Snapchat), for example. But Facebook, with such a large news
user base, overlaps with just about every other social media
site: About half or more of news users (at least 48%) of each of
the other sites studied also get news on Facebook.
About one-in-four now get
news from multiple social
media sites
% of U.S. adults who get news on
two or more different social media
sites
Source: Survey conducted Aug. 8-21, 2017.
“News Use Across Social Media Platforms
2017”
PEW RESEARCH CENTER
9. 8
PEW RESEARCH CENTER
www.pewresearch.org
There are some key differences in the demographic makeup of each site’s news users. Instagram
and Snapchat news consumers are considerably more likely to be nonwhite and younger. Twitter
and LinkedIn have the largest share of college graduates among their news users – 59% of
LinkedIn’s news users have college degrees, as do 45% of Twitter’s news users. The news user
bases of the two largest sites – Facebook and YouTube – include more older Americans than those
of smaller sites such as Instagram and Snapchat.
Snapchat has by far the youngest group of news users – 82% are ages 18-29. While Facebook and
YouTube are still the most popular among this age group for news overall, the makeup of the app’s
news audience means that about one-in-five (21%) 18- to 29-year-olds now get news on Snapchat.
Social media news user profiles
% of each social media site’s news users who are …
Note: Tumblr, Reddit, and WhatsApp not shown. Nonwhite includes all racial and ethnic groups, except non-Hispanic white.
Source: Survey conducted Aug. 8-21, 2017.
“News Use Across Social Media Platforms 2017”
PEW RESEARCH CENTER
10. 9
PEW RESEARCH CENTER
www.pewresearch.org
33%
25
21
30
22
30
37
Facebook
YouTube
Twitter
Instagram
Snapchat
LinkedIn
All adults
Local TV
24%
24
28
27
20
29
28
Facebook
YouTube
Twitter
Instagram
Snapchat
LinkedIn
All adults
Cable TV
20%
18
15
22
12
22
26
Facebook
YouTube
Twitter
Instagram
Snapchat
LinkedIn
All adults
Network nightly TV
33%
44
55
48
49
58
33
Facebook
YouTube
Twitter
Instagram
Snapchat
LinkedIn
All adults
News websites/apps
24%
26
29
26
15
34
25
Facebook
YouTube
Twitter
Instagram
Snapchat
LinkedIn
All adults
Radio
11%
9
11
11
5
16
18
Facebook
YouTube
Twitter
Instagram
Snapchat
LinkedIn
All adults
Print newspapers
Getting news on social media doesn’t mean that other more traditional pathways to news are
ignored. Many social media news users also get news from a variety of other platforms, although
there are some differences among the users of the various sites. Twitter news users, for example,
are more likely to also often get news via news websites and apps than Facebook or YouTube news
users. Facebook news users are more likely to often get news from local TV than those on
YouTube, Twitter and Snapchat.
Use of traditional news platforms by social media news users
% of each social media site’s news users who often get news from …
Note: Reddit, Tumblr, and WhatsApp not shown.
Source: Survey conducted Aug. 8-21, 2017 among U.S. adults.
“News Use Across Social Media Platforms 2017”
PEW RESEARCH CENTER
11. 10
PEW RESEARCH CENTER
www.pewresearch.org
Acknowledgments
This report was made possible by The Pew Charitable Trusts. Pew Research Center is a subsidiary
of the Pew Charitable Trusts, its primary funder. This report is a collaborative effort based on the
input and analysis of the following individuals. Find related reports online at: journalism.org.
Amy Mitchell, Director, Journalism Research
Elisa Shearer, Research Analyst
Jeffrey Gottfried, Senior Researcher
Sophia Fedeli, Research Assistant
Galen Stocking, Research Associate
Katerina Eva Matsa, Senior Researcher
Margaret Porteus, Information Graphics Designer
Rachel Weisel, Communications Manager
Hannah Klein, Communications Associate
Shannon Greenwood, Associate Digital Producer
12. 11
PEW RESEARCH CENTER
www.pewresearch.org
Methodology
The American Trends Panel (ATP), created by Pew Research Center, is a nationally representative
panel of randomly selected U.S. adults recruited from landline and cellphone random-digit-dial
(RDD) surveys. Panelists participate via monthly self-administered web surveys. Panelists who do
not have internet access are provided with a tablet and wireless internet connection. The panel is
being managed by Abt Associates.
Data in this report are drawn from the panel wave conducted Aug. 8-21, 2017, among 4,971
respondents. The margin of sampling error for the full sample of 4,971 respondents is plus or
minus 2.5 percentage points.
Members of the American Trends Panel were recruited from several large, national landline and
cellphone random-digit-dial surveys conducted in English and Spanish. At the end of each survey,
respondents were invited to join the panel. The first group of panelists was recruited from the
2014 Political Polarization and Typology Survey, conducted from Jan. 23 to March 16, 2014. Of the
10,013 adults interviewed, 9,809 were invited to take part in the panel, and a total of 5,338 agreed
to participate.2 The second group of panelists was recruited from the 2015 Pew Research Center
Survey on Government, conducted from Aug. 27 to Oct. 4, 2015. Of the 6,004 adults interviewed,
all were invited to join the panel, and 2,976 agreed to participate.3 The third group of panelists was
recruited from a survey conducted from April 25 to June 4, 2017. Of the 5,012 adults interviewed
in the survey or pretest, 3,905 were invited to take part in the panel and a total of 1,628 agreed to
participate.4
The ATP data were weighted in a multi-step process that begins with a base weight incorporating
the respondents’ original survey selection probability and the fact that in 2014 some panelists were
subsampled for invitation to the panel. Next, an adjustment was made for the fact that the
propensity to join the panel and remain an active panelist varied across different groups in the
sample. The final step in the weighting uses an iterative technique that aligns the sample to
population benchmarks on a number of dimensions. Gender, age, education, race, Hispanic origin
and region parameters come from the U.S. Census Bureau's 2015 American Community Survey.
The county-level population density parameter (deciles) comes from the 2010 U.S. Decennial
2 When data collection for the 2014 Political Polarization and Typology Survey began, non-internet users were subsampled at a rate of 25%,
but a decision was made shortly thereafter to invite all non-internet users to join. In total, 83% of non-internet users were invited to join the
panel.
3 Respondents to the 2014 Political Polarization and Typology Survey who indicated that they are internet users but refused to provide an
email address were initially permitted to participate in the American Trends Panel by mail but were no longer permitted to join the panel after
Feb. 6, 2014. Internet users from the 2015 Pew Research Center Survey on Government who refused to provide an email address were not
permitted to join the panel.
4 White, non-Hispanic college graduates were subsampled at a rate of 50%.
14. 13
PEW RESEARCH CENTER
www.pewresearch.org
Topline questionnaire
2017 PEW RESEARCH CENTER’S AMERICAN TRENDS PANEL
WAVE 28 August
FINAL TOPLINE
Aug. 8-Aug. 21, 2017
TOTAL N=4,971
Now, thinking about your general news habits …
ASK ALL:
NEWS_PLATFORM How often do you … [RANDOMIZE]
Often Sometimes
Hardly
ever Never
No
Answer
a. Read any newspapers in print?
Aug 7-Aug 21, 2017 [N=4,971] 18 25 32 25 *
Jan 12-Feb 8, 2016 [N=4,654] 20 28 31 21 *
Aug 21-Sep 2, 2013 [N=5,173] 27 27 27 19 *
b. Listen to news on the radio?
Aug 7-Aug 21, 2017 [N=4,971] 25 31 22 21 *
Jan 12-Feb 8, 2016 [N=4,654] 25 34 24 17 *
Aug 21-Sep 2, 2013 [N=5,173] 26 30 27 18 *
NO ITEM C
d. Watch local television news?
Aug 7-Aug 21, 2017 [N=4,971] 37 27 21 15 *
Jan 12-Feb 8, 2016 [N=4,654] 466
27 17 10 *
Aug 21-Sep 2, 2013 [N=5,173] 46 26 17 11 *
e. Watch national evening
network television news (such
as ABC World News, CBS
Evening News, or NBC Nightly
News)?
Aug 7-Aug 21, 2017 [N=4,971] 26 25 25 25 *
Jan 12-Feb 8, 2016 [N=4,654] 30 27 25 17 *
Aug 21-Sep 2, 2013 [N=5,173] 31 28 24 18 *
f. Watch cable television news
(such as CNN, The Fox News
cable channel, or MSNBC)?
Aug 7-Aug 21, 2017 [N=4,971] 28 27 23 22 *
Jan 12-Feb 8, 2016 [N=4,654] 31 27 24 18 *
Aug 21-Sep 2, 2013 [N=5,173] 24 28 26 21 *
6
In the Spanish language version of the questionnaire, “local television news” was mistranslated as “television news” for NEWS_PLATFORM
item D. This affected the 66 respondents who took the survey in Spanish (4% of the sample after weighting). The effects of this mistranslation
were minimal and do not affect the report’s substantive conclusions.
15. 14
PEW RESEARCH CENTER
www.pewresearch.org
Often Sometimes
Hardly
ever Never
No
Answer
NEWS_PLATFORM CONTINUED …
g. Get news from a social media site
(such as Facebook, Twitter, or
Snapchat?)?
Aug 7-Aug 21, 2017 [N=4,971] 20 27 20 33 0
Jan 12-Feb 8, 2016 [N=4,654] 18 26 18 38 *
h. Get news from a news website or
app?
Aug 7-Aug 21, 2017 [N=4,971] 33 31 19 17 *
Jan 12-Feb 8, 2016 [N=4,654] 28 28 18 26 *
ASK ALL INTERNET USERS (F_INTUSER_FINAL=1) [N=4,752]:
SNS Do you use any of the following social media sites?
[Check all that apply] [RANDOMIZE WITH “OTHER” ALWAYS LAST]
BASED ON TOTAL Selected
Not
Selected No Answer
a. Facebook
Aug 7- Aug 21, 2017 [N=4,971] 66 34 -
Jan 12-Feb 8, 2016 [N=4,654] 67 33 -
Mar 13-15, 20-22, 2015 [N=2,035] 66 34 1
Aug 21-Sep 2, 2013 [N=5,173] 64 36 *
b. Twitter
Aug 7- Aug 21, 2017 [N=4,971] 15 85 -
Jan 12-Feb 8, 2016 [N=4,654] 16 84 -
Mar 13-15, 20-22, 2015 [N=2,035] 17 83 1
Aug 21-Sep 2, 2013 [N=5,173] 16 84 *
NO ITEM C
d. LinkedIn
Aug 7- Aug 21, 2017 [N=4,971] 21 79 -
Jan 12-Feb 8, 2016 [N=4,654] 20 80 -
Aug 21-Sep 2, 2013 [N=5,173] 19 80 *
e. Instagram
Aug 7- Aug 21, 2017 [N=4,971] 26 74 -
Jan 12-Feb 8, 2016 [N=4,654] 19 81 -
Aug 21-Sep 2, 2013 [N=5,173] 12 88 *
NO ITEM F
g. Tumblr
Aug 7- Aug 21, 2017 [N=4,971] 4 96 -
Jan 12-Feb 8, 2016 [N=4,654] 4 96 -
Aug 21-Sep 2, 2013 [N=5,173] 4 96 *
16. 15
PEW RESEARCH CENTER
www.pewresearch.org
Selected
Not
Selected No Answer
SNS CONTINUED …
h. YouTube
Aug 7- Aug 21, 2017 [N=4,971] 58 42 -
Jan 12-Feb 8, 2016 [N=4,654] 48 52 -
Aug 21-Sep 2, 2013 [N=5,173] 51 49 *
i. Reddit
Aug 7- Aug 21, 2017 [N=4,971] 6 94 -
Jan 12-Feb 8, 2016 [N=4,654] 4 96 -
Aug 21-Sep 2, 2013 [N=5,173] 3 97 *
j. Snapchat
Aug 7- Aug 21, 2017 [N=4,971] 18 82 -
Jan 12-Feb 8, 2016 [N=4,654] 10 90 -
k. WhatsApp
Aug 7- Aug 21, 2017 [N=4,971] 11 89 -
l. Other
Aug 7- Aug 21, 2017 [N=4,971] 5 95 -
Jan 12-Feb 8, 2016 [N=4,654] 11 89 -
Aug 21-Sep 2, 2013 [N=5,173] 3 97 *
ASK IF AT LEAST YES TO 1 ITEM SNS; SHOW ONLY THOSE SITES USED (SNSA-K=1):
SNSNEWS Do you ever get news or news headlines on any of the following sites? By news we mean
information about events and issues that involve more than just your friends or family.
[RANDOMIZE]
Yes No
No
Answer
BASED ON FACEBOOK USERS:
a. Facebook
Aug 7- Aug 21, 2017 [N=3,635] 68 32 1
Jan 12-Feb 8, 2016 [N=3,210] 66 34 *
Mar 13-15, 20-22, 2015 [N=1,343] 63 37 *
Aug 21-Sep 2, 2013 [N=3,268] 47 53 0
BASED ON TWITTER USERS:
b. Twitter
Aug 7- Aug 21, 2017 [N=1,088] 74 25 1
Jan 12-Feb 8, 2016 [N=908] 59 41 1
Mar 13-15, 20-22, 2015 [N=347] 63 37 0
Aug 21-Sep 2, 2013 [N=736] 52 48 0
NO ITEM C
BASED ON LINKEDIN USERS:
d. LinkedIn
Aug 7- Aug 21, 2017 [N=1,540] 23 76 1
Jan 12-Feb 8, 2016 [N=1,348] 19 81 *
Aug 21-Sep 2, 2013 [N=1,107] 13 87 0
17. 16
PEW RESEARCH CENTER
www.pewresearch.org
Yes No
No
Answer
SNSNEWS CONTINUED …
BASED ON INSTAGRAM USERS:
e. Instagram
Aug 7- Aug 21, 2017 [N=1,390] 27 71 2
Jan 12-Feb 8, 2016 [N=933] 23 76 1
Aug 21-Sep 2, 2013 [N=467] 13 87 0
NO ITEM F
BASED ON TUMBLR USERS:
g. Tumblr
Aug 7- Aug 21, 2017 [N=226] 39 60 1
Jan 12-Feb 8, 2016 [N=198] 31 69 -
Aug 21-Sep 2, 2013 [N=159] 29 71 0
BASED ON YOUTUBE USERS:
h. YouTube
Aug 7- Aug 21, 2017 [N=3,180] 32 67 1
Jan 12-Feb 8, 2016 [N=2,542] 21 77 1
Aug 21-Sep 2, 2013 [N=2,506] 20 80 0
BASED ON REDDIT USERS:
i. Reddit
Aug 7- Aug 21, 2017 [N=369] 68 32 *
Jan 12-Feb 8, 2016 [N=288] 70 30 *
Aug 21-Sep 2, 2013 [N=114] 62 38 0
BASED ON SNAPCHAT USERS:
j. Snapchat
Aug 7- Aug 21, 2017 [N=787] 29 70 2
Jan 12-Feb 8, 2016 [N=439] 17 82 1
BASED ON WHATSAPP USERS:
k. WhatsApp
Aug 7- Aug 21, 2017 [N=585] 23 74 3