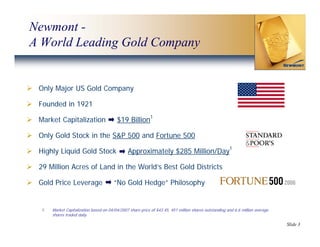
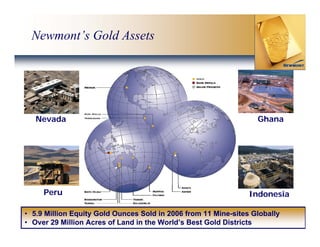
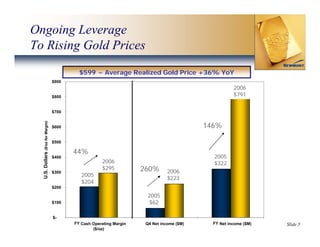
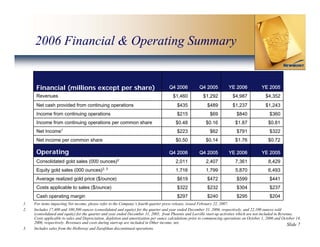
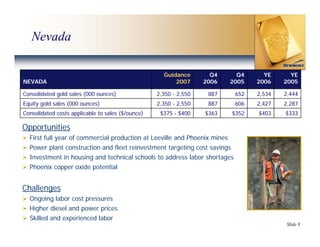
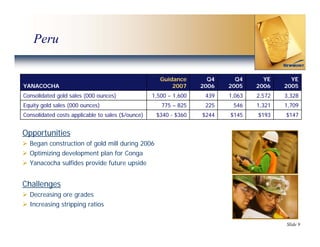
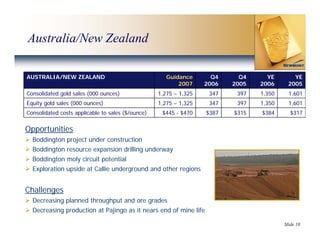
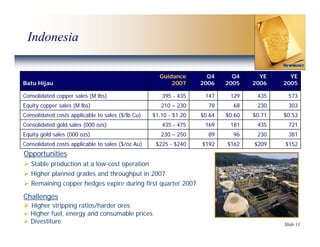
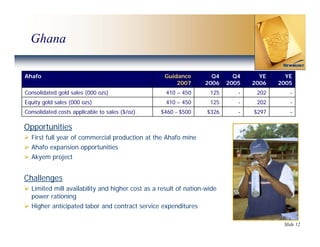
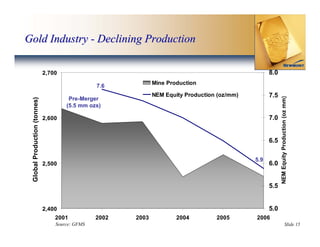
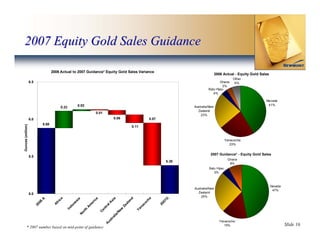
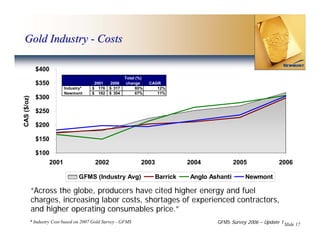
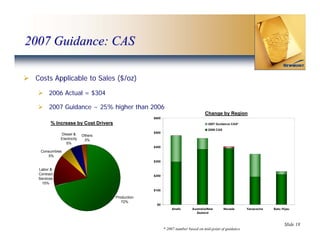
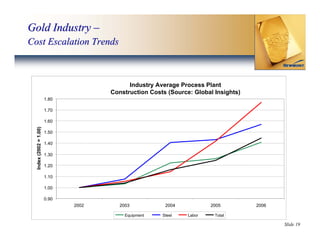
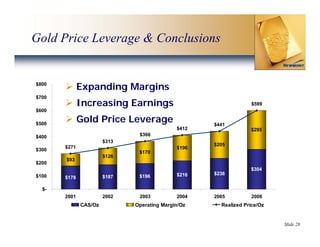
This presentation discusses Newmont Mining Corporation capitalizing on the gold bull market. Newmont is the only major US gold company and has gold assets in Nevada, Peru, Indonesia, Australia, and Ghana. In 2006, Newmont had equity gold sales of 5.9 million ounces. Newmont provides leverage to rising gold prices with no gold hedges. Guidance is given for 2007 production and costs at each region. Costs applicable to sales are expected to increase approximately 25% in 2007 due to increases in factors such as labor, fuel and consumables.
Austin Texas real estate market update from January 1999 to December 2007. Provided by Dee Copeland, investor specialist at Keller Williams Realty Austin.
where can I find a legit pi merchant onlineDOT TECH
Yes. This is very easy what you need is a recommendation from someone who has successfully traded pi coins before with a merchant.
Who is a pi merchant?
A pi merchant is someone who buys pi network coins and resell them to Investors looking forward to hold thousands of pi coins before the open mainnet.
I will leave the what'sapp contact of my personal pi merchant to trade with
+12349014282
What price will pi network be listed on exchangesDOT TECH
The rate at which pi will be listed is practically unknown. But due to speculations surrounding it the predicted rate is tends to be from 30$ — 50$.
So if you are interested in selling your pi network coins at a high rate tho. Or you can't wait till the mainnet launch in 2026. You can easily trade your pi coins with a merchant.
A merchant is someone who buys pi coins from miners and resell them to Investors looking forward to hold massive quantities till mainnet launch.
I will leave the what's app number of my personal pi vendor to trade with.
+12349014282
how to sell pi coins effectively (from 50 - 100k pi)DOT TECH
Anywhere in the world, including Africa, America, and Europe, you can sell Pi Network Coins online and receive cash through online payment options.
Pi has not yet been launched on any exchange because we are currently using the confined Mainnet. The planned launch date for Pi is June 28, 2026.
Reselling to investors who want to hold until the mainnet launch in 2026 is currently the sole way to sell.
Consequently, right now. All you need to do is select the right pi network provider.
Who is a pi merchant?
An individual who buys coins from miners on the pi network and resells them to investors hoping to hang onto them until the mainnet is launched is known as a pi merchant.
debuts.
I'll provide you the what'sapp number.
+12349014282
Lecture slide titled Fraud Risk Mitigation, Webinar Lecture Delivered at the Society for West African Internal Audit Practitioners (SWAIAP) on Wednesday, November 8, 2023.
how to swap pi coins to foreign currency withdrawable.DOT TECH
As of my last update, Pi is still in the testing phase and is not tradable on any exchanges.
However, Pi Network has announced plans to launch its Testnet and Mainnet in the future, which may include listing Pi on exchanges.
The current method for selling pi coins involves exchanging them with a pi vendor who purchases pi coins for investment reasons.
If you want to sell your pi coins, reach out to a pi vendor and sell them to anyone looking to sell pi coins from any country around the globe.
Below is the what'sapp information for my personal pi vendor.
+12349014282
^%$Zone1:+971)581248768’][* Legit & Safe #Abortion #Pills #For #Sale In #Duba...mayaclinic18
Whatsapp (+971581248768) Buy Abortion Pills In Dubai/ Qatar/Kuwait/Doha/Abu Dhabi/Alain/RAK City/Satwa/Al Ain/Abortion Pills For Sale In Qatar, Doha. Abu az Zuluf. Abu Thaylah. Ad Dawhah al Jadidah. Al Arish, Al Bida ash Sharqiyah, Al Ghanim, Al Ghuwariyah, Qatari, Abu Dhabi, Dubai.. WHATSAPP +971)581248768 Abortion Pills / Cytotec Tablets Available in Dubai, Sharjah, Abudhabi, Ajman, Alain, Fujeira, Ras Al Khaima, Umm Al Quwain., UAE, buy cytotec in Dubai– Where I can buy abortion pills in Dubai,+971582071918where I can buy abortion pills in Abudhabi +971)581248768 , where I can buy abortion pills in Sharjah,+97158207191 8where I can buy abortion pills in Ajman, +971)581248768 where I can buy abortion pills in Umm al Quwain +971)581248768 , where I can buy abortion pills in Fujairah +971)581248768 , where I can buy abortion pills in Ras al Khaimah +971)581248768 , where I can buy abortion pills in Alain+971)581248768 , where I can buy abortion pills in UAE +971)581248768 we are providing cytotec 200mg abortion pill in dubai, uae.Medication abortion offers an alternative to Surgical Abortion for women in the early weeks of pregnancy. Zone1:+971)581248768’][* Legit & Safe #Abortion #Pills #For #Sale In #Dubai Abu Dhabi Sharjah Deira Ajman Fujairah Ras Al Khaimah%^^%$Zone1:+971)581248768’][* Legit & Safe #Abortion #Pills #For #Sale In #Dubai Abu Dhabi Sharjah Deira Ajman Fujairah Ras Al Khaimah%^^%$Zone1:+971)581248768’][* Legit & Safe #Abortion #Pills #For #Sale In #Dubai Abu Dhabi Sharjah Deira Ajman Fujairah Ras Al Khaimah%^^%$Zone1:+971)581248768’][* Legit & Safe #Abortion #Pills #For #Sale In #Dubai Abu Dhabi Sharjah Deira Ajman Fujairah Ras Al Khaimah%^^%$Zone1:+971)581248768’][* Legit & Safe #Abortion #Pills #For #Sale In #Dubai Abu Dhabi Sharjah Deira Ajman Fujairah Ras Al Khaimah%^^%$Zone1:+971)581248768’][* Legit & Safe #Abortion #Pills #For #Sale In #Dubai Abu Dhabi Sharjah Deira Ajman Fujairah Ras Al Khaimah%^^%$Zone1:+971)581248768’][* Legit & Safe #Abortion #Pills #For #Sale In #Dubai Abu Dhabi Sharjah Deira Ajman Fujairah Ras Al Khaimah%^^%$Zone1:+971)581248768’][* Legit & Safe #Abortion #Pills #For #Sale In #Dubai Abu Dhabi Sharjah Deira Ajman Fujairah Ras Al Khaimah%^^%$Zone1:+971)581248768’][* Legit & Safe #Abortion #Pills #For #Sale In #Dubai Abu Dhabi Sharjah Deira Ajman Fujairah Ras Al Khaimah%^^%$Zone1:+971)581248768’][* Legit & Safe #Abortion #Pills #For #Sale In #Dubai Abu Dhabi Sharjah Deira Ajman Fujairah Ras Al Khaimah%^^%$Zone1:+971)581248768’][* Legit & Safe #Abortion #Pills #For #Sale In #Dubai Abu Dhabi Sharjah Deira Ajman Fujairah Ras Al Khaimah%^^%$Zone1:+971)581248768’][* Legit & Safe #Abortion #Pills #For #Sale In #Dubai Abu Dhabi Sharjah Deira Ajman Fujairah Ras Al Khaimah%^^%$Zone1:+971)581248768’][* Legit & Safe #Abortion #Pills #For #Sale In #Dubai Abu Dhabi Sharjah Deira Ajman Fujairah Ras Al Khaimah%^^%$Zone1:+971)581248768’][* Legit & Safe #Abortion #Pills #For #Sale In #Dubai Abu Dhabi Sharjah Deira Ajman
The Rise of Generative AI in Finance: Reshaping the Industry with Synthetic DataChampak Jhagmag
In this presentation, we will explore the rise of generative AI in finance and its potential to reshape the industry. We will discuss how generative AI can be used to develop new products, combat fraud, and revolutionize risk management. Finally, we will address some of the ethical considerations and challenges associated with this powerful technology.
The WhatsPump Pseudonym Problem and the Hilarious Downfall of Artificial Enga...
newmont mining Final_West_Coast_Presentation
1. Capitalizing
on the
Gold Bull
Market
West Coast
April 9, 2007
2. Cautionary Statement
This presentation contains “forward-looking statements” within the meaning of Section 27A of the Securities Act of 1933, as
amended, and Section 21E of the Securities Exchange Act of 1934, as amended, that are intended to be covered by the safe
harbor created by such sections. Such forward-looking statements include, without limitation, (i) estimates of future gold
and copper production and sales; (ii) estimates of future costs applicable to sales; (iii) estimates of future capital
expenditures, royalty and dividend income, tax rates and expenses; (iv) estimates regarding timing of future development,
construction, production or closure activities; (v) statements regarding future exploration results and the replacement of
reserves; and (vi) statements regarding cost structure and competitive position. Where the Company expresses or implies
an expectation or belief as to future events or results, such expectation or belief is expressed in good faith and believed to
have a reasonable basis. However, forward-looking statements are subject to risks, uncertainties and other factors, which
could cause actual results to differ materially from future results expressed, projected or implied by such forward-looking
statements. Such risks include, but are not limited to, gold and other metals price volatility, currency fluctuations, increased
production costs and variances in ore grade or recovery rates from those assumed in mining plans, political and operational
risks in the countries in which we operate, and governmental regulation and judicial outcomes. For a more detailed
discussion of such risks and other factors, see the Company’s 2006 Annual Report on Form 10-K, filed February 26, 2007
which is on file with the Securities and Exchange Commission, as well as the Company’s other SEC filings. The Company
does not undertake any obligation to release publicly revisions to any “forward-looking statement,” to reflect events or
circumstances after the date of this news release, or to reflect the occurrence of unanticipated events, except as may be
required under applicable securities laws.
Slide 2
3. Newmont -
A World Leading Gold Company
Only Major US Gold Company
Founded in 1921
Market Capitalization $19 Billion1
Only Gold Stock in the S&P 500 and Fortune 500
Highly Liquid Gold Stock Approximately $285 Million/Day1
29 Million Acres of Land in the World’s Best Gold Districts
Gold Price Leverage “No Gold Hedge” Philosophy
1. Market Capitalization based on 04/04/2007 share price of $43.45, 451 million shares outstanding and 6.6 million average
shares traded daily.
Slide 3
4. Newmont’s Gold Assets
Nevada Ghana
Peru Indonesia
• 5.9 Million Equity Gold Ounces Sold in 2006 from 11 Mine-sites Globally
• Over 29 Million Acres of Land in the World’s Best Gold Districts Slide 4
5. Ongoing Leverage
To Rising Gold Prices
$599 ~ Average Realized Gold Price +36% YoY
$900
2006
2006
$800 $791
$791
$700
146%
U.S. Dollars ($/oz for Margin)
$600
+146%
$500
44%
+44%
$400 2005
2006
2006
2005
$322
$322
$300
$295
$295 260%
+260% 2006
2005
$223
2006
2005
$204
$204
$223
$200
2005
$62
2005
$100 $62
$-
FY
YTD Cash Operating Margin Q4 Net income ($M) FY
YTD Net income ($M) Slide 5
($/oz)
7. 2006 Financial & Operating Summary
Financial (millions except per share) Q4 2006 Q4 2005 YE 2006 YE 2005
Revenues $1,460 $1,292 $4,987 $4,352
Net cash provided from continuing operations $435 $489 $1,237 $1,243
Income from continuing operations $215 $69 $840 $360
Income from continuing operations per common share $0.48 $0.16 $1.87 $0.81
Net Income1 $223 $62 $791 $322
Net income per common share $0.50 $0.14 $1.76 $0.72
Operating Q4 2006 Q4 2005 YE 2006 YE 2005
Consolidated gold sales (000 ounces)2 2,011 2,407 7,361 8,429
Equity gold sales (000 ounces)2, 3 1,716 1,799 5,870 6,493
Average realized gold price ($/ounce) $619 $472 $599 $441
Costs applicable to sales ($/ounce) $322 $232 $304 $237
Cash operating margin $297 $240 $295 $204
1. For items impacting Net income, please refer to the Company’s fourth quarter press release, issued February 22, 2007.
2. Includes 17,400 and 100,300 ounces (consolidated and equity) for the quarter and year ended December 31, 2006, respectively, and 22,100 ounces sold
(consolidated and equity) for the quarter and year ended December 31, 2005, from Phoenix and Leeville start-up activities which are not included in Revenue,
Costs applicable to sales and Depreciation, depletion and amortization per ounce calculations prior to commencing operations on October 1, 2006 and October 14,
2006, respectively. Revenues and costs during start-up are included in Other income, net.
Slide 7
3. Includes sales from the Holloway and Zarafshan discontinued operations.
8. Nevada
Guidance Q4 Q4 YE YE
NEVADA 2007 2006 2005 2006 2005
Consolidated gold sales (000 ounces) 2,350 - 2,550 887 652 2,534 2,444
Equity gold sales (000 ounces) 2,350 - 2,550 887 606 2,427 2,287
Consolidated costs applicable to sales ($/ounce) $375 - $400 $363 $352 $403 $333
Opportunities
First full year of commercial production at Leeville and Phoenix mines
Power plant construction and fleet reinvestment targeting cost savings
Investment in housing and technical schools to address labor shortages
Phoenix copper oxide potential
Challenges
Ongoing labor cost pressures
Higher diesel and power prices
Skilled and experienced labor
Slide 8
9. Peru
Guidance Q4 Q4 YE YE
YANACOCHA 2007 2006 2005 2006 2005
Consolidated gold sales (000 ounces) 1,500 – 1,600 439 1,063 2,572 3,328
Equity gold sales (000 ounces) 775 – 825 225 546 1,321 1,709
Consolidated costs applicable to sales ($/ounce) $340 - $360 $244 $145 $193 $147
Opportunities
Began construction of gold mill during 2006
Optimizing development plan for Conga
Yanacocha sulfides provide future upside
Challenges
Decreasing ore grades
Increasing stripping ratios
Slide 9
10. Australia/New Zealand
AUSTRALIA/NEW ZEALAND Guidance Q4 Q4 YE YE
2007 2006 2005 2006 2005
Consolidated gold sales (000 ounces) 1,275 – 1,325 347 397 1,350 1,601
Equity gold sales (000 ounces) 1,275 – 1,325 347 397 1,350 1,601
Consolidated costs applicable to sales ($/ounce) $445 - $470 $387 $315 $384 $317
Opportunities
Boddington project under construction
Boddington resource expansion drilling underway
Boddington moly circuit potential
Exploration upside at Callie underground and other regions
Challenges
Decreasing planned throughput and ore grades
Decreasing production at Pajingo as it nears end of mine life
Slide 10
11. Indonesia
Guidance Q4 Q4 YE YE
Batu Hijau 2007 2006 2005 2006 2005
Consolidated copper sales (M lbs) 395 - 435 147 129 435 573
Equity copper sales (M lbs) 210 – 230 78 68 230 303
Consolidated costs applicable to sales ($/lb Cu) $1.10 - $1.20 $0.64 $0.60 $0.71 $0.53
Consolidated gold sales (000 ozs) 435 - 475 169 181 435 721
Equity gold sales (000 ozs) 230 – 250 89 96 230 381
Consolidated costs applicable to sales ($/oz Au) $225 - $240 $192 $162 $209 $152
Opportunities
Stable production at a low-cost operation
Higher planned grades and throughput in 2007
Remaining copper hedges expire during first quarter 2007
Challenges
Higher stripping ratios/harder ores
Higher fuel, energy and consumable prices
Divestiture Slide 11
12. Ghana
Ahafo Guidance Q4 Q4 YE YE
2007 2006 2005 2006 2005
Consolidated gold sales (000 ozs) 410 – 450 125 - 202 -
Equity gold sales (000 ozs) 410 – 450 125 - 202 -
Consolidated costs applicable to sales ($/oz) $460 - $500 $326 - $297 -
Opportunities
First full year of commercial production at the Ahafo mine
Ahafo expansion opportunities
Akyem project
Challenges
Limited mill availability and higher cost as a result of nation-wide
power rationing
Higher anticipated labor and contract service expenditures
Slide 12
13. Projects Update
Power Plant, Nevada
Construction approximately 37% complete
Total capital between $610 - $640 million
Completion targeted for mid-2008
Gold Mill, Yanacocha in Peru
Construction approximately 38% complete
Total capital approximately $250 million
Initial production expected in 2008
Boddington Mine, Australia
Construction approximately 21% complete
Total capital approximating $0.9 - $1.1 billion
Initial production expected in late 2008 or early 2009
Akyem Mine, Ghana
Deferred pending permitting, optimization and feasibility study
Additional exploration drilling data underway
Development decision expected by end of 2007 Slide 13
15. Gold Industry - Declining Production
2,700 8.0
Mine Production
7.6
NEM Equity Production (oz/mm) 7.5
NEM Equity Production (oz mm)
Pre-Merger
Global Production (tonnes)
(5.5 mm ozs)
2,600 7.0
6.5
5.9
2,500 6.0
5.5
2,400 5.0
2001 2002 2003 2004 2005 2006
Source: GFMS Slide 15
16. 2007 Equity Gold Sales Guidance
2006 Actual to 2007 Guidance* Equity Gold Sales Variance
2006 Actual - Equity Gold Sales
Other
6.5 Ghana 6%
3%
Batu Hijau
4%
Nevada
0.02 41%
0.23 Australia/New
Zealand
0.01
23%
6.0 0.06 0.57
5.88
Ounces (million)
0.11
Yanacocha
23%
2007 Guidance* - Equity Gold Sales
5.5
Ghana
5.38
8%
Batu Hijau
5%
Nevada
Australia/New
47%
5.0 Zealand
25%
a
d
G
a
a
a
A
a
ch
ic
si
ic
an
si
07
06
er
r
A
ne
co
al
Af
20
20
m
al
Ze
do
na
A
r
nt
In
Ya
ew
th
Ce
or
/N
N
ia
al
tr
us
Yanacocha
A
15% Slide 16
* 2007 number based on mid-point of guidance
17. Gold Industry - Costs
$400
Total (%)
$350 2001 2006 change CAGR
Industry* $ 176 $ 317 80% 12%
Newmont $ 182 $ 304 67% 11%
$300
CAS ($/oz)
$250
$200
$150
$100
2001 2002 2003 2004 2005 2006
GFMS (Industry Avg) Barrick Anglo Ashanti Newmont
“Across the globe, producers have cited higher energy and fuel
charges, increasing labor costs, shortages of experienced contractors,
and higher operating consumables price.”
* Industry Cost based on 2007 Gold Survey - GFMS GFMS Survey 2006 – Update 1 Slide 17
18. 2007 Guidance: CAS
Costs Applicable to Sales ($/oz)
2006 Actual = $304
2007 Guidance ~ 25% higher than 2006
Change by Region
$600
% Increase by Cost Drivers 2007 Guidance CAS*
2006 CAS
$500
Diesel & Others
Electricity 3%
5%
$400
Consumbles
5%
$300
Labor &
Contract $200
Services
15%
$100
Production
72%
$0
Ahafo Australia/New Nevada Yanacocha Batu Hijau
Zealand
Slide 18
* 2007 number based on mid-point of guidance
19. Gold Industry –
Cost Escalation Trends
Industry Average Process Plant
Construction Costs (Source: Global Insights)
1.80
1.70
1.60
Index (2002 = 1.00)
1.50
1.40
1.30
1.20
1.10
1.00
0.90
2002 2003 2004 2005 2006
Equipment Steel Labor Total
Slide 19
22. Gold Reserves –
Fifth Consecutive Year Of Growth
2005 to 2006
Proven and Probable Equity Gold Reserves
95
2006 Reserve Sensitivity
93.2 7.4 7.9 93.9
Approximately 3% for
O u n c e s ( m illio n s )
90
every $25/oz change in
gold price between $450-
$550/oz.
85 1.5
2.0 3.7
80
Actual 2005 Depletion Zarafshan Revisions Acquisitions Additions Actual 2006
Slide 22
23. Newmont’s Reserve Growth
Track Record & Discovery Cycles
100 Ghana
29 Million Acres in
80
World Class Gold Districts Australia
South
America
60
Central Asia &
Indonesia
40 North
America
20
0
1985 1987 1989 1991 1993 1995 1997 1999 2001 2003 2005
Slide 23
24. 2007 Exploration Budget
Budget by Location Budget by Program
Diamonds 9%
Opportunity Fund North America
& Support 21% 24% Opportunity
Fund 9%
Tech Support/
Management 9% Near Mine
West Africa 10%
54%
China/SE Asia 2% Australia 14%
Turkey 2% Greenfields
20%
South America 28%
Near-Mine Programs: Carlin Trend in Nevada, Mexico, Yanacocha in Peru,
Sefwi Belt in Ghana, and Tanami in Australia
Greenfield Projects: Guiana Shield in South America, Andes in Peru, and
Greenstone Belts in West Africa
Slide 24
25. 2006 Merchant Banking Results
Royalty and Dividend Income
Royalty and Other Income: Record $120 million (+52% over 2005)
Equity Portfolio and Investment Growth
Market value of marketable securities portfolio: $1.4 billion
Alberta Heavy Oil Investment: $20 million investment $280 million sale proceeds
Canadian Oil Sands Trust: $268 million investment $800 million market value
Value Creation Investments
$152 million investment in Shore Gold Inc.’s FALC – Diamond Project
Other Assets - Iron Ore and Coal, Arctic Gas, Gold Refineries
Slide 25
26. Value Creation Investments
Gold Refineries
50% European Refineries, 40% Australian Refineries
Combined, refine and distribute >20% of world’s gold
Iron Ore
43.5% Euronimba Project, Guinea, West Africa
Partnered with BHP in world class project
Coal
100% Millmerran Deposit, Queensland, Australia
Thermal coal resource has high potential in current market
Gas
9% Hecla & Drake fields, Melville Island, Canada
Potential LNG application for largest gas field in N.A.
Slide 26
27. Committed Technical Expertise
Technical Services
80 person Research and Development Team
Proprietary Metallurgy labs, Mining Software, and Patents
Highest R&D and Technical Focus of Any Gold Producer
Projects Group
Expertise and Capacity Across Full Range of Projects
Institutionalized Stage Gate Process
Exploration Group
325 Full-Time geoscientists
Proprietary Geochemical and Geophysical Capacity
Proprietary Global Geological Information System
Proprietary Portfolio and Targeting System
Slide 27
29. The Gold Company Of Choice
For A Gold Bull Market
Fifth Consecutive Year of Reserve Growth
Growing Operating Margins (+44% in 2006)
Building New Lower-cost Mines
Balanced Global Portfolio
Strong, Liquid Balance Sheet
Institutional Quality Investment
“No Gold Hedging” Philosophy
Slide 29