SlideShare a Scribd company logo
Новые суммарные отчеты RIQAS для межлабораторных групп и суммарные отчеты по группе приборов
RIQAS представляет новые суммарные отчеты для межлабораторных групп и отчеты по группе приборов, которые позволяют
соответствующим специалистам, используя один отчет, легко идентифицировать приборы и участников группы, имеющих низкие
показатели качества.
COAGULATION Performance Summary: %Deviation Cycle: 6 Sample: 6 16/06/2014
Summary Interlaboratory Group Report Group: Randox
1
PT as an INR
%Deviation Summary Allowable %Deviation = 16.3%
Participant Name Registration Name 9 10 11 12 1 2 3 4 5 6 RM%DEV Lab. Ref.
Randox Laboratories Lab A 11.6 10.7 7.9 2.8 -0.3 -2.1 -2.3 -2.4 7.4 -8.1 2.5 12338/A
Randox Laboratories Lab A Inst 2 -7.8 -7.2 -15.3 -2.4 -8.1 -0.3 -9.2 -3.8 -1.0 6.0 -4.9 12338/J
Randox Laboratories Lab A BFT II R -4.6 -10.5 -6.1 -14.0 16.2 16.0 14.8 -5.5 12338/M
Randox Laboratories Lab A Sysmex CA500 -1.1C -0.5 2.8 4.6 7.5 -3.1 5.3 1.8 4.2 5.8 12338/O
Randox Laboratories Lab B Inst 1 5.9 -11.6 -7.5 22.0 -4.8 14.0 -10.8 -1.3 237024/E
Randox Laboratories Lab B Inst 2 -8.2 -5.9 -3.2 -3.3 -2.1 -4.2 -4.5 -3.4 5.6 4.2 -2.5 237024/F
Randox Laboratories Lab B Inst 3 -1.9 -5.4 3.0 0.8 -1.2 2.2 8.0 7.2 0.4 -7.2 0.6 237024/H
Randox Laboratories Lab B Sysmex CA 560 16.7 -5.7 -0.4 1.6 -0.3 -1.2 3.0 -0.6 -1.3 Too Few 237024/T
2
3
PT in seconds
%Deviation Summary Allowable %Deviation = 16.3%
Participant Name Registration Name 9 10 11 12 1 2 3 4 5 6 RM%DEV Lab. Ref.
Randox Laboratories Lab A 5.5 2.3 3.3 0.3 -0.3 -2.9 -1.6 -2.4 7.6 -5.1 0.7 12338/A
Randox Laboratories Lab A Inst 2 4.4 -2.5 -5.4 2.4 -5.0 5.1 -4.2 -0.7 2.1 4.5 0.1 12338/J
Randox Laboratories Lab A BFT II -20.9 12.6 3.2 6.5 -1.0 18.4 24.5 24.3 3.2 12338/M
Randox Laboratories Lab A Sysmex CA500 2.5 -0.8 0.3 0.9 6.0 -2.1 4.9 1.7 2.9 1.6 12338/O
Randox Laboratories Lab B Inst 1 5.6 -12.2 -7.8 22.9 -3.5 18.7 -6.9 -0.1 237024/E
Randox Laboratories Lab B Inst 2 -1.0 -2.1 2.1 -0.6 -0.3 0.0 -2.1 1.2 3.4 1.5 0.2 237024/F
Randox Laboratories Lab B Inst 3 -2.3 -5.4 3.7 -1.5 -3.1 0.0 6.6 6.7 0.9 -7.5 -0.2 237024/H
Randox Laboratories Lab B Sysmex CA 560 0.8 -5.4 1.5 0.9 2.1 -0.3 4.9 3.8 4.8 Too Few 237024/T
Group: Randox
COAGULATION Performance Summary: %Deviation Cycle: 6 Sample: 6 16/06/2014
Summary Interlaboratory Group Report
1 Заголовок отчета
Заголовок отчета – указывает, является ли данный отчет отчетом для межлабораторных групп, или отчетом по группе приборов, а
также название группы, программу, текущий цикл, образец и финальную дату отправки результатов для данного образца.
включает название аналита, допустимое смещение (% Deviation, обычно в виде параметра TDPA – целевое отклонение для
оценки качества) и содержит такую информацию, как название лаборатории, референсный номер лаборатории и буквенный
идентификатор регистрационной записи (/A, /B и т.д.). Для каждой регистрационной записи представлена статистика по
% отклонения (от среднего для сравнения) за последние 10 образцов и скользящее среднее % отклонения (Running Mean
% Deviation). Красным цветом выделены результаты, которые выходят за допустимый предел отклонения, делая простым
определение того, являются ли проблемы с качеством случайными или систематическими.
PT as an INR
%Deviation Summary Allowable %Deviation = 16.3%
Participant Name Registration Name 9 10 11 12 1 2 3 4 5 6 RM%DEV Lab. Ref.
Randox Laboratories Lab A 11.6 10.7 7.9 2.8 -0.3 -2.1 -2.3 -2.4 7.4 -8.1 2.5 12338/A
Randox Laboratories Lab A Inst 2 -7.8 -7.2 -15.3 -2.4 -8.1 -0.3 -9.2 -3.8 -1.0 6.0 -4.9 12338/J
Randox Laboratories Lab A BFT II R -4.6 -10.5 -6.1 -14.0 16.2 16.0 14.8 -5.5 12338/M
Randox Laboratories Lab A Sysmex CA500 -1.1C -0.5 2.8 4.6 7.5 -3.1 5.3 1.8 4.2 5.8 12338/O
Randox Laboratories Lab B Inst 1 5.9 -11.6 -7.5 22.0 -4.8 14.0 -10.8 -1.3 237024/E
Randox Laboratories Lab B Inst 2 -8.2 -5.9 -3.2 -3.3 -2.1 -4.2 -4.5 -3.4 5.6 4.2 -2.5 237024/F
Randox Laboratories Lab B Inst 3 -1.9 -5.4 3.0 0.8 -1.2 2.2 8.0 7.2 0.4 -7.2 0.6 237024/H
Randox Laboratories Lab B Sysmex CA 560 16.7 -5.7 -0.4 1.6 -0.3 -1.2 3.0 -0.6 -1.3 Too Few 237024/T
2 Таблица отчета
Lab. Ref.
12338/A
12338/J
12338/M
12338/O
237024/E
237024/F
237024/H
237024/T
3 График отчета
представленлинейнымграфиком,отображающим
в графическом виде данные из таблицы. Цветные
линии представляют каждую из регистрационных
записей, что позволяет легко проводить
визуальную идентификацию участников группы/
приборы, демонстрирующие низкий уровень
качества. Область за пределами допустимого
% отклонения обозначена на графике красной
зоной.
Каждая таблица и график в отчете может отображать до 15 регистрационных записей. Группы, имеющих более 15
регистрационных записей, делятся на несколько таблиц и графиков, включающих максимально до 15 записей в каждой.
Старый формат отчетов для группы приборов и межлабораторных групп по-прежнему доступен, и участники,
зарегистрированные в настоящее время на эти отчеты будут автоматически получать новые отчеты в электронном виде. Если,
тем не менее, требуются печатные версии отчетов, пожалуйста, свяжитесь по электронной почте mail@riqas.com и укажите
Ваш референсный номер лаборатории, или название группы и необходимое число копий отчетов. Мы призываем участников
использовать электронные версии отчетов, поскольку печатные версии доступны только в черно-белом варианте.
Directors: Dr S P FitzGerald CBE FREng Bsc PhD DSc (Hons) FIAE Man, R P Kelly BSc FCA.
Information correct at time of print. Randox Laboratories Limited is a subsidiary of Randox Holdings Limited a company registered within Northern Ireland with company number N.I. 614690. VAT Registered Number: GB 151 6827 08. Product availability may vary from country to country. Please contact
your local Randox representative for information. Products may be for Research Use Only and not for use in diagnostic procedures in the USA.
Randox Laboratories Limited, 55 Diamond Road, Crumlin, County Antrim, BT29 4QY, United Kingdom
+44 (0) 28 9445 4399 +44 (0) 28 9445 4398 mail@riqas.com riqas.com

More Related Content

Viewers also liked

New summary interlaboratory & summary instrument group reports mar15 svk
New summary interlaboratory & summary instrument group reports mar15 svkNew summary interlaboratory & summary instrument group reports mar15 svk
New summary interlaboratory & summary instrument group reports mar15 svk
Randox
 

Viewers also liked (15)

Designing an appropriate qc design procedure for your lab 5 mar15
Designing an appropriate qc design procedure for your lab 5 mar15Designing an appropriate qc design procedure for your lab 5 mar15
Designing an appropriate qc design procedure for your lab 5 mar15
 
Consolidate & Save
Consolidate & SaveConsolidate & Save
Consolidate & Save
 
ACB Focus 2015 Poster
ACB Focus 2015 PosterACB Focus 2015 Poster
ACB Focus 2015 Poster
 
New summary interlaboratory & summary instrument group reports mar15 svk
New summary interlaboratory & summary instrument group reports mar15 svkNew summary interlaboratory & summary instrument group reports mar15 svk
New summary interlaboratory & summary instrument group reports mar15 svk
 
What format is best for your laboratory
What format is best for your laboratoryWhat format is best for your laboratory
What format is best for your laboratory
 
Improving Laboratory Performance Through QC - Commutability
Improving Laboratory Performance Through QC - CommutabilityImproving Laboratory Performance Through QC - Commutability
Improving Laboratory Performance Through QC - Commutability
 
The Importance of Third Party Controls
The Importance of Third Party ControlsThe Importance of Third Party Controls
The Importance of Third Party Controls
 
Basic QC Statistics - Improving Laboratory Performance Through Quality Contro...
Basic QC Statistics - Improving Laboratory Performance Through Quality Contro...Basic QC Statistics - Improving Laboratory Performance Through Quality Contro...
Basic QC Statistics - Improving Laboratory Performance Through Quality Contro...
 
Using QC Multi-rules
Using QC Multi-rulesUsing QC Multi-rules
Using QC Multi-rules
 
QC Multi rules - Improving Laboratory Performance Through Quality Control
QC Multi rules - Improving Laboratory Performance Through Quality ControlQC Multi rules - Improving Laboratory Performance Through Quality Control
QC Multi rules - Improving Laboratory Performance Through Quality Control
 
Quality Control for Point of Care Testing - White Paper
Quality Control for Point of Care Testing - White PaperQuality Control for Point of Care Testing - White Paper
Quality Control for Point of Care Testing - White Paper
 
Step by Step Guide to Preparing QC
Step by Step Guide to Preparing QCStep by Step Guide to Preparing QC
Step by Step Guide to Preparing QC
 
White Paper Quality Control for Point of Care Testing
White Paper Quality Control for Point of Care TestingWhite Paper Quality Control for Point of Care Testing
White Paper Quality Control for Point of Care Testing
 
Acusera Verify Presentation
Acusera Verify PresentationAcusera Verify Presentation
Acusera Verify Presentation
 
EQA: An Essential Tool for Laboratory Quality - Africa LT649
EQA: An Essential Tool for Laboratory Quality - Africa LT649 EQA: An Essential Tool for Laboratory Quality - Africa LT649
EQA: An Essential Tool for Laboratory Quality - Africa LT649
 

More from Randox

More from Randox (14)

How to establish QC reference ranges - Randox QC Educational Guide
How to establish QC reference ranges - Randox QC Educational GuideHow to establish QC reference ranges - Randox QC Educational Guide
How to establish QC reference ranges - Randox QC Educational Guide
 
Acusera Third Party Controls
Acusera Third Party ControlsAcusera Third Party Controls
Acusera Third Party Controls
 
Acusera 24.7 QC Data Management
Acusera 24.7 QC Data ManagementAcusera 24.7 QC Data Management
Acusera 24.7 QC Data Management
 
Acusera 24.7 Interlaboratory Data Management - June 17 LT244
Acusera 24.7 Interlaboratory Data Management - June 17 LT244Acusera 24.7 Interlaboratory Data Management - June 17 LT244
Acusera 24.7 Interlaboratory Data Management - June 17 LT244
 
Acusera Verify Linearity Verification - June 17 LT674
Acusera Verify Linearity Verification - June 17 LT674Acusera Verify Linearity Verification - June 17 LT674
Acusera Verify Linearity Verification - June 17 LT674
 
LT033 RIQAS Explained MAY17
LT033 RIQAS Explained MAY17LT033 RIQAS Explained MAY17
LT033 RIQAS Explained MAY17
 
LT027 Acusera Third Party Controls May17
LT027 Acusera Third Party Controls May17LT027 Acusera Third Party Controls May17
LT027 Acusera Third Party Controls May17
 
RIQAS Calendar 2017
RIQAS Calendar 2017RIQAS Calendar 2017
RIQAS Calendar 2017
 
ISO 15189 Accreditation Guide - Improving Laboratory Performance Through Qual...
ISO 15189 Accreditation Guide - Improving Laboratory Performance Through Qual...ISO 15189 Accreditation Guide - Improving Laboratory Performance Through Qual...
ISO 15189 Accreditation Guide - Improving Laboratory Performance Through Qual...
 
FOCUS 2016 Poster: Specific Proteins
FOCUS 2016 Poster: Specific ProteinsFOCUS 2016 Poster: Specific Proteins
FOCUS 2016 Poster: Specific Proteins
 
How to Measure Uncertainty
How to Measure UncertaintyHow to Measure Uncertainty
How to Measure Uncertainty
 
Troubleshooting QC Problems: Your QC has failed, what do you do next?
Troubleshooting QC Problems: Your QC has failed, what do you do next?Troubleshooting QC Problems: Your QC has failed, what do you do next?
Troubleshooting QC Problems: Your QC has failed, what do you do next?
 
Monitoring EQA/PT Performance (Polish)
Monitoring EQA/PT Performance (Polish)Monitoring EQA/PT Performance (Polish)
Monitoring EQA/PT Performance (Polish)
 
Improving Laboratory Performance Through Quality Control - The role of EQA in...
Improving Laboratory Performance Through Quality Control - The role of EQA in...Improving Laboratory Performance Through Quality Control - The role of EQA in...
Improving Laboratory Performance Through Quality Control - The role of EQA in...
 

New summary interlaboratory & summary instrument group reports mar15 rus

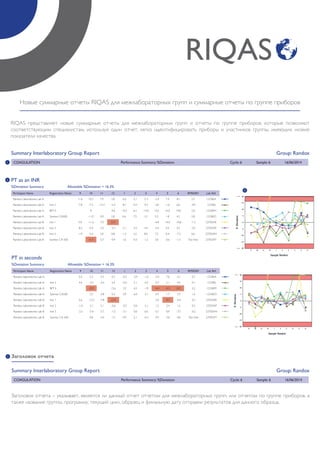
  • 1. Новые суммарные отчеты RIQAS для межлабораторных групп и суммарные отчеты по группе приборов RIQAS представляет новые суммарные отчеты для межлабораторных групп и отчеты по группе приборов, которые позволяют соответствующим специалистам, используя один отчет, легко идентифицировать приборы и участников группы, имеющих низкие показатели качества. COAGULATION Performance Summary: %Deviation Cycle: 6 Sample: 6 16/06/2014 Summary Interlaboratory Group Report Group: Randox 1 PT as an INR %Deviation Summary Allowable %Deviation = 16.3% Participant Name Registration Name 9 10 11 12 1 2 3 4 5 6 RM%DEV Lab. Ref. Randox Laboratories Lab A 11.6 10.7 7.9 2.8 -0.3 -2.1 -2.3 -2.4 7.4 -8.1 2.5 12338/A Randox Laboratories Lab A Inst 2 -7.8 -7.2 -15.3 -2.4 -8.1 -0.3 -9.2 -3.8 -1.0 6.0 -4.9 12338/J Randox Laboratories Lab A BFT II R -4.6 -10.5 -6.1 -14.0 16.2 16.0 14.8 -5.5 12338/M Randox Laboratories Lab A Sysmex CA500 -1.1C -0.5 2.8 4.6 7.5 -3.1 5.3 1.8 4.2 5.8 12338/O Randox Laboratories Lab B Inst 1 5.9 -11.6 -7.5 22.0 -4.8 14.0 -10.8 -1.3 237024/E Randox Laboratories Lab B Inst 2 -8.2 -5.9 -3.2 -3.3 -2.1 -4.2 -4.5 -3.4 5.6 4.2 -2.5 237024/F Randox Laboratories Lab B Inst 3 -1.9 -5.4 3.0 0.8 -1.2 2.2 8.0 7.2 0.4 -7.2 0.6 237024/H Randox Laboratories Lab B Sysmex CA 560 16.7 -5.7 -0.4 1.6 -0.3 -1.2 3.0 -0.6 -1.3 Too Few 237024/T 2 3 PT in seconds %Deviation Summary Allowable %Deviation = 16.3% Participant Name Registration Name 9 10 11 12 1 2 3 4 5 6 RM%DEV Lab. Ref. Randox Laboratories Lab A 5.5 2.3 3.3 0.3 -0.3 -2.9 -1.6 -2.4 7.6 -5.1 0.7 12338/A Randox Laboratories Lab A Inst 2 4.4 -2.5 -5.4 2.4 -5.0 5.1 -4.2 -0.7 2.1 4.5 0.1 12338/J Randox Laboratories Lab A BFT II -20.9 12.6 3.2 6.5 -1.0 18.4 24.5 24.3 3.2 12338/M Randox Laboratories Lab A Sysmex CA500 2.5 -0.8 0.3 0.9 6.0 -2.1 4.9 1.7 2.9 1.6 12338/O Randox Laboratories Lab B Inst 1 5.6 -12.2 -7.8 22.9 -3.5 18.7 -6.9 -0.1 237024/E Randox Laboratories Lab B Inst 2 -1.0 -2.1 2.1 -0.6 -0.3 0.0 -2.1 1.2 3.4 1.5 0.2 237024/F Randox Laboratories Lab B Inst 3 -2.3 -5.4 3.7 -1.5 -3.1 0.0 6.6 6.7 0.9 -7.5 -0.2 237024/H Randox Laboratories Lab B Sysmex CA 560 0.8 -5.4 1.5 0.9 2.1 -0.3 4.9 3.8 4.8 Too Few 237024/T Group: Randox COAGULATION Performance Summary: %Deviation Cycle: 6 Sample: 6 16/06/2014 Summary Interlaboratory Group Report 1 Заголовок отчета Заголовок отчета – указывает, является ли данный отчет отчетом для межлабораторных групп, или отчетом по группе приборов, а также название группы, программу, текущий цикл, образец и финальную дату отправки результатов для данного образца.
  • 2. включает название аналита, допустимое смещение (% Deviation, обычно в виде параметра TDPA – целевое отклонение для оценки качества) и содержит такую информацию, как название лаборатории, референсный номер лаборатории и буквенный идентификатор регистрационной записи (/A, /B и т.д.). Для каждой регистрационной записи представлена статистика по % отклонения (от среднего для сравнения) за последние 10 образцов и скользящее среднее % отклонения (Running Mean % Deviation). Красным цветом выделены результаты, которые выходят за допустимый предел отклонения, делая простым определение того, являются ли проблемы с качеством случайными или систематическими. PT as an INR %Deviation Summary Allowable %Deviation = 16.3% Participant Name Registration Name 9 10 11 12 1 2 3 4 5 6 RM%DEV Lab. Ref. Randox Laboratories Lab A 11.6 10.7 7.9 2.8 -0.3 -2.1 -2.3 -2.4 7.4 -8.1 2.5 12338/A Randox Laboratories Lab A Inst 2 -7.8 -7.2 -15.3 -2.4 -8.1 -0.3 -9.2 -3.8 -1.0 6.0 -4.9 12338/J Randox Laboratories Lab A BFT II R -4.6 -10.5 -6.1 -14.0 16.2 16.0 14.8 -5.5 12338/M Randox Laboratories Lab A Sysmex CA500 -1.1C -0.5 2.8 4.6 7.5 -3.1 5.3 1.8 4.2 5.8 12338/O Randox Laboratories Lab B Inst 1 5.9 -11.6 -7.5 22.0 -4.8 14.0 -10.8 -1.3 237024/E Randox Laboratories Lab B Inst 2 -8.2 -5.9 -3.2 -3.3 -2.1 -4.2 -4.5 -3.4 5.6 4.2 -2.5 237024/F Randox Laboratories Lab B Inst 3 -1.9 -5.4 3.0 0.8 -1.2 2.2 8.0 7.2 0.4 -7.2 0.6 237024/H Randox Laboratories Lab B Sysmex CA 560 16.7 -5.7 -0.4 1.6 -0.3 -1.2 3.0 -0.6 -1.3 Too Few 237024/T 2 Таблица отчета Lab. Ref. 12338/A 12338/J 12338/M 12338/O 237024/E 237024/F 237024/H 237024/T 3 График отчета представленлинейнымграфиком,отображающим в графическом виде данные из таблицы. Цветные линии представляют каждую из регистрационных записей, что позволяет легко проводить визуальную идентификацию участников группы/ приборы, демонстрирующие низкий уровень качества. Область за пределами допустимого % отклонения обозначена на графике красной зоной. Каждая таблица и график в отчете может отображать до 15 регистрационных записей. Группы, имеющих более 15 регистрационных записей, делятся на несколько таблиц и графиков, включающих максимально до 15 записей в каждой. Старый формат отчетов для группы приборов и межлабораторных групп по-прежнему доступен, и участники, зарегистрированные в настоящее время на эти отчеты будут автоматически получать новые отчеты в электронном виде. Если, тем не менее, требуются печатные версии отчетов, пожалуйста, свяжитесь по электронной почте mail@riqas.com и укажите Ваш референсный номер лаборатории, или название группы и необходимое число копий отчетов. Мы призываем участников использовать электронные версии отчетов, поскольку печатные версии доступны только в черно-белом варианте. Directors: Dr S P FitzGerald CBE FREng Bsc PhD DSc (Hons) FIAE Man, R P Kelly BSc FCA. Information correct at time of print. Randox Laboratories Limited is a subsidiary of Randox Holdings Limited a company registered within Northern Ireland with company number N.I. 614690. VAT Registered Number: GB 151 6827 08. Product availability may vary from country to country. Please contact your local Randox representative for information. Products may be for Research Use Only and not for use in diagnostic procedures in the USA. Randox Laboratories Limited, 55 Diamond Road, Crumlin, County Antrim, BT29 4QY, United Kingdom +44 (0) 28 9445 4399 +44 (0) 28 9445 4398 mail@riqas.com riqas.com