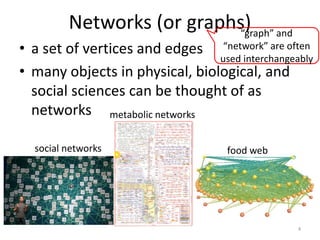
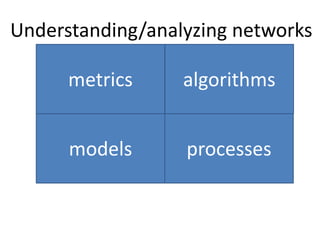
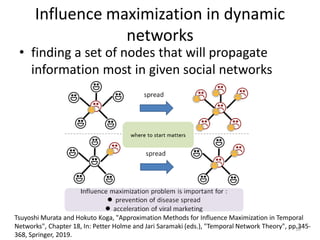
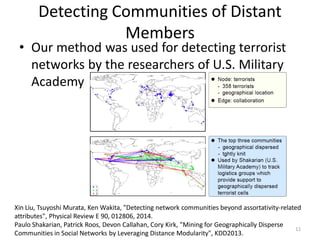
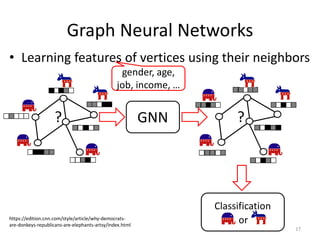
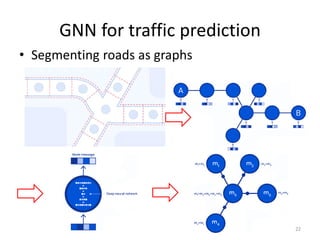
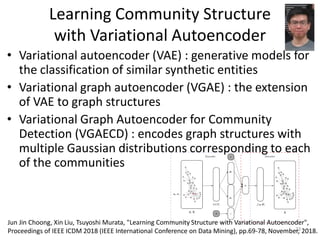
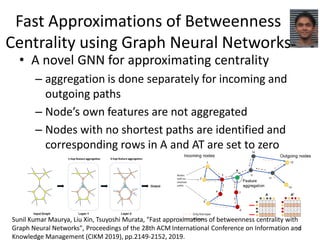
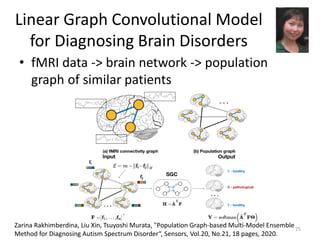
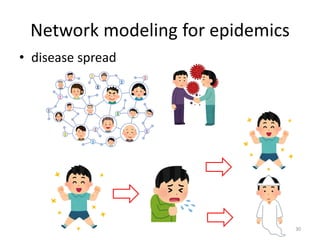
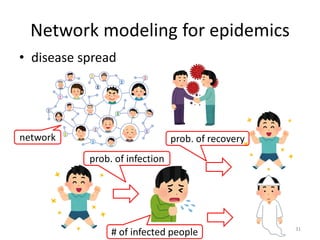
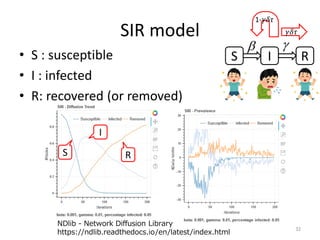
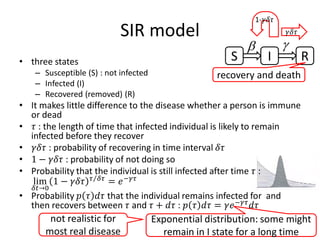
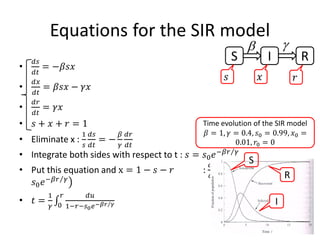
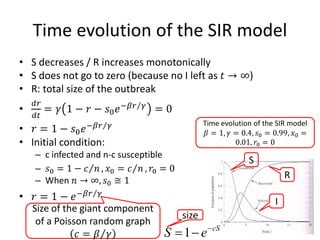
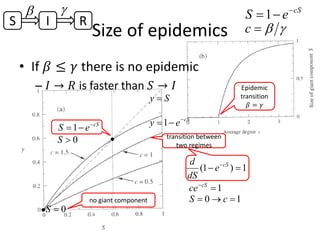
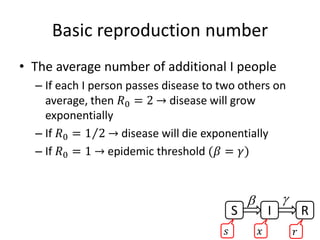
Networks, Deep Learning
(and COVID-19)
Tsuyoshi Murata
Department of Computer Science
School of Computing
Tokyo Institute of Technology
murata@c.titech.ac.jp
http://www.net.c.titech.ac.jp/
The Tenth Workshop on Computation: Theory and Practice (WCTP 2020) Nov. 21(Sat) 2020
Table of contents
• Networks (graphs)
• Networks + Deep Learning
• Networks + Deep Learning + COVID-19
2
Table of contents
• Networks (graphs)
• Networks + Deep Learning
• Networks + Deep Learning + COVID-19
3
Networks (or graphs)
• a set of vertices and edges
• many objects in physical, biological, and
social sciences can be thought of as
networks
4
social networks
metabolic networks
food web
“graph” and
“network” are often
used interchangeably
Understanding/analyzing networks
metrics
models processes
algorithms
Understanding/analyzing networks
metrics
models processes
algorithms
path length, density,
diameter, degree
distribution, clustering
coefficient, …
Dijkstra's algorithm,
graph partitioning,
centrality computation,
…
random network, scale-
free network, small-world
network, power law,
configuration model, …
rumor/disease diffusion,
influence maximization /
minimization, SI model,
SIR model, …
Topics
• Community detection
• Link prediction
• Centrality (ranking)
• Influence maximization
• …
7
https://link.springer.com/article/10.1007/s11042-020-08700-4
https://www.nature.com/articles/s41598-019-57304-y
https://www2.slideshare.net/tom.zimmermann/changes-and-
bugs-mining-and-predicting-development-activities/19-
CentralityDegree_Closeness_BetweennessBlue_binary_has
https://link.springer.com/referenceworkent
ry/10.1007%2F978-1-4939-7131-2_110197
Networks can be
huge, incomplete,
noisy, directed,
weighted, signed,
temporal, …
Community detection in signed
networks
8
• two types of edges: friendship and hostility
• Detection of nested communities (which often
appears in real social networks)
Tsuyoshi Murata, Takahiko Sugihara, and Talel Abdessalem, "Community Detection in Signed Networks
Based on Extended Signed Modularity", Proceedings of the 8th Conference on Complex Networks
(CompleNet 2017), Springer, 2017.
Transductive classification on
heterogeneous networks
• the labels of some vertices are given -> classify
the labels of the remaining vertices
9
Phiradet Bangcharoensap, Tsuyoshi Murata, Hayato Kobayashi, Nobuyuki Shimizu, “Transductive
Classification on Heterogeneous Information Networks with Edge Betweenness-based Normalization”,
Proceedings of the 9th ACM International Conference on Web Search and Data Mining (WSDM2016),
pp.437-446, 2016.
Influence maximization in dynamic
networks
• finding a set of nodes that will propagate
information most in given social networks
10
Tsuyoshi Murata and Hokuto Koga, "Approximation Methods for Influence Maximization in Temporal
Networks", Chapter 18, In: Petter Holme and Jari Saramaki (eds.), "Temporal Network Theory", pp.345-
368, Springer, 2019.
Detecting Communities of Distant
Members
11
Xin Liu, Tsuyoshi Murata, Ken Wakita, "Detecting network communities beyond assortativity-related
attributes", Physical Review E 90, 012806, 2014.
Paulo Shakarian, Patrick Roos, Devon Callahan, Cory Kirk, "Mining for Geographically Disperse
Communities in Social Networks by Leveraging Distance Modularity", KDD2013.
• Our method was used for detecting terrorist
networks by the researchers of U.S. Military
Academy
Reference (Networks)
• Networks (second edition), Mark Newman,
Oxford University Press, 2018.
https://global.oup.com/academic/product/net
works-9780198805090
Table of contents
• Networks (graphs)
• Networks + Deep Learning
• Networks + Deep Learning + COVID-19
13
Deep Learning
Image recognition Voice recognition Natural Language
Processing
14
Convolutional neural networks
• Recognizing local features -> global features
https://towardsdatascience.com/a-comprehensive-guide-to-convolutional-neural-networks-the-eli5-way-3bd2b1164a53
15
Convolution works for images,
sentences, and networks
• Images: grid of pixels
• Sentences: sequences of words
• Networks:
– Number of neighbors is not fixed
– Topologically complex
– Vertices are not ordered
16
Graph Neural Networks
• Learning features of vertices using their neighbors
GNN
Classification
17
gender, age,
job, income, …
https://edition.cnn.com/style/article/why-democrats-
are-donkeys-republicans-are-elephants-artsy/index.html
? ?
or
Machine learning tasks
• classification
• regression
• clustering
• dimensionality reduction
regression
f(x)=ax3+…
clustering
group 1
group 2
dimensionality
reduction
classification
18
Machine learning tasks for graphs
• Node classification
• Graph classification
• Link prediction
• Graph generation model for
generating
graphs
19
Applications of Graph Neural
Networks
• Computer vision
– scene graph generation (input : images, output:
objects and semantic relations)
– realistic image generation (input: scene graph,
output: images)
• Recommender systems
– recommendation as link prediction (input: items &
users, output: missing links)
• Traffic
– Forecast of traffic speed (input: sensors on roads and
the distances, output: traffic speed and volume)
• Chemistry
– classification of molecular graphs (atoms = nodes,
bonds = edges)
Graph Neural Networks: A Review of Methods and Applications
https://arxiv.org/abs/1812.08434
20
DeepMind article (Sept. 2020)
• Traffic prediction with advanced Graph Neural
Networks
– https://deepmind.com/blog/article/traffic-
prediction-with-advanced-graph-neural-networks
21
GNN for traffic prediction
• Segmenting roads as graphs
22
Learning Community Structure
with Variational Autoencoder
• Variational autoencoder (VAE) : generative models for
the classification of similar synthetic entities
• Variational graph autoencoder (VGAE) : the extension
of VAE to graph structures
• Variational Graph Autoencoder for Community
Detection (VGAECD) : encodes graph structures with
multiple Gaussian distributions corresponding to each
of the communities
23
Jun Jin Choong, Xin Liu, Tsuyoshi Murata, "Learning Community Structure with Variational Autoencoder",
Proceedings of IEEE ICDM 2018 (IEEE International Conference on Data Mining), pp.69-78, November, 2018.
Fast Approximations of Betweenness
Centrality using Graph Neural Networks
• A novel GNN for approximating centrality
– aggregation is done separately for incoming and
outgoing paths
– Node’s own features are not aggregated
– Nodes with no shortest paths are identified and
corresponding rows in A and AT are set to zero
24
Sunil Kumar Maurya, Liu Xin, Tsuyoshi Murata, "Fast approximations of betweenness centrality with
Graph Neural Networks", Proceedings of the 28th ACM International Conference on Information and
Knowledge Management (CIKM 2019), pp.2149-2152, 2019.
Linear Graph Convolutional Model
for Diagnosing Brain Disorders
25
• fMRI data -> brain network -> population
graph of similar patients
Zarina Rakhimberdina, Liu Xin, Tsuyoshi Murata, "Population Graph-based Multi-Model Ensemble
Method for Diagnosing Autism Spectrum Disorder“, Sensors, Vol.20, No.21, 18 pages, 2020.
Reference (Graph Neural Networks)
• “Graph Neural Networks: Models and
Applications” (tutorial of AAAI 2020)
• https://cse.msu.edu/~mayao4/tutorials/aaai2
020/
26
Table of contents
• Networks (graphs)
• Networks + Deep Learning
• Networks + Deep Learning + COVID-19
27
Table of contents
• Networks (graphs)
• Networks + Deep Learning
• Networks + Deep Learning + COVID-19
– Networks + COVID-19
– Networks + Deep Learning + COVID-19
28
Table of contents
• Networks (graphs)
• Networks + Deep Learning
• Networks + Deep Learning + COVID-19
– Networks + COVID-19
– Networks + Deep Learning + COVID-19
29
Network modeling for epidemics
• disease spread
30
Network modeling for epidemics
• disease spread
31
network
# of infected people
prob. of infection
prob. of recovery
SIR model
• S : susceptible
• I : infected
• R: recovered (or removed)
32
S I R
β γ
𝛾𝛾𝛾𝛾𝛾𝛾
1-𝛾𝛾𝛾𝛾𝛾𝛾
S
I
R
NDlib - Network Diffusion Library
https://ndlib.readthedocs.io/en/latest/index.html
SIR model
• three states
– Susceptible (S) : not infected
– Infected (I)
– Recovered (removed) (R)
• It makes little difference to the disease whether a person is immune
or dead
• 𝜏𝜏 : the length of time that infected individual is likely to remain
infected before they recover
• 𝛾𝛾𝛾𝛾𝜏𝜏 : probability of recovering in time interval 𝛿𝛿𝛿𝛿
• 1 − 𝛾𝛾𝛾𝛾𝛾𝛾 : probability of not doing so
• Probability that the individual is still infected after time 𝜏𝜏 :
lim
𝛿𝛿𝑡𝑡→0
1 − 𝛾𝛾𝛾𝛾𝛾𝛾 ⁄𝜏𝜏 𝛿𝛿𝛿𝛿
= 𝑒𝑒−𝛾𝛾𝛾𝛾
• Probability 𝑝𝑝 𝜏𝜏 𝑑𝑑𝜏𝜏 that the individual remains infected for and
then recovers between 𝜏𝜏 and 𝜏𝜏 + 𝑑𝑑𝜏𝜏 : 𝑝𝑝 𝜏𝜏 𝑑𝑑𝜏𝜏 = 𝛾𝛾𝑒𝑒−𝛾𝛾𝛾𝛾
𝑑𝑑𝜏𝜏
S I R
recovery and death
β γ
𝛾𝛾𝛾𝛾𝛾𝛾
1-𝛾𝛾𝛾𝛾𝛾𝛾
Exponential distribution: some might
remain in I state for a long time
not realistic for
most real disease
Equations for the SIR model
•
𝑑𝑑𝑑𝑑
𝑑𝑑𝑑𝑑
= −𝛽𝛽𝑠𝑠𝑠𝑠
•
𝑑𝑑𝑑𝑑
𝑑𝑑𝑑𝑑
= 𝛽𝛽𝑠𝑠𝑠𝑠 − 𝛾𝛾𝑥𝑥
•
𝑑𝑑𝑟𝑟
𝑑𝑑𝑑𝑑
= 𝛾𝛾𝑥𝑥
• 𝑠𝑠 + 𝑥𝑥 + 𝑟𝑟 = 1
• Eliminate x :
1
𝑠𝑠
𝑑𝑑𝑑𝑑
𝑑𝑑𝑑𝑑
= −
𝛽𝛽
𝛾𝛾
𝑑𝑑𝑑𝑑
𝑑𝑑𝑑𝑑
• Integrate both sides with respect to t : 𝑠𝑠 = 𝑠𝑠0 𝑒𝑒 ⁄−𝛽𝛽𝑟𝑟 𝛾𝛾
• Put this equation and x = 1 − 𝑠𝑠 − 𝑟𝑟 :
𝑑𝑑𝑑𝑑
𝑑𝑑𝑑𝑑
= 𝛾𝛾�
�
1 − 𝑟𝑟 −
𝑠𝑠0 𝑒𝑒 ⁄−𝛽𝛽𝑟𝑟 𝛾𝛾
• 𝑡𝑡 =
1
𝛾𝛾
∫0
𝑟𝑟 𝑑𝑑𝑑𝑑
1−𝑟𝑟−𝑠𝑠0 𝑒𝑒 ⁄−𝛽𝛽𝑟𝑟 𝛾𝛾
S I R
𝑠𝑠
β γ
𝑥𝑥 𝑟𝑟
S
R
I
Time evolution of the SIR model
𝛽𝛽 = 1, 𝛾𝛾 = 0.4, 𝑠𝑠0 = 0.99, 𝑥𝑥0 =
0.01, 𝑟𝑟0 = 0
Time evolution of the SIR model
• S decreases / R increases monotonically
• S does not go to zero (because no I left as 𝑡𝑡 → ∞)
• R: total size of the outbreak
•
𝑑𝑑𝑑𝑑
𝑑𝑑𝑑𝑑
= 𝛾𝛾 1 − 𝑟𝑟 − 𝑠𝑠0 𝑒𝑒 ⁄−𝛽𝛽𝑟𝑟 𝛾𝛾
= 0
• 𝑟𝑟 = 1 − 𝑠𝑠0 𝑒𝑒 ⁄−𝛽𝛽𝑟𝑟 𝛾𝛾
• Initial condition:
– c infected and n-c susceptible
– 𝑠𝑠0 = 1 − ⁄𝑐𝑐 𝑛𝑛 , 𝑥𝑥0 = ⁄𝑐𝑐 𝑛𝑛 , 𝑟𝑟0 = 0
– When 𝑛𝑛 → ∞, 𝑠𝑠0 ≅ 1
• 𝑟𝑟 = 1 − 𝑒𝑒 ⁄−𝛽𝛽𝑟𝑟 𝛾𝛾
S
R
I
Time evolution of the SIR model
𝛽𝛽 = 1, 𝛾𝛾 = 0.4, 𝑠𝑠0 = 0.99, 𝑥𝑥0 =
0.01, 𝑟𝑟0 = 0
Size of the giant component
of a Poisson random graph
𝑐𝑐 = ⁄𝛽𝛽 𝛾𝛾
cS
eS −
−=1
size
Size of epidemics
• If 𝛽𝛽 ≤ 𝛾𝛾 there is no epidemic
– 𝐼𝐼 → 𝑅𝑅 is faster than 𝑆𝑆 → 𝐼𝐼
Sy =
cS
ey −
−=1cS
eS −
−=1
no giant component
0=S
0>S transition between
two regimes
1)1( =− −cS
e
dS
d
1=−cS
ce
10 =→= cS
cS
eS −
−=1
γβ=c
S I R
β γ
Epidemic
transition
𝛽𝛽 = 𝛾𝛾
Basic reproduction number
• The average number of additional I people
– If each I person passes disease to two others on
average, then 𝑅𝑅0 = 2 → disease will grow
exponentially
– If 𝑅𝑅0 = ⁄1 2 → disease will die exponentially
– If 𝑅𝑅0 = 1 → epidemic threshold (𝛽𝛽 = 𝛾𝛾)
S I R
𝑠𝑠
β γ
𝑥𝑥 𝑟𝑟
Modelling COVID-19 epidemic in Italy
• SIDARTHE model
38
Giordano, G., Blanchini, F., Bruno, R. et al. "Modelling the COVID-19 epidemic and
implementation of population-wide interventions in Italy", Nature Medicine Vol.26,
pp.855–860 (2020). https://doi.org/10.1038/s41591-020-0883-7
diagnosednot diagnosed
severe
mild
Growth of COVID-19 patients
• Power-law curves between countries are
highly correlated
39
Cesar Manchein, Eduardo L. Brugnago, Rafael M. da Silva, Carlos F. O. Mendes, and
Marcus W. Beims, "Strong Correlations Between Power-law Growth of COVID-19 in Four
Continents and the Inefficiency of Soft Quarantine Strategies", Chaos Vol.30, No.041102
pp.1-7, 2020. https://doi.org/10.1063/5.0009454
theoretically:
exponential
𝑦𝑦 = 𝑥𝑥 𝑘𝑘
http://maps.unomaha.edu/maher/
GEOL2300/week10/exp.html
actually :
power law
𝑦𝑦 = 𝑘𝑘 𝑥𝑥
Effect of travel restrictions
• Evaluating travel ban by computer simulation
• Wuhan travel ban was effective for preventing
COVID-19 outside of China, although it was
not effective inside of China (already diffused)
40
Matteo Chinazzi, Jessica T. Davis, Marco Ajelli, Corrado Gioannini, Maria Litvinova, Stefano Merler, Ana Pastore y Piontti,
Kunpeng Mu, Luca Rossi, Kaiyuan Sun, Cécile Viboud, Xinyue Xiong, Hongjie Yu, M. Elizabeth Halloran, Ira M. Longini Jr.,
Alessandro Vespignani, "The Effect of Travel Restrictions on the Spread of the 2019 Novel Coronavirus (COVID-19)
Outbreak“, Science 24 Apr 2020, Vol. 368, Issue 6489, pp. 395-400, 2020. https://doi.org/10.1126/science.aba9757
Network analysis of genomes
41
Peter Forstera, Lucy Forster, Colin Renfrew, and Michael Forster, "Phylogenetic Network
Analysis of SARS-CoV-2 Genomes“, PNAS, Vol.117, No.17, pp.9241-9243, 2020
https://doi.org/10.1073/pnas.2004999117
A
BC
Bat
Europe and America
East Asia
• Phylogenetics: for the inference of the
evolutionary history and relationships among
groups of organisms
• Three variants
• Virus mutation emerges
in two different hosts
Table of contents
• Networks (graphs)
• Networks + Deep Learning
• Networks + Deep Learning + COVID-19
– Networks + COVID-19
– Networks + Deep Learning + COVID-19
42
Graph Representation Learning and
Beyond (GRL+)
• A workshop collocated with
International Conference on Machine
Learning (ICML 2020)
– https://grlplus.github.io/covid19/
• “Graph Methods for COVID-19
Response” William L. Hamilton
(McGill University/Mila)
– https://grlplus.github.io/files/graphs-
against-covid.pdf
43
“Graph Methods for COVID-19
Response”
• Three key types of data
– Biomedical treatment data
– Epidemiological network data
– Supply chain networks
• heterogeneous and relational structures
– Computational drug design
– Computational treatment design
– Epidemiological forecasting
– Demand forecasting and supply chain optimization
– Outbreak tracking and tracing
44
William L. Hamilton, "Graph Methods for COVID-19 Response", https://grlplus.github.io/files/graphs-
against-covid.pdf
Computational drug design
• Can we design better antivirals to target COVID-19?
• Sub-problem 1: Molecule representation and
property prediction
• Sub-problem 2: Molecule generation and search
– How can we generate molecules that have particular
properties? How can we effectively search over the
space of possible molecules?
45
possibility of application of
GNNs (still open challenge)
William L. Hamilton, "Graph Methods for COVID-19 Response", https://grlplus.github.io/files/graphs-
against-covid.pdf
Computational treatment design
• Can we design better treatment strategies
using existing drugs?
• Approach 1: structure-based
– similar to computational drug design
• Approach 2: network-based
– Leverage knowledge of biological interactions
between drugs, diseases, and proteins
46
William L. Hamilton, "Graph Methods for COVID-19 Response", https://grlplus.github.io/files/graphs-
against-covid.pdf
Epidemiological forecasting
• Can we better predict how and where
infection rate will change over time?
47
William L. Hamilton, "Graph Methods for COVID-19 Response", https://grlplus.github.io/files/graphs-
against-covid.pdf
Demand forecasting and supply chain
optimization
• Can we forecast COVID-19 related demands to
optimize supply chains?
1. Heterogeneous relational data
2. Temporal information and changes
3. Node-level predictions
-> spatio-temporal GNNs are useful
48
William L. Hamilton, "Graph Methods for COVID-19 Response", https://grlplus.github.io/files/graphs-
against-covid.pdf
Outbreak tracking and tracing
• Can we model and predict infection risk at the
individual level?
49
William L. Hamilton, "Graph Methods for COVID-19 Response", https://grlplus.github.io/files/graphs-
against-covid.pdf
“COVID-19 and Networks”
• an article in Journal of the Japanese Society
for Artificial Intelligence (written in Japanese)
Tsuyoshi Murata, “COVID-19 and
Networks”, Journal of JSAI, Vol.35,
No.5, pp.654-660, 2020
http://id.nii.ac.jp/1004/00010709/
50
Table of contents
• Networks (graphs)
• Networks + Deep Learning
• Networks + Deep Learning + COVID-19
51
Networks, Deep Learning
(and COVID-19)
Tsuyoshi Murata
Department of Computer Science
School of Computing
Tokyo Institute of Technology
murata@c.titech.ac.jp
http://www.net.c.titech.ac.jp/
The Tenth Workshop on Computation: Theory and Practice (WCTP 2020) Nov. 21(Sat) 2020
slides available
from here

Networks, Deep Learning (and COVID-19)

  • 1.
    Networks, Deep Learning (andCOVID-19) Tsuyoshi Murata Department of Computer Science School of Computing Tokyo Institute of Technology murata@c.titech.ac.jp http://www.net.c.titech.ac.jp/ The Tenth Workshop on Computation: Theory and Practice (WCTP 2020) Nov. 21(Sat) 2020
  • 2.
    Table of contents •Networks (graphs) • Networks + Deep Learning • Networks + Deep Learning + COVID-19 2
  • 3.
    Table of contents •Networks (graphs) • Networks + Deep Learning • Networks + Deep Learning + COVID-19 3
  • 4.
    Networks (or graphs) •a set of vertices and edges • many objects in physical, biological, and social sciences can be thought of as networks 4 social networks metabolic networks food web “graph” and “network” are often used interchangeably
  • 5.
  • 6.
    Understanding/analyzing networks metrics models processes algorithms pathlength, density, diameter, degree distribution, clustering coefficient, … Dijkstra's algorithm, graph partitioning, centrality computation, … random network, scale- free network, small-world network, power law, configuration model, … rumor/disease diffusion, influence maximization / minimization, SI model, SIR model, …
  • 7.
    Topics • Community detection •Link prediction • Centrality (ranking) • Influence maximization • … 7 https://link.springer.com/article/10.1007/s11042-020-08700-4 https://www.nature.com/articles/s41598-019-57304-y https://www2.slideshare.net/tom.zimmermann/changes-and- bugs-mining-and-predicting-development-activities/19- CentralityDegree_Closeness_BetweennessBlue_binary_has https://link.springer.com/referenceworkent ry/10.1007%2F978-1-4939-7131-2_110197 Networks can be huge, incomplete, noisy, directed, weighted, signed, temporal, …
  • 8.
    Community detection insigned networks 8 • two types of edges: friendship and hostility • Detection of nested communities (which often appears in real social networks) Tsuyoshi Murata, Takahiko Sugihara, and Talel Abdessalem, "Community Detection in Signed Networks Based on Extended Signed Modularity", Proceedings of the 8th Conference on Complex Networks (CompleNet 2017), Springer, 2017.
  • 9.
    Transductive classification on heterogeneousnetworks • the labels of some vertices are given -> classify the labels of the remaining vertices 9 Phiradet Bangcharoensap, Tsuyoshi Murata, Hayato Kobayashi, Nobuyuki Shimizu, “Transductive Classification on Heterogeneous Information Networks with Edge Betweenness-based Normalization”, Proceedings of the 9th ACM International Conference on Web Search and Data Mining (WSDM2016), pp.437-446, 2016.
  • 10.
    Influence maximization indynamic networks • finding a set of nodes that will propagate information most in given social networks 10 Tsuyoshi Murata and Hokuto Koga, "Approximation Methods for Influence Maximization in Temporal Networks", Chapter 18, In: Petter Holme and Jari Saramaki (eds.), "Temporal Network Theory", pp.345- 368, Springer, 2019.
  • 11.
    Detecting Communities ofDistant Members 11 Xin Liu, Tsuyoshi Murata, Ken Wakita, "Detecting network communities beyond assortativity-related attributes", Physical Review E 90, 012806, 2014. Paulo Shakarian, Patrick Roos, Devon Callahan, Cory Kirk, "Mining for Geographically Disperse Communities in Social Networks by Leveraging Distance Modularity", KDD2013. • Our method was used for detecting terrorist networks by the researchers of U.S. Military Academy
  • 12.
    Reference (Networks) • Networks(second edition), Mark Newman, Oxford University Press, 2018. https://global.oup.com/academic/product/net works-9780198805090
  • 13.
    Table of contents •Networks (graphs) • Networks + Deep Learning • Networks + Deep Learning + COVID-19 13
  • 14.
    Deep Learning Image recognitionVoice recognition Natural Language Processing 14
  • 15.
    Convolutional neural networks •Recognizing local features -> global features https://towardsdatascience.com/a-comprehensive-guide-to-convolutional-neural-networks-the-eli5-way-3bd2b1164a53 15
  • 16.
    Convolution works forimages, sentences, and networks • Images: grid of pixels • Sentences: sequences of words • Networks: – Number of neighbors is not fixed – Topologically complex – Vertices are not ordered 16
  • 17.
    Graph Neural Networks •Learning features of vertices using their neighbors GNN Classification 17 gender, age, job, income, … https://edition.cnn.com/style/article/why-democrats- are-donkeys-republicans-are-elephants-artsy/index.html ? ? or
  • 18.
    Machine learning tasks •classification • regression • clustering • dimensionality reduction regression f(x)=ax3+… clustering group 1 group 2 dimensionality reduction classification 18
  • 19.
    Machine learning tasksfor graphs • Node classification • Graph classification • Link prediction • Graph generation model for generating graphs 19
  • 20.
    Applications of GraphNeural Networks • Computer vision – scene graph generation (input : images, output: objects and semantic relations) – realistic image generation (input: scene graph, output: images) • Recommender systems – recommendation as link prediction (input: items & users, output: missing links) • Traffic – Forecast of traffic speed (input: sensors on roads and the distances, output: traffic speed and volume) • Chemistry – classification of molecular graphs (atoms = nodes, bonds = edges) Graph Neural Networks: A Review of Methods and Applications https://arxiv.org/abs/1812.08434 20
  • 21.
    DeepMind article (Sept.2020) • Traffic prediction with advanced Graph Neural Networks – https://deepmind.com/blog/article/traffic- prediction-with-advanced-graph-neural-networks 21
  • 22.
    GNN for trafficprediction • Segmenting roads as graphs 22
  • 23.
    Learning Community Structure withVariational Autoencoder • Variational autoencoder (VAE) : generative models for the classification of similar synthetic entities • Variational graph autoencoder (VGAE) : the extension of VAE to graph structures • Variational Graph Autoencoder for Community Detection (VGAECD) : encodes graph structures with multiple Gaussian distributions corresponding to each of the communities 23 Jun Jin Choong, Xin Liu, Tsuyoshi Murata, "Learning Community Structure with Variational Autoencoder", Proceedings of IEEE ICDM 2018 (IEEE International Conference on Data Mining), pp.69-78, November, 2018.
  • 24.
    Fast Approximations ofBetweenness Centrality using Graph Neural Networks • A novel GNN for approximating centrality – aggregation is done separately for incoming and outgoing paths – Node’s own features are not aggregated – Nodes with no shortest paths are identified and corresponding rows in A and AT are set to zero 24 Sunil Kumar Maurya, Liu Xin, Tsuyoshi Murata, "Fast approximations of betweenness centrality with Graph Neural Networks", Proceedings of the 28th ACM International Conference on Information and Knowledge Management (CIKM 2019), pp.2149-2152, 2019.
  • 25.
    Linear Graph ConvolutionalModel for Diagnosing Brain Disorders 25 • fMRI data -> brain network -> population graph of similar patients Zarina Rakhimberdina, Liu Xin, Tsuyoshi Murata, "Population Graph-based Multi-Model Ensemble Method for Diagnosing Autism Spectrum Disorder“, Sensors, Vol.20, No.21, 18 pages, 2020.
  • 26.
    Reference (Graph NeuralNetworks) • “Graph Neural Networks: Models and Applications” (tutorial of AAAI 2020) • https://cse.msu.edu/~mayao4/tutorials/aaai2 020/ 26
  • 27.
    Table of contents •Networks (graphs) • Networks + Deep Learning • Networks + Deep Learning + COVID-19 27
  • 28.
    Table of contents •Networks (graphs) • Networks + Deep Learning • Networks + Deep Learning + COVID-19 – Networks + COVID-19 – Networks + Deep Learning + COVID-19 28
  • 29.
    Table of contents •Networks (graphs) • Networks + Deep Learning • Networks + Deep Learning + COVID-19 – Networks + COVID-19 – Networks + Deep Learning + COVID-19 29
  • 30.
    Network modeling forepidemics • disease spread 30
  • 31.
    Network modeling forepidemics • disease spread 31 network # of infected people prob. of infection prob. of recovery
  • 32.
    SIR model • S: susceptible • I : infected • R: recovered (or removed) 32 S I R β γ 𝛾𝛾𝛾𝛾𝛾𝛾 1-𝛾𝛾𝛾𝛾𝛾𝛾 S I R NDlib - Network Diffusion Library https://ndlib.readthedocs.io/en/latest/index.html
  • 33.
    SIR model • threestates – Susceptible (S) : not infected – Infected (I) – Recovered (removed) (R) • It makes little difference to the disease whether a person is immune or dead • 𝜏𝜏 : the length of time that infected individual is likely to remain infected before they recover • 𝛾𝛾𝛾𝛾𝜏𝜏 : probability of recovering in time interval 𝛿𝛿𝛿𝛿 • 1 − 𝛾𝛾𝛾𝛾𝛾𝛾 : probability of not doing so • Probability that the individual is still infected after time 𝜏𝜏 : lim 𝛿𝛿𝑡𝑡→0 1 − 𝛾𝛾𝛾𝛾𝛾𝛾 ⁄𝜏𝜏 𝛿𝛿𝛿𝛿 = 𝑒𝑒−𝛾𝛾𝛾𝛾 • Probability 𝑝𝑝 𝜏𝜏 𝑑𝑑𝜏𝜏 that the individual remains infected for and then recovers between 𝜏𝜏 and 𝜏𝜏 + 𝑑𝑑𝜏𝜏 : 𝑝𝑝 𝜏𝜏 𝑑𝑑𝜏𝜏 = 𝛾𝛾𝑒𝑒−𝛾𝛾𝛾𝛾 𝑑𝑑𝜏𝜏 S I R recovery and death β γ 𝛾𝛾𝛾𝛾𝛾𝛾 1-𝛾𝛾𝛾𝛾𝛾𝛾 Exponential distribution: some might remain in I state for a long time not realistic for most real disease
  • 34.
    Equations for theSIR model • 𝑑𝑑𝑑𝑑 𝑑𝑑𝑑𝑑 = −𝛽𝛽𝑠𝑠𝑠𝑠 • 𝑑𝑑𝑑𝑑 𝑑𝑑𝑑𝑑 = 𝛽𝛽𝑠𝑠𝑠𝑠 − 𝛾𝛾𝑥𝑥 • 𝑑𝑑𝑟𝑟 𝑑𝑑𝑑𝑑 = 𝛾𝛾𝑥𝑥 • 𝑠𝑠 + 𝑥𝑥 + 𝑟𝑟 = 1 • Eliminate x : 1 𝑠𝑠 𝑑𝑑𝑑𝑑 𝑑𝑑𝑑𝑑 = − 𝛽𝛽 𝛾𝛾 𝑑𝑑𝑑𝑑 𝑑𝑑𝑑𝑑 • Integrate both sides with respect to t : 𝑠𝑠 = 𝑠𝑠0 𝑒𝑒 ⁄−𝛽𝛽𝑟𝑟 𝛾𝛾 • Put this equation and x = 1 − 𝑠𝑠 − 𝑟𝑟 : 𝑑𝑑𝑑𝑑 𝑑𝑑𝑑𝑑 = 𝛾𝛾� � 1 − 𝑟𝑟 − 𝑠𝑠0 𝑒𝑒 ⁄−𝛽𝛽𝑟𝑟 𝛾𝛾 • 𝑡𝑡 = 1 𝛾𝛾 ∫0 𝑟𝑟 𝑑𝑑𝑑𝑑 1−𝑟𝑟−𝑠𝑠0 𝑒𝑒 ⁄−𝛽𝛽𝑟𝑟 𝛾𝛾 S I R 𝑠𝑠 β γ 𝑥𝑥 𝑟𝑟 S R I Time evolution of the SIR model 𝛽𝛽 = 1, 𝛾𝛾 = 0.4, 𝑠𝑠0 = 0.99, 𝑥𝑥0 = 0.01, 𝑟𝑟0 = 0
  • 35.
    Time evolution ofthe SIR model • S decreases / R increases monotonically • S does not go to zero (because no I left as 𝑡𝑡 → ∞) • R: total size of the outbreak • 𝑑𝑑𝑑𝑑 𝑑𝑑𝑑𝑑 = 𝛾𝛾 1 − 𝑟𝑟 − 𝑠𝑠0 𝑒𝑒 ⁄−𝛽𝛽𝑟𝑟 𝛾𝛾 = 0 • 𝑟𝑟 = 1 − 𝑠𝑠0 𝑒𝑒 ⁄−𝛽𝛽𝑟𝑟 𝛾𝛾 • Initial condition: – c infected and n-c susceptible – 𝑠𝑠0 = 1 − ⁄𝑐𝑐 𝑛𝑛 , 𝑥𝑥0 = ⁄𝑐𝑐 𝑛𝑛 , 𝑟𝑟0 = 0 – When 𝑛𝑛 → ∞, 𝑠𝑠0 ≅ 1 • 𝑟𝑟 = 1 − 𝑒𝑒 ⁄−𝛽𝛽𝑟𝑟 𝛾𝛾 S R I Time evolution of the SIR model 𝛽𝛽 = 1, 𝛾𝛾 = 0.4, 𝑠𝑠0 = 0.99, 𝑥𝑥0 = 0.01, 𝑟𝑟0 = 0 Size of the giant component of a Poisson random graph 𝑐𝑐 = ⁄𝛽𝛽 𝛾𝛾 cS eS − −=1 size
  • 36.
    Size of epidemics •If 𝛽𝛽 ≤ 𝛾𝛾 there is no epidemic – 𝐼𝐼 → 𝑅𝑅 is faster than 𝑆𝑆 → 𝐼𝐼 Sy = cS ey − −=1cS eS − −=1 no giant component 0=S 0>S transition between two regimes 1)1( =− −cS e dS d 1=−cS ce 10 =→= cS cS eS − −=1 γβ=c S I R β γ Epidemic transition 𝛽𝛽 = 𝛾𝛾
  • 37.
    Basic reproduction number •The average number of additional I people – If each I person passes disease to two others on average, then 𝑅𝑅0 = 2 → disease will grow exponentially – If 𝑅𝑅0 = ⁄1 2 → disease will die exponentially – If 𝑅𝑅0 = 1 → epidemic threshold (𝛽𝛽 = 𝛾𝛾) S I R 𝑠𝑠 β γ 𝑥𝑥 𝑟𝑟
  • 38.
    Modelling COVID-19 epidemicin Italy • SIDARTHE model 38 Giordano, G., Blanchini, F., Bruno, R. et al. "Modelling the COVID-19 epidemic and implementation of population-wide interventions in Italy", Nature Medicine Vol.26, pp.855–860 (2020). https://doi.org/10.1038/s41591-020-0883-7 diagnosednot diagnosed severe mild
  • 39.
    Growth of COVID-19patients • Power-law curves between countries are highly correlated 39 Cesar Manchein, Eduardo L. Brugnago, Rafael M. da Silva, Carlos F. O. Mendes, and Marcus W. Beims, "Strong Correlations Between Power-law Growth of COVID-19 in Four Continents and the Inefficiency of Soft Quarantine Strategies", Chaos Vol.30, No.041102 pp.1-7, 2020. https://doi.org/10.1063/5.0009454 theoretically: exponential 𝑦𝑦 = 𝑥𝑥 𝑘𝑘 http://maps.unomaha.edu/maher/ GEOL2300/week10/exp.html actually : power law 𝑦𝑦 = 𝑘𝑘 𝑥𝑥
  • 40.
    Effect of travelrestrictions • Evaluating travel ban by computer simulation • Wuhan travel ban was effective for preventing COVID-19 outside of China, although it was not effective inside of China (already diffused) 40 Matteo Chinazzi, Jessica T. Davis, Marco Ajelli, Corrado Gioannini, Maria Litvinova, Stefano Merler, Ana Pastore y Piontti, Kunpeng Mu, Luca Rossi, Kaiyuan Sun, Cécile Viboud, Xinyue Xiong, Hongjie Yu, M. Elizabeth Halloran, Ira M. Longini Jr., Alessandro Vespignani, "The Effect of Travel Restrictions on the Spread of the 2019 Novel Coronavirus (COVID-19) Outbreak“, Science 24 Apr 2020, Vol. 368, Issue 6489, pp. 395-400, 2020. https://doi.org/10.1126/science.aba9757
  • 41.
    Network analysis ofgenomes 41 Peter Forstera, Lucy Forster, Colin Renfrew, and Michael Forster, "Phylogenetic Network Analysis of SARS-CoV-2 Genomes“, PNAS, Vol.117, No.17, pp.9241-9243, 2020 https://doi.org/10.1073/pnas.2004999117 A BC Bat Europe and America East Asia • Phylogenetics: for the inference of the evolutionary history and relationships among groups of organisms • Three variants • Virus mutation emerges in two different hosts
  • 42.
    Table of contents •Networks (graphs) • Networks + Deep Learning • Networks + Deep Learning + COVID-19 – Networks + COVID-19 – Networks + Deep Learning + COVID-19 42
  • 43.
    Graph Representation Learningand Beyond (GRL+) • A workshop collocated with International Conference on Machine Learning (ICML 2020) – https://grlplus.github.io/covid19/ • “Graph Methods for COVID-19 Response” William L. Hamilton (McGill University/Mila) – https://grlplus.github.io/files/graphs- against-covid.pdf 43
  • 44.
    “Graph Methods forCOVID-19 Response” • Three key types of data – Biomedical treatment data – Epidemiological network data – Supply chain networks • heterogeneous and relational structures – Computational drug design – Computational treatment design – Epidemiological forecasting – Demand forecasting and supply chain optimization – Outbreak tracking and tracing 44 William L. Hamilton, "Graph Methods for COVID-19 Response", https://grlplus.github.io/files/graphs- against-covid.pdf
  • 45.
    Computational drug design •Can we design better antivirals to target COVID-19? • Sub-problem 1: Molecule representation and property prediction • Sub-problem 2: Molecule generation and search – How can we generate molecules that have particular properties? How can we effectively search over the space of possible molecules? 45 possibility of application of GNNs (still open challenge) William L. Hamilton, "Graph Methods for COVID-19 Response", https://grlplus.github.io/files/graphs- against-covid.pdf
  • 46.
    Computational treatment design •Can we design better treatment strategies using existing drugs? • Approach 1: structure-based – similar to computational drug design • Approach 2: network-based – Leverage knowledge of biological interactions between drugs, diseases, and proteins 46 William L. Hamilton, "Graph Methods for COVID-19 Response", https://grlplus.github.io/files/graphs- against-covid.pdf
  • 47.
    Epidemiological forecasting • Canwe better predict how and where infection rate will change over time? 47 William L. Hamilton, "Graph Methods for COVID-19 Response", https://grlplus.github.io/files/graphs- against-covid.pdf
  • 48.
    Demand forecasting andsupply chain optimization • Can we forecast COVID-19 related demands to optimize supply chains? 1. Heterogeneous relational data 2. Temporal information and changes 3. Node-level predictions -> spatio-temporal GNNs are useful 48 William L. Hamilton, "Graph Methods for COVID-19 Response", https://grlplus.github.io/files/graphs- against-covid.pdf
  • 49.
    Outbreak tracking andtracing • Can we model and predict infection risk at the individual level? 49 William L. Hamilton, "Graph Methods for COVID-19 Response", https://grlplus.github.io/files/graphs- against-covid.pdf
  • 50.
    “COVID-19 and Networks” •an article in Journal of the Japanese Society for Artificial Intelligence (written in Japanese) Tsuyoshi Murata, “COVID-19 and Networks”, Journal of JSAI, Vol.35, No.5, pp.654-660, 2020 http://id.nii.ac.jp/1004/00010709/ 50
  • 51.
    Table of contents •Networks (graphs) • Networks + Deep Learning • Networks + Deep Learning + COVID-19 51
  • 52.
    Networks, Deep Learning (andCOVID-19) Tsuyoshi Murata Department of Computer Science School of Computing Tokyo Institute of Technology murata@c.titech.ac.jp http://www.net.c.titech.ac.jp/ The Tenth Workshop on Computation: Theory and Practice (WCTP 2020) Nov. 21(Sat) 2020 slides available from here