INTRODUCTION
Network pharmacology isan interdisciplinary approach that combines systems biology,
pharmacology, and bioinformatics to understand how drugs interact with biological systems.
This approach helps in identifying potential drug targets and understanding the mechanisms of drug
action and side effects.
It helps to understand how drugs can affect multiple targets simultaneously.
which is particularly useful for treating complex diseases like cancer or neurodegenerative
disorders..
Overall, this method enhances the understanding of drug efficacy and safety.
2.
Hopkins (Hopkins, 2007,2008) observed that network biology and
polypharmacology can illuminate the understanding of drug action. He
introduced the term “network pharmacology.” This distinctive new
approach to drug discovery can enable the paradigm shift from highly
specific magic bullet-based drug discovery to multitargeted drug
discovery
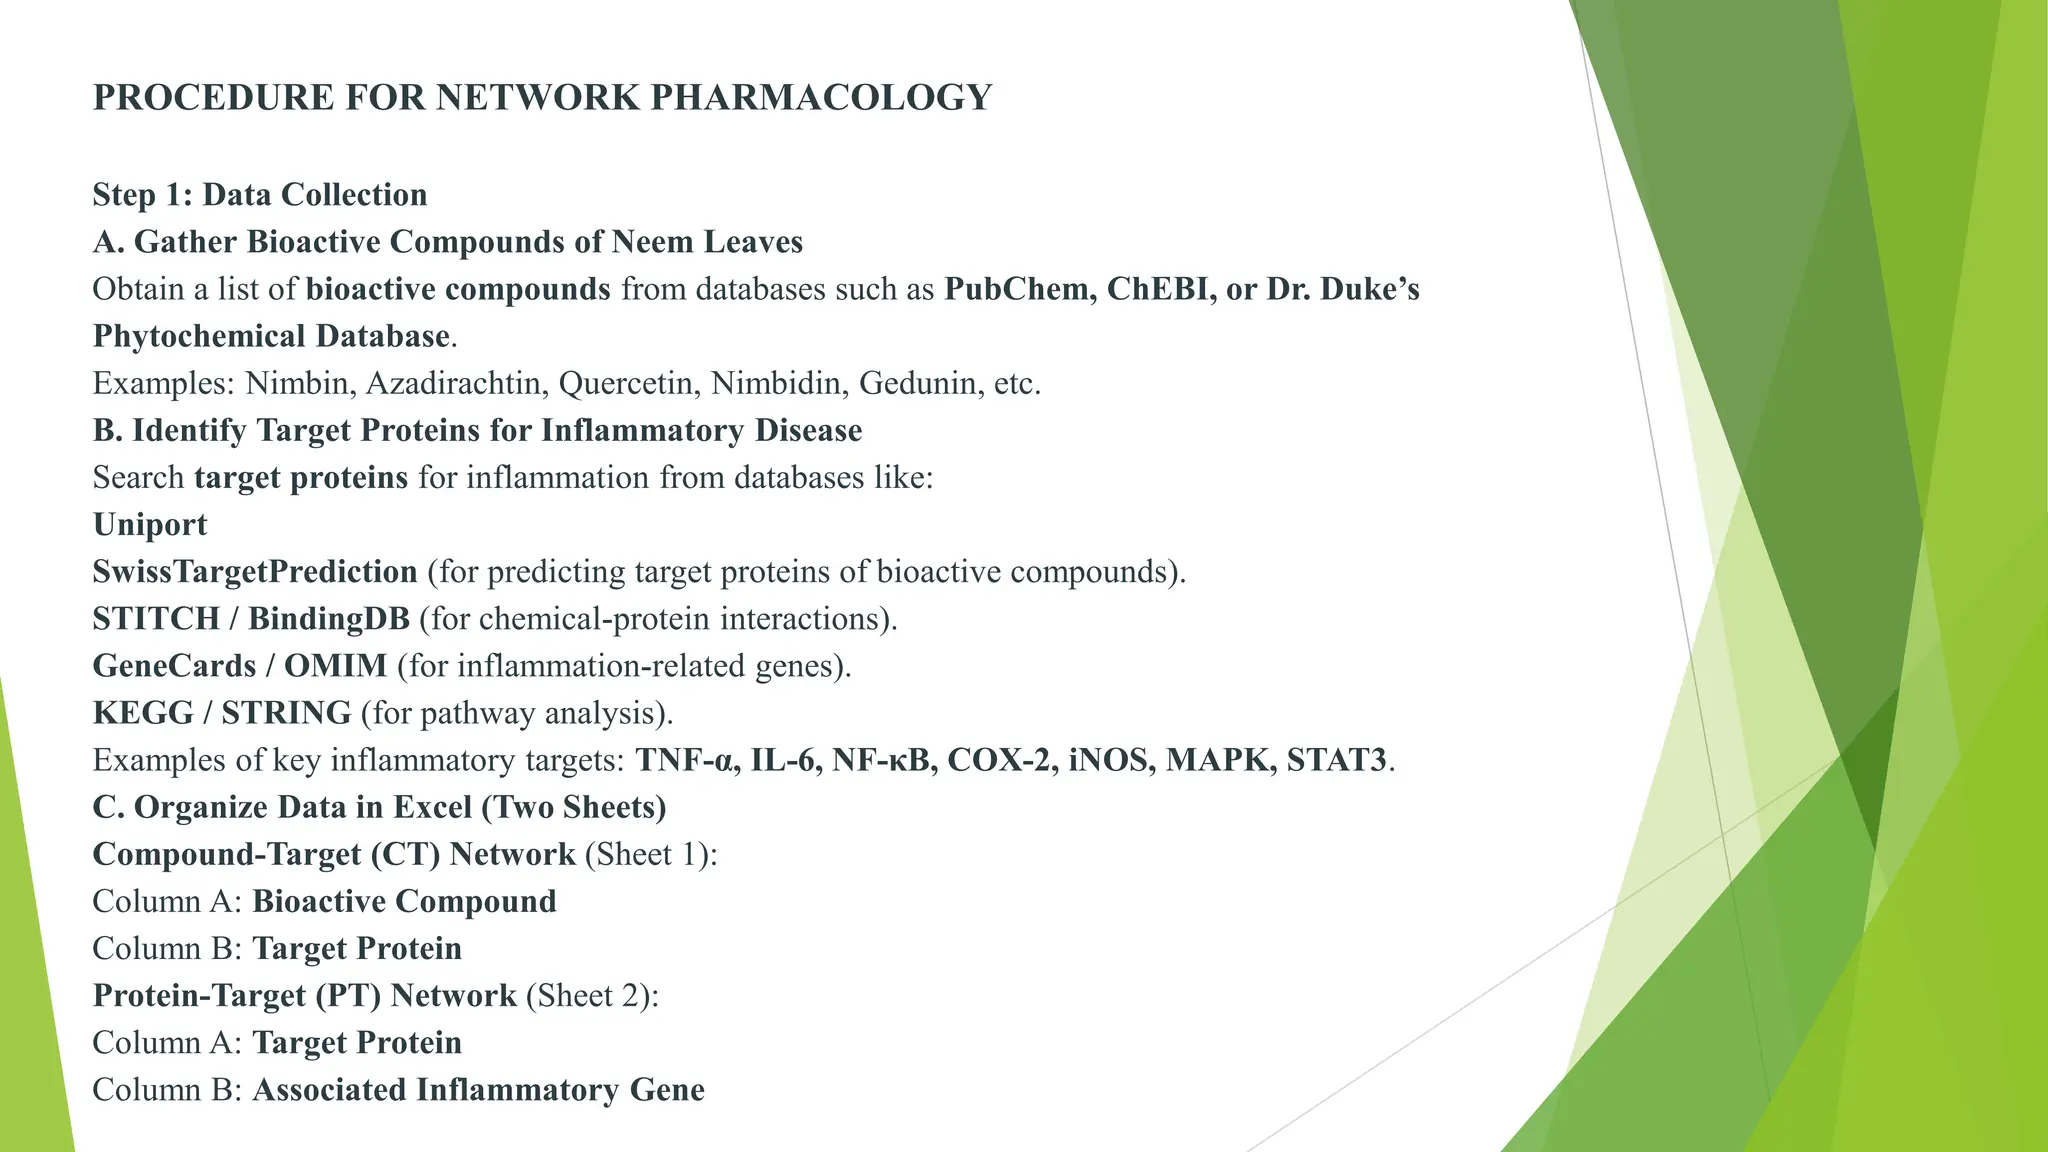
PROCEDURE FOR NETWORKPHARMACOLOGY
Step 1: Data Collection
A. Gather Bioactive Compounds of Neem Leaves
Obtain a list of bioactive compounds from databases such as PubChem, ChEBI, or Dr. Duke’s
Phytochemical Database.
Examples: Nimbin, Azadirachtin, Quercetin, Nimbidin, Gedunin, etc.
B. Identify Target Proteins for Inflammatory Disease
Search target proteins for inflammation from databases like:
Uniport
SwissTargetPrediction (for predicting target proteins of bioactive compounds).
STITCH / BindingDB (for chemical-protein interactions).
GeneCards / OMIM (for inflammation-related genes).
KEGG / STRING (for pathway analysis).
Examples of key inflammatory targets: TNF-α, IL-6, NF-κB, COX-2, iNOS, MAPK, STAT3.
C. Organize Data in Excel (Two Sheets)
Compound-Target (CT) Network (Sheet 1):
Column A: Bioactive Compound
Column B: Target Protein
Protein-Target (PT) Network (Sheet 2):
Column A: Target Protein
Column B: Associated Inflammatory Gene
9.
Step 2: ImportData into Cytoscape
Open Cytoscape.
Go to File → Import → Table from File.
Select the CT (Compound-Target) file and click OK.
Repeat the process for PT (Protein-Target) file.
Set the column "Meaning" as Target & Gene for both files.
Step 3: Construct & Visualize the Network
A. Load Network from Table
• Go to File → Import → Network from Table.
• Select the CT and PT tables to construct the interaction
network.
B. Merge Networks
• Click on Tools → Merge → Networks.
• Select Union to merge the CT and PT networks.
• Click Merge to form a comprehensive interaction network.
C. Apply a Layout for Clear Visualization
Click Layout → Circular Layout (or Force-Directed for better
clarity)
10.
Step 4: IdentifyKey Bioactive Compounds
1. Open the Node Table (bottom panel).
2. Sort by Degree (highest connectivity).
The compound with the highest degree is the most connected to
inflammatory targets
Step 5: Analyze Binding Affinity & Pathway Involvement
A. Network Analysis
• Go to Tools → NetworkAnalyzer → Analyze Network.
• Check properties like degree, betweenness, and closeness
centrality.
• Identify key nodes (compounds or targets) that have major
influence.
B. Pathway Analysis
Use STRING or KEGG pathway analysis to explore
inflammatory pathways
11.
• Step 6:Selecting Key Compounds for Further Studies
The highest-degree compounds can be selected for in vitro & in vivo studies.
Molecular docking studies can be performed using AutoDock, PyRx, or SwissDock
12.
In this numberof Proteins interact with other proteins or Chemical Constituents.
Now there is need to find Phytochemicals & ethnobotanical database
Using – Dr. Duke’s
IMPPAT
DIACAN
Ex: Dr.dukes
VISUAL PRESENTATION
After finding proteinwe need to find genes associated
with proteins (disease gene association database)
Using- Disgenet
Gene cards
Ex: Genre cards
18.
Now find themolecular pathway based
database(OMIM Database)
Using – KEGG Pathway
WIKI Pathway
BRENDA
SPIKE
Gene ontology
19.
Now find proteinprotein interaction
Using- STGING database
Find Pharmacophore & functional group based database
Using- UNIPROT
SWISS Target Prediction
Compound Structure Identification
Using -PUBCHEM
ZINC
Save the files in Excel Sheet as CT ( Chemical &
Target/gene ) & PT(Pathway Target)
20.
Network Construction andVisualization
• Load the network from the table by importing CT and PT
tables.
• Merge the networks using the union option under the merge
tool.
• Apply a circular or force-directed layout for better
visualization. Identify key bioactive compounds by sorting
the node table based on degree.
• Perform network analysis using NetworkAnalyzer to check
degree, betweenness, and closeness centrality.
• Conduct pathway analysis using STRING or KEGG to
explore inflammatory pathways.
• Finally, select the highest-degree compounds for in vitro and
in vivo studies and perform molecular docking using
AutoDock, PyRx, or SwissDock