Download as PDF, PPTX


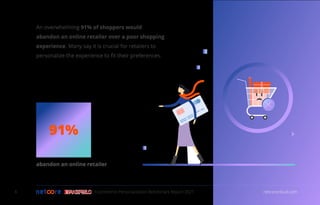


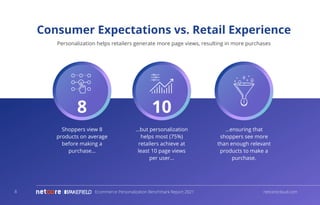


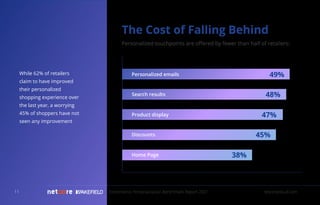

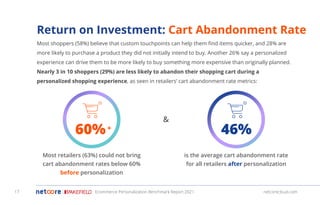
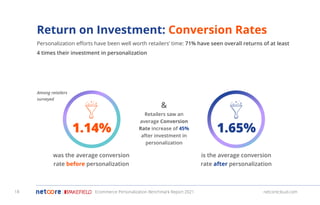
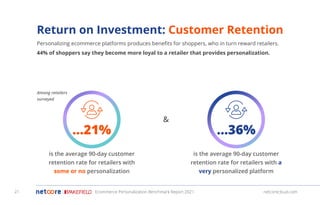


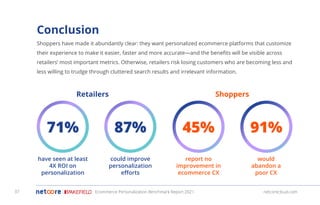
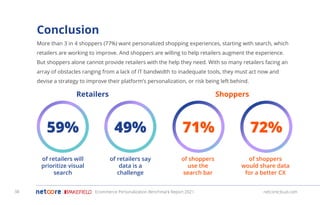


The 2021 Ecommerce Personalization Benchmark Report reveals that 91% of shoppers abandon online retailers over poor experiences, with 77% desiring more personalized interactions. Retailers investing in personalization see significant returns, including 4x ROI and improved metrics like conversion rates increasing by 45% and cart abandonment rates dropping to 46%. Despite these benefits, many retailers face challenges such as data collection issues and insufficient tools, emphasizing the need for immediate action to enhance personalization efforts.


![[Mémoire] Le basket 3x3 en France](https://cdn.slidesharecdn.com/ss_thumbnails/ledveloppementdubasket3x3enfrance-150327121418-conversion-gate01-thumbnail.jpg?width=640&height=640&fit=bounds)


![[METRIC] Thị trường bán lẻ trực tuyến Việt Nam 2023 và dự báo 2024](https://cdn.slidesharecdn.com/ss_thumbnails/metricthtrngbnltrctuyn2023vdbo2024-240131081607-7d7c034e-thumbnail.jpg?width=640&height=640&fit=bounds)


