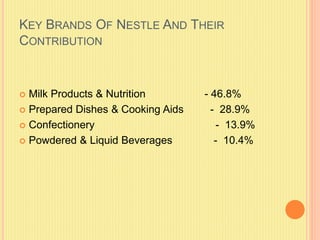
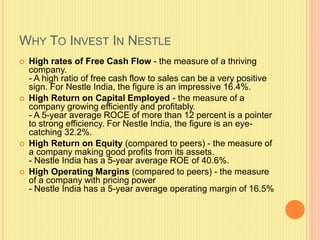
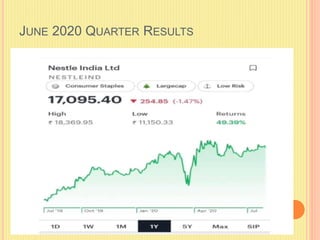
Presented By :-
Group 8
Saumya Jain
Shiva Chaudhary
Shrivriddhi Jaiswal
Shweta Chauhan
Soumya Mukherjee
Sumit Kumar Singh
NESTLE
Nestle history begins in 1866 with the foundation of
the Anglo-Swiss Condensed Milk Company. Nestle
formed a company in India and set up its first
factory in 1961 at Moga, Punjab
KEY BRANDS OF NESTLE AND THEIR
CONTRIBUTION
 Milk Products & Nutrition - 46.8%
 Prepared Dishes & Cooking Aids - 28.9%
 Confectionery - 13.9%
 Powdered & Liquid Beverages - 10.4%
COMPARISON BETWEEN NESTLE AND ITS
PEERS
WHY TO INVEST IN NESTLE
 High rates of Free Cash Flow - the measure of a thriving
company.
- A high ratio of free cash flow to sales can be a very positive
sign. For Nestle India, the figure is an impressive 16.4%.
 High Return on Capital Employed - the measure of a
company growing efficiently and profitably.
- A 5-year average ROCE of more than 12 percent is a pointer
to strong efficiency. For Nestle India, the figure is an eye-
catching 32.2%.
 High Return on Equity (compared to peers) - the measure of
a company making good profits from its assets.
- Nestle India has a 5-year average ROE of 40.6%.
 High Operating Margins (compared to peers) - the measure
of a company with pricing power
- Nestle India has a 5-year average operating margin of 16.5%
JUNE 2020 QUARTER RESULTS
THANK YOU

Nestle financial analysis and background

  • 1.
    Presented By :- Group8 Saumya Jain Shiva Chaudhary Shrivriddhi Jaiswal Shweta Chauhan Soumya Mukherjee Sumit Kumar Singh
  • 2.
    NESTLE Nestle history beginsin 1866 with the foundation of the Anglo-Swiss Condensed Milk Company. Nestle formed a company in India and set up its first factory in 1961 at Moga, Punjab
  • 3.
    KEY BRANDS OFNESTLE AND THEIR CONTRIBUTION  Milk Products & Nutrition - 46.8%  Prepared Dishes & Cooking Aids - 28.9%  Confectionery - 13.9%  Powdered & Liquid Beverages - 10.4%
  • 4.
  • 5.
    WHY TO INVESTIN NESTLE  High rates of Free Cash Flow - the measure of a thriving company. - A high ratio of free cash flow to sales can be a very positive sign. For Nestle India, the figure is an impressive 16.4%.  High Return on Capital Employed - the measure of a company growing efficiently and profitably. - A 5-year average ROCE of more than 12 percent is a pointer to strong efficiency. For Nestle India, the figure is an eye- catching 32.2%.  High Return on Equity (compared to peers) - the measure of a company making good profits from its assets. - Nestle India has a 5-year average ROE of 40.6%.  High Operating Margins (compared to peers) - the measure of a company with pricing power - Nestle India has a 5-year average operating margin of 16.5%
  • 6.
  • 7.