SlideShare a Scribd company logo
1 of 33
Download to read offline
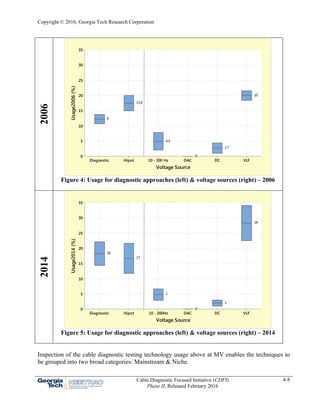
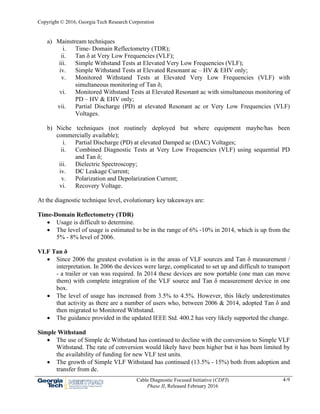
Copyright © 2016, Georgia Tech Research Corporation
Cable Diagnostic Focused Initiative (CDFI)
Phase II, Released February 2016
4-1
CHAPTER 4
How to Start
Nigel Hampton
This chapter represents the state of the art at the time of release.
Readers are encouraged to consult the link below for the version of this
chapter with the most recent release date:
http://www.neetrac.gatech.edu/cdfi-publications.html
Copyright © 2016, Georgia Tech Research Corporation
Cable Diagnostic Focused Initiative (CDFI)
Phase II, Released February 2016
4-2
DISCLAIMER OF WARRANTIES AND LIMITATION OF LIABILITIES
This document was prepared by Board of Regents of the University System of Georgia by and on
behalf of the Georgia Institute of Technology NEETRAC (NEETRAC) as an account of work
supported by the US Department of Energy and Industrial Sponsors through agreements with the
Georgia Tech Research Institute (GTRC).
Neither NEETRAC, GTRC, any member of NEETRAC or any cosponsor nor any person acting on
behalf of any of them:
a) Makes any warranty or representation whatsoever, express or implied,
i. With respect to the use of any information, apparatus, method, process, or similar
item disclosed in this document, including merchantability and fitness for a
particular purpose, or
ii. That such use does not infringe on or interfere with privately owned rights, including
any party’s intellectual property, or
iii. That this document is suitable to any particular user’s circumstance; or
b) Assumes responsibility for any damages or other liability whatsoever (including any
consequential damages, even if NEETRAC or any NEETRAC representative has been
advised of the possibility of such damages) resulting from your selection or use of this
document or any information, apparatus, method, process or similar item disclosed in this
document.
DOE Disclaimer: This report was prepared as an account of work sponsored by an agency of the
United States Government. Neither the United States Government nor any agency thereof, nor any
of their employees, makes any warranty, express or implied, or assumes any legal liability or
responsibility for the accuracy, completeness, or usefulness of any information, apparatus, product,
or process disclosed, or represents that its use would not infringe privately owned rights. Reference
herein to any specific commercial product, process, or service by trade name, trademark,
manufacturer, or otherwise does not necessarily constitute or imply its endorsement,
recommendation, or favoring by the United States Government or any agency thereof. The views
and opinions of authors expressed herein do not necessarily state or reflect those of the United
States Government or any agency thereof.
NOTICE
Copyright of this report and title to the evaluation data contained herein shall reside with GTRC.
Reference herein to any specific commercial product, process or service by its trade name,
trademark, manufacturer or otherwise does not constitute or imply its endorsement,
recommendation or favoring by NEETRAC.
The information contained herein represents a reasonable research effort and is, to our knowledge,
accurate and reliable at the date of publication.
It is the user's responsibility to conduct the necessary assessments in order to satisfy themselves as
to the suitability of the products or recommendations for the user's particular purpose.
Copyright © 2016, Georgia Tech Research Corporation
Cable Diagnostic Focused Initiative (CDFI)
Phase II, Released February 2016
4-3
TABLE OF CONTENTS
4.0 How to Start................................................................................................................................... 4 
4.1 Evolution of Cable System Diagnostics..................................................................................... 4 
4.2 Choosing the Most Appropriate Diagnostic Program for an MV Cable System ..................... 10 
4.2.1 Getting Started.................................................................................................................... 11 
4.2.2 The Process - SAGE........................................................................................................... 12 
4.2.2.1 Selection....................................................................................................................... 13 
4.2.2.2 Action........................................................................................................................... 17 
4.2.2.3 Generation.................................................................................................................... 18 
4.2.2.4 Evaluation .................................................................................................................... 19 
4.2.3 Information on the Diagnostic Techniques ........................................................................ 20 
4.2.4 Choosing the most appropriate diagnostics - Selection ..................................................... 22 
4.2.4.1 Basic Approach............................................................................................................ 22 
4.2.4.2 Specific Guidance........................................................................................................ 24 
4.3 Summary................................................................................................................................... 33 
LIST OF FIGURES
Figure 1: Range of Usage for the different diagnostic techniques - 2014 ........................................... 5 
Figure 2: Range of Usage for the different diagnostic techniques – 2006........................................... 7 
Figure 3: Range of Usage for the different diagnostic techniques – 2014........................................... 7 
Figure 4: Usage for diagnostic approaches (left) & voltage sources (right) – 2006............................ 8 
Figure 5: Usage for diagnostic approaches (left) & voltage sources (right) – 2014............................ 8 
Figure 6: Effect of SAGE on the Failure Rate of a Target Population.............................................. 13 
LIST OF TABLES
Table 1: Example Selection Matrix - Qualitative – Residential Customers..................................... 16 
Table 2: Example Selection Matrix – Semi Quantitative – Residential Customers .......................... 16 
Table 3: Interpretation of the Selection for a New User of Diagnostics............................................ 17 
Table 4: Interpretation of the Selection for an Experienced User of Diagnostics ............................. 17 
Table 5: Typical Diagnostic Technique Deployment ........................................................................ 21 
Table 6: Local vs. Global Assessments for Diagnostic Techniques.................................................. 22 
Table 7: Initial Diagnostic Screening Matrix..................................................................................... 24 
Table 8: Acceptable Risk of Failures on Test (FOT), Test by Utility Personnel............................... 25 
Table 9: Acceptable Risk of Failures on Test (FOT), Test by Sub-Contractors................................ 26 
Table 10: Minimal Risk of Failures on Test (FOT), Test by Utility Personnel................................. 27 
Table 11: Minimal Risk of Failures on Test (FOT), Test by Sub Contractors.................................. 28 
Table 12: Failures on Test (FOT) Not Acceptable, Test by Utility Personnel .................................. 29 
Table 13: Failures on Test (FOT) Not Acceptable, Test by Sub Contractors.................................... 30 
Copyright © 2016, Georgia Tech Research Corporation
Cable Diagnostic Focused Initiative (CDFI)
Phase II, Released February 2016
4-4
4.0 HOW TO START
The section of a diagnostic technology should be made near the start of the process, but not right at
the start, of the diagnostic testing process. At first sight, the choice may appear to be simple and
might be based on prior experience or recommendations from colleagues/fellow utilities or
sales/marketing materials. However, the decision is actually quite complex and requires a review of
many influencing factors. This chapter provides guidance on how to optimize the selection process.
Section 4.1 provides a historical perspective of diagnostics and serves to provide information such
that prior experience and recommendations of colleagues/fellow utilities can be used in the right
context.
Section 4.2 charts several paths such that a user may best benefit from the accumulated experience
of utility practitioners. It addresses the selection of the optimal test location and gives a five step
process for arriving at a short list of diagnostics to consider. The prime benefit of such a process is
that the decision making is transparent and each part of the decision making process is preserved for
future review.
4.1 Evolution of Cable System Diagnostics
Research into the evolution started with a survey to establish the use of cable system diagnostics in
North America was conducted in 2006 as part of CDFI Phase I and this provided one of the first
industry wide estimates of diagnostic test deployment on electric utility systems. NEETRAC
repeated the survey in 2014 using interviews with knowledgeable personnel. The work is now
complete and results are reported for 103 utility entities in Canada and the US. Typically, the
utilities contacted had more than 200,000 customers and information could be gathered for more
than 70% of these utilities. Consequently, the sampling is believed to be representative of the
utilities in the US and Canada.
The information was captured at the utility operating company level so that regional variations and
preferences could be captured. Furthermore, there can be much discussion over what constitutes
“utility use”. In this work, to be considered a diagnostic used by a utility, the technique has to be
part of a normal/established activity for determining cable system asset health on new and aged
systems. Thus, pilot studies and laboratory experiments are not included. Some information is
available for Mexico; however the usage could not be established to the same level as for entities in
Canada and the US, thus data for Mexico are not included at this time.
Each utility entity is considered on its own and given equal weighting, which addresses the fact that
individual operating companies within a utility corporation (e.g. AEP, Exelon, FirstEnergy, PPL
etc.) often have different approaches. This is very much in line with the manner in which diagnostic
test usage was reported in the initial study of 2006. It is important to note in this approach that each
respondent is considered equally (same weighting regardless of entity size). Viewed in this manner,
over 73% of utilities surveyed report they do not employ cable system diagnostics. The most widely
deployed technique reported to date is Simple VLF Withstand.
Copyright © 2016, Georgia Tech Research Corporation
Cable Diagnostic Focused Initiative (CDFI)
Phase II, Released February 2016
4-5
The operating entity approach detailed above gives equal weighting to all entities independent of
the size of the operating company. Another perspective may be gained if it were possible to
consider the utility size. In principle, the optimal way to incorporate this would be to use the size of
the underground MV system. However, this is known and knowable for only a very small fraction
(5% – 10% of the sample) of the respondents. The main issue with the reduced number of
respondents would be “confirmation bias” (i.e. the folks using diagnostics would be systematically
more likely to provide the length information and thus bias the survey). Thus, it was determined that
the information would be more useful if the large number of respondents was retained and some
other means of size adjustment established. One approach is to use the number of customers served
by a utility as an alias for the size of the underground system. It is recognized that this weighting is
not entirely correct but it is reasonably pragmatic. Using this approach, each utility response was
weighted by the reported number of customers that the utility serves. This perspective estimates that
the use of diagnostics increases from 26.5% to 43.9% when adjusted for size.
Figure 1: Range of Usage for the different diagnostic techniques - 2014
As mentioned, neither the entity approach or customer approach described above are likely to
provide the “correct” usage; however, they most likely define the upper and lower ranges of the
usage. Thus, it is possible to refine the estimated diagnostic usage with a process somewhat
analogous to Bayesian Analysis which combines available estimates and engineering knowledge to
provide a more accurate/complete estimate. Figure 1 shows the improved estimates by providing
likely ranges for each diagnostic technique (drawn from the two different approaches) as well as the
“no use” category. At this time, it is recommended that the midpoint of these ranges be used if a
VLF Withstand Simple
VLF TD
VLF Monitored W
ithstand TD
PD AC &
VLF
None
DC Withstand Simple
80
70
60
50
40
30
20
10
0
Technique
Usage2014(%)
15
4.5
8
6
65
2
Copyright © 2016, Georgia Tech Research Corporation
Cable Diagnostic Focused Initiative (CDFI)
Phase II, Released February 2016
4-6
single value is needed. The analysis completed thus far suggests that, for example, the VLF Simple
Withstand usage lies somewhere between 10.8% and 18.7%, with 15% being a reasonable number
to use if a range is not appropriate.
Multiple voltage sources are available for use by those utilities that currently deploy diagnostics on
their systems. These include using resonant ac (10 – 300 Hz), Very Low Frequency (VLF), damped
ac (DAC), and dc. These sources may be used in one of two modes: diagnostic (Tan δ, PD, etc.) or
withstand (Simple and Monitored). This analysis takes the same quasi-Bayesian approach described
above to estimate the usage ranges. It is not possible to establish the most common testing mode as
Withstand (HiPot) and Diagnostic modes overlap.
The preceding information described the survey that was completed in 2014. Additionally, the basic
information from the entity only analysis completed in 2006 can be applied to develop an estimate
for 2006. This has been done using the same approaches outlined above to provide a side by side
usage evolution of diagnostic techniques (see Figure 2 through Figure 5). In the figures below the
following terms are used: TD = Tan Delta, PD = Partial Discharge, VLF = Very Low Frequency
AC waveforms, AC = AC waveforms with frequencies in the range 10 to 300 Hz (usually derived
from resonant systems), Withstand = Hipot, DAC = Damped AC or Oscillating Wave.
At first sight this analysis may appear to be only from a historical interest. However, the changes
reflect changes in equipment, improvements in application knowledge and standards activities that
have been ongoing during the intervening eight years.
Copyright © 2016, Georgia Tech Research Corporation
Cable Diagnostic Focused Initiative (CDFI)
Phase II, Released February 2016
4-7
2006
Figure 2: Range of Usage for the different diagnostic techniques – 2006
2014
Figure 3: Range of Usage for the different diagnostic techniques – 2014
VLF Withstand Simple
VLF TD
VLF Monitored W
ithstand TD
PD AC &
VLF
None
DC Withstand Simple
80
70
60
50
40
30
20
10
0
Technique
Usage2006(%)
13.05
3.552.8
5.85
72
2.7
VLF Withstand Simple
VLF TD
VLF Monitored W
ithstand TD
PD AC &
VLF
None
DC Withstand Simple
80
70
60
50
40
30
20
10
0
Technique
Usage2014(%)
15
4.5
8
6
65
2
Copyright © 2016, Georgia Tech Research Corporation
Cable Diagnostic Focused Initiative (CDFI)
Phase II, Released February 2016
4-8
2006
Figure 4: Usage for diagnostic approaches (left) & voltage sources (right) – 2006
2014
Figure 5: Usage for diagnostic approaches (left) & voltage sources (right) – 2014
Inspection of the cable diagnostic testing technology usage above at MV enables the techniques to
be grouped into two broad categories: Mainstream & Niche.
VLFDCDAC10 - 300 HzHipotDiagnostic
35
30
25
20
15
10
5
0
Voltage Source
Usage2006(%)
20
2.7
0
4.9
15.8
8
VLFDCDAC10 - 300HzHipotDiagnostic
35
30
25
20
15
10
5
0
Voltage Source
Usage2014(%)
28
2
0
5
17
18
Copyright © 2016, Georgia Tech Research Corporation
Cable Diagnostic Focused Initiative (CDFI)
Phase II, Released February 2016
4-9
a) Mainstream techniques
i. Time- Domain Reflectometry (TDR);
ii. Tan δ at Very Low Frequencies (VLF);
iii. Simple Withstand Tests at Elevated Very Low Frequencies (VLF);
iv. Simple Withstand Tests at Elevated Resonant ac – HV & EHV only;
v. Monitored Withstand Tests at Elevated Very Low Frequencies (VLF) with
simultaneous monitoring of Tan δ;
vi. Monitored Withstand Tests at Elevated Resonant ac with simultaneous monitoring of
PD – HV & EHV only;
vii. Partial Discharge (PD) at elevated Resonant ac or Very Low Frequencies (VLF)
Voltages.
b) Niche techniques (not routinely deployed but where equipment maybe/has been
commercially available);
i. Partial Discharge (PD) at elevated Damped ac (DAC) Voltages;
ii. Combined Diagnostic Tests at Very Low Frequencies (VLF) using sequential PD
and Tan δ;
iii. Dielectric Spectroscopy;
iv. DC Leakage Current;
v. Polarization and Depolarization Current;
vi. Recovery Voltage.
At the diagnostic technique level, evolutionary key takeaways are:
Time-Domain Reflectometry (TDR)
 Usage is difficult to determine.
 The level of usage is estimated to be in the range of 6% -10% in 2014, which is up from the
5% - 8% level of 2006.
VLF Tan δ
 Since 2006 the greatest evolution is in the areas of VLF sources and Tan δ measurement /
interpretation. In 2006 the devices were large, complicated to set up and difficult to transport
- a trailer or van was required. In 2014 these devices are now portable (one man can move
them) with complete integration of the VLF source and Tan δ measurement device in one
box.
 The level of usage has increased from 3.5% to 4.5%. However, this likely underestimates
that activity as there are a number of users who, between 2006 & 2014, adopted Tan δ and
then migrated to Monitored Withstand.
 The guidance provided in the updated IEEE Std. 400.2 has very likely supported the change.
Simple Withstand
 The use of Simple dc Withstand has continued to decline with the conversion to Simple VLF
Withstand. The rate of conversion would likely have been higher but it has been limited by
the availability of funding for new VLF test units.
 The growth of Simple VLF Withstand has continued (13.5% - 15%) both from adoption and
transfer from dc.
Copyright © 2016, Georgia Tech Research Corporation
Cable Diagnostic Focused Initiative (CDFI)
Phase II, Released February 2016
4-10
Monitored Withstand
 The biggest growth over this period was in the area of the Monitored Withstand: 2.8% in
2006 to 8% in 2014.
 The drivers of the growth have been two-fold:
- Miniaturization / simplification / availability of the equipment
- Guidance & familiarity stimulated by IEEE Std. 400 & IEEE Std. 400.2
Damped AC (DAC) Partial Discharge
 This technique shows great promise for PD detection in the field by utilities; however, there
are currently no users of this technique in the USA or Canada.
Partial Discharge
 The use of PD in the offline mode has been essentially static over the time period in the
utility space
VLF Simple Withstand
 The estimates for 2014 show that VLF is the most preferred of the test voltages
 The increase in usage since 2006 (20% - 28%) is notable and statistically significant
Withstand (Hipot) vs Diagnostic
 In 2006 Withstand (Hipot) was the most preferred mode of operation
 In 2014 the use of withstand (Hipot) increased by 1.2%, while diagnostic tests have
increased by 10%
 In 2014 both withstand (Hipot) and diagnostic tests usage are equal
In all the above comments it is important to recall that in this work, for a technique to be considered
a utility diagnostic used by a utility, the technique has to be part of a normal / established activity
for determining cable system asset health on new and aged cable systems. Thus pilot studies,
industrial applications, commercial energy generation (wind farms etc.) and laboratory experiments
are not included. Usage estimates that include these applications might be at variance with those
provided here.
4.2 Choosing the Most Appropriate Diagnostic Program for an MV Cable System
As noted in other chapters “there is no one right approach” to cable system diagnostic testing. Each
situation/cable circuit/area/region/utility is likely to have conditions and priorities that will dictate
an approach that is unique for that segment. This section offers a general perspective on how the
information included in other chapters of this report can be used to select the most appropriate
diagnostic for the circuit or set of circuits under consideration.
The preceding section has shown how the usage of diagnostics has changed over the relatively short
span of this project. Thus it is unwise to use the simple expedient approach of using previous
experience / recommendations to guide the choice as the whole arena has changed so dramatically.
Copyright © 2016, Georgia Tech Research Corporation
Cable Diagnostic Focused Initiative (CDFI)
Phase II, Released February 2016
4-11
At first sight, the diagnostic selection process would appear to be solely based on technical
principles. However, experience gained from 10 years of conducting the CDFI research (from
surveys of practitioners, internal discussions and working with more than 25 CDFI participants)
shows that diagnostic testing decisions are very often based on a variety of perspectives, including
asset management, reliability engineering, dielectric science as well as a very good dose of social
science.
The social science perspective can cause the most difficulty for engineers. However, it is a vital
part of the diagnostic selection process because it requires engineers to consider topics that are
qualitative in nature, such as,
 risk tolerance;
 interfaces with field personnel (including the operators and test crews before, during and
after test);
 likely outcomes from the test;
 skill level required to perform the test;
 decision making process during the test; and
 decision making process after the test is performed.
The comments and guidance included in this chapter encompass all of these elements and thus may
be considered as a tabulated (rather than software based) expert system.
Thus this chapter is primarily directed towards:
 Personnel who are not familiar with diagnostic testing
 Experienced personnel who are looking to test in new geographic areas and / or test cable
systems they have not previously tested
The approaches discussed are offered as only as suggestions and are based on what has worked for
others unfamiliar with the topic. It is important to recognize that any approach should start from the
needs of the program (essentially the social science) rather than first choosing a diagnostic
technology and then trying to find a good location to use it.
4.2.1 Getting Started
To begin, it is important to remember the following:
1) Treat the cable circuits as a system – not simply a cable or a cable accessory. It is not
possible to perform a diagnostic test on just a segment of cable or just an accessory. All
cable circuits consist of both elements so the circuit it must be treated as a system.
2) Gather as much information as possible about the cable system including its age, accessory
types, cable design, insulation type and the failure history
3) Establish why diagnostic tests should be performed on your cable system.
4) Establish the potential diagnostic technologies are available for performing the evaluation
and what it takes to deploy each technology (skills required, switching by field crews, etc.).
5) Establish your options for corrective actions (run to failure, repair, rejuvenate, replace).
Copyright © 2016, Georgia Tech Research Corporation
Cable Diagnostic Focused Initiative (CDFI)
Phase II, Released February 2016
4-12
So ‘why perform diagnostic tests on a cable system’? Interestingly, the reasons are quite varied.
Outlining the reason(s) does not directly dictate the specific diagnostic test approach to take.
However, a clear understanding of why you are performing diagnostic tests on your cable system
will help guide the decisions that need to be made once diagnostic data is obtained.
There are a number of drivers/motives for performing diagnostic tests on cable systems, including a
need to:
1. Help assure that a new system was properly installed
2. Help assure that an existing system was effectively repaired
3. Improve cable system reliability (reduce failures)
4. Prevent failures before they occur
5. Optimize the use of maintenance dollars
6. Optimize the use of capitol (cable replacement) dollars
7. Follow a management directive to use a specific diagnostic technology
4.2.2 The Process - SAGE
The NEETRAC research has led to the development of the acronym SAGE to describe the four
basic phases of an effective diagnostic program. SAGE was first developed in CDFI Phase I and
has been refined in Phase II.
These elements are described as follows:
Selection: This phase encompasses two actions:
a) choose the cable circuits to be tested; and
b) determine the constraints for the testing
Taken together, these actions lead to the selection of the most appropriate diagnostic technology to
use for the evaluation.
Action: This phase involves answering the question: What actions are likely to be taken as the
result of the diagnostic outcomes (results) or interpretations? The actions are in two groups (Act or
Not Act) and may include replacement, defer action, rejuvenation, and/or repair. These actions are
chosen based on what is most suitable for the cable system topology and most prevalent failure
mechanisms (local or global degradation).
Generation: This phase has been expanded to include two sequential parts:
a) Generating the test data
b) Using the measured data (singly or in combinations) to determine a final result which may
involve placing the cable system segments or circuits into an act or not act class or to establish
a health index.
Ultimately these two parts help to establish the preferred remediation (Action).
Copyright © 2016, Georgia Tech Research Corporation
Cable Diagnostic Focused Initiative (CDFI)
Phase II, Released February 2016
4-13
Evaluation: This phase provides answers to the questions: Are the methods employed for
Selection, Action, and Generation giving the expected results - lower rates of failure and increased
times between failures? Can the diagnostic elements be improved?
Figure 6 illustrates how the four components function together over time to produce, if implemented
properly, a reduction in the failure rate. Note that this benefit is not realized immediately nor does it
cease once the program has ended - there is a lag before the benefit is fully realized. Furthermore,
failure rates do not begin to change until the actions directed by the diagnostic testing (Generation)
are well underway. Selection, Generation, and Action are each defined stages in time while the
Evaluation component is ongoing throughout the entire test program and beyond.
Figure 6: Effect of SAGE on the Failure Rate of a Target Population
Note: the failure rate in Figure 6 continues to increase during the Selection and Generation phases.
Only after the actions are completed does the failure rate start to decrease. After some time, the
failure rate will begin to increase again and this would retrigger the SAGE process. Each phase of
the SAGE process is discussed in more detail in the following sections of this chapter.
4.2.2.1 Selection
The selection phase represents the first stage of the SAGE process. This process should be
performed before a diagnostic technology is chosen. Elements of the selection process that help the
user decide which circuits to test are outlined as follows:
Choosing the cable circuits to be tested
The utility should use all available data / knowledge to identify those circuits that may be
susceptible to failure within a chosen time horizon, generally 5-10 years. These circuits may be in
Copyright © 2016, Georgia Tech Research Corporation
Cable Diagnostic Focused Initiative (CDFI)
Phase II, Released February 2016
4-14
areas that have historically experienced higher than usual failure rates or may simply be of critical
importance to system operation or a combination of both. Regardless of the criteria used, the size
and composition of this population greatly affects potential reliability improvements and economic
savings resulting from the program.
These circuits constitute the “target population” that will be tested and acted on using one or more
diagnostic tests. Important considerations for the Selection process are:
System Construction
 How are the circuits used in the system?
 Is the system a radial, looped or network system?
 What level of redundancy is present?
 Can circuits be easily isolated without impacting customers?
 What is the cable design?
 voltage class
 insulation thickness
 insulation material (Polyethylene, EPR, fluid impregnated paper)
 metallic shield type (tape, LCT, wires)
 jacket (yes or no)
Available Historical Data
 Number of circuits of the same type in service
 their ages
 their failure histories
 If data are not available then simple heuristics may suffice – see Table 1.
Failure Projections
 How fast are failure rates increasing?
 If there are cable or accessory designs in use, in which are the failure rates increasing
fastest?
Prevalent Failure Mechanism
 What causes the most failures?
 What is the failure the mechanism?
 electrical (electrical or water trees)
 mechanical (damage)
 environmental (neutral corrosion)
 inherent (manufacturing imperfections)
 thermal in nature (overheating connectors)?
Objective
 Is the objective to:
 improve reliability?
 reduce maintenance costs?
 garner knowledge of system health before determining action to take?
 a combination of all three?
Copyright © 2016, Georgia Tech Research Corporation
Cable Diagnostic Focused Initiative (CDFI)
Phase II, Released February 2016
4-15
 Has a budget been allocated to achieve the objective?
The above information is invaluable in determining which circuits to test. However, the relative
importance of a circuit(s) is also essential since they will often supply important customers where
an outage would result in notable economic or newsworthy consequence for the utility.
Determine the testing constraints
It is very important to establish in advance what you can and cannot do or accept during a
diagnostic test program. A list of things to consider is outlined below.
Acceptability of Failure During Testing
 How much risk of failure can be tolerated?
 Is a failure tolerable during testing if circuits are subjected to elevated test voltages?
This is important because in many cases once a cable segment fails, testing in that area is curtailed
until a repair can be affected. This will noticeably impact the throughput/efficiency of the test
program.
Tolerance of Uncertainty
 How accommodating is the organization of uncertainty? Does your organization insist that
answers be black or white or is it accepting of shades of grey?
Performing Tests and Interpreting Results
 Will testing be performed by internal resources or subcontractor resources?
 Who will interpret the test results?
 Is the test interpretation processed internally or externally or by a subcontractor?
 Is the subcontractor part of the remediation process and therefore subject to bias when making
the interpretation?
Acceptance of Complexity and Transparency
 Is it institutionally acceptable to have a complex process for interpreting the results or is a
simple answer required?
 Does your company accept an answer without knowing how the data is processed (opaque
process), or does your company want to know, or be able to know at some future date, exactly
how the test results are used to make recommendations (transparency)
Note that as the information content of a diagnostic technique increases, so does the complexity.
Nimbleness of Decision Making - as the information content of a diagnostic technique increases so
does the need for real time decision making Is it institutionally appropriate for decisions to be
devolved to test crews or a subcontractor; both of these are often stakeholders in the remediation
process
Cost of the Diagnostic
 Does the estimated cost (cost per circuit = cost per day / throughput) of the diagnostic represent
a large portion of the replacement cost of the component?
Copyright © 2016, Georgia Tech Research Corporation
Cable Diagnostic Focused Initiative (CDFI)
Phase II, Released February 2016
4-16
Resolution of the Diagnostic
 Does the diagnostic provide enough information to classify the components into the desired
number of subpopulations?
The two part process above (choosing the circuits and establishing the constraints) results in very
good context information but is difficult to make actionable. The following example (Table 1)
illustrates how a company could collate this information as a means of classifying the circuits they
may want to test. The example area contains 14 circuits, which are classified by a two dimensional
selection matrix which balances failure rate against the impact of service failures.
Table 1: Example Selection Matrix - Qualitative – Residential Customers
FAILURE
RATE
More than Twice
Average Failure Rate
2 circuits
Between Average and
Twice Average Failure
Rate
2 circuits 2 circuits
Less than Average
Failure Rate
3 circuits 2 circuits 3 circuits
Failure in Service
has a Low Impact
Failure in Service
has a Medium
Impact
Failure in Service
has a High Impact
IMPACT OF FAILURE
Numeric information (number of circuits) is preferred to describe the cells. However, this
information may not be available. When that occurs, the cost of an outage could potentially be used
as an alias for the impact of service failures. The example in Table 2 is similar to Table 1, but the
data used is based upon the economic cost of a failure ($ pa) using the established DOE model
discussed in Chapter 14. In this table, the cost of an outage (failure) for the circuit(s) represented in
the cell is shown in bold. It is a function of the number of customers on the circuit(s) along with the
impact cost of an outage per 1000 customers. The cost of a failure per 1000 customer is a function
of the SAIFI and SAIDI rates for the circuits in question.
Table 2: Example Selection Matrix – Semi Quantitative – Residential Customers
FAILURE
RATE
140% Average SAIFI
(High SAIFI)
$600
100 customers
$6k/1000 customers
$0
0
$8k/1000 customers
$0
0
$10k/1000 customers
Average SAIFI
$0
0
$4k/1000 customers
$1200
200 customers
$6k/1000 customers
$1800
200 customers
$9k/1000 customers
60% Average SAIFI
(Low SAIFI)
$900
300 customers
$3k/1000 customers
$1000
200 customers
$5k/1000 customers
$2100
300 customers
$7k/1000 customers
50% Average SAIDI Average SAIDI 160% Average SAIDI
IMPACT OF A FAILURE
Copyright © 2016, Georgia Tech Research Corporation
Cable Diagnostic Focused Initiative (CDFI)
Phase II, Released February 2016
4-17
Ultimately, some decision making overlay is required. Work in the CDFI has shown that that a new
user of diagnostics should approach testing somewhat differently than an experienced user.
The differences are shown in Table 3 and Table 4. One of the most significant errors that new users
make is that they immediately attempt to test in the upper right hand area, where their experience
level is not sufficient to deal with the multitude of issues associated with an area that has a large
number of problems. A much more effective strategy is to start testing in either of the green areas
and then move to the green areas of Table 4 as experience increases.
Table 3: Interpretation of the Selection for a New User of Diagnostics
FAILURE
RATE
More than Twice
Average Failure Rate
Useful for gaining
experience, but
benefits are likely
low
Not optimal for a
new user - too many
issues to
handle/consider
Between Average and
Twice Average Failure
Rate
Useful for learning, with increasing
benefits but also increasing risks
Less than Average
Failure Rate
Not optimal – likely low benefit
Failure in Service
has a Low Impact
Failure in Service
has a Medium
Impact
Failure in Service
has a High Impact
IMPACT OF FAILURE
Table 4: Interpretation of the Selection for an Experienced User of Diagnostics
FAILURE
RATE
More than Twice
Average Failure Rate
Not Optimal –
likely low benefit
Optimal – maximum
benefits (with
maximum risks)
Between Average and
Twice Average Failure
Rate
Optimal - increasing benefits / risks
Less than Average
Failure Rate
Not Optimal – likely low benefit
Failure in Service
has a Low Impact
Failure in Service
has a Medium
Impact
Failure in Service
has a High Impact
IMPACT OF FAILURE
4.2.2.2 Action
The Action stage of the SAGE process refers to the establishment of possible repair and
replacement actions based on the results from the diagnostic test. Ideally, a specific action can be
established for each circuit tested based on the condition indicated from the diagnostic test. The
goal is to perform the minimum level of actions that will restore the circuit to reliable operation for
the next several years.
Copyright © 2016, Georgia Tech Research Corporation
Cable Diagnostic Focused Initiative (CDFI)
Phase II, Released February 2016
4-18
Each action has an associated cost and level of reliability improvement that it will deliver. For
example, the cost of replacing a bad splice in a 500 ft segment is very different from the cost of
replacing the entire segment. On the other hand, the reliability of the repaired segment is not likely
to be as high as the reliability of the replaced segment. An economic analysis can be used to
quantify the value for one action compared to another.
When considering cable systems, the list of available actions is relatively short and includes:
a) Wholesale Replacement – complete replacement of the entire target population;
b) Targeted Replacement – replace only the segments that the diagnostic test indicates are
degraded;
c) Repair – remove short length(s) of cable and replace with two joints and a piece of cable or
replace problematic accessories;
d) Rejuvenation – liquid injection (PE-based insulations); and
e) Do Nothing.
The choice of actions will affect the choice of diagnostic technique(s) since some diagnostics are
unable to locate specific points of degradation within a given segment. Furthermore, the
composition of the target population might limit the actions a utility is able to take.
Once a suitable approach for each diagnosis exists, tests may be performed on the target population
to generate the diagnostic data. This constitutes the next phase of the process – the Generation
phase.
4.2.2.3 Generation
The generation stage of the SAGE process starts with the choice of a suitable diagnostic followed
by testing on the target population of circuits. By definition, the diagnostic techniques measure
specific characteristics of the circuit thought to be symptomatic of known failure mechanisms.
Generation has two sequential parts:
a) generating the test data; and
b) using the measured data (singly or in combinations) to determine a final result (Action Class or
a Health Index).
The different diagnostic technologies available for generating test data are discussed in Section 4.3.
However, at this point it is useful to consider some examples.
The first example is for cable diagnostic tests made using Tan  (dielectric loss measurements). The
actual measured values are:
 sequences (usually 6) of Tan  data at 0.5Uo;
 sequences (usually 6) of Tan  data at 1.0 Uo; and
 sequences (usually 6) of Tan  data at 1.5Uo.
These measurements permit, derived parameters to be calculated:
Copyright © 2016, Georgia Tech Research Corporation
Cable Diagnostic Focused Initiative (CDFI)
Phase II, Released February 2016
4-19
 Tip Up;
 Tip Up of the Tip Up (Tu Tu);
 Standard deviation of Tan  at 1.0Uo; and
 Mean Tan  at 1.0 Uo.
The derived parameters enable, one of two determinations can be made:
a) The tested cable segment can be placed in one of the three classifications:
i. action required (AR);
ii. further study (FS); or
iii. no action required (NA).
OR
b) A Health Index can be calculated used to indicate where the tested cable segment lies along
the spectrum of cable segments tested to date i.e. this segment is the xth
percentile of all
similar cable systems tested to date.
The second example is for cable diagnostic tests made using Damped ac (DAC) partial discharge
measurements. In this case the actual measurements indicate one of the following and are
qualitatively/subjectively used to determine whether or not the tested cable segment falls into the
action required, further study or no action required category:
 discharge present above the background noise below 1U0 at location X;
 discharge present above the noise in range of U0 to 1.4U0 at location X; or
 discharge present above the noise above 1.4U0 at location X.
Although numerical values may be ascribed to this type of measurement, there is no adequate or
definitive method of interpreting the different numbers such that the tested cable circuit may be
placed into a specific condition category. This means that partial discharge measurements made on
similar cable circuits cannot be compared and partial discharge measurements made using different
technologies cannot be compared.
4.2.2.4 Evaluation
The final stage of the SAGE process is the evaluation stage. This is the stage where utility engineers
ask themselves: Are we getting what we expected? This question covers many issues, but can be
summarized in two key topics: (1) Cost and (2) Reliability. A diagnostic program must deliver
improved reliability at a lower cost as compared to other maintenance strategies to be considered
effective. Evaluation tools, such as those presented in Appendix A can be used to assess the impact
the program has made on system reliability. Furthermore, the utility can then adjust in real time to
improve program performance. The evaluation phase represents an ongoing process that remains in
place until the need again arises to conduct another diagnostic program.
Commissioning diagnostics are used shortly after a system is installed or after a repair. When
diagnostics are used for this purpose, the health (classification) of the system is not of primary
interest. The engineer simply wants to know if there are any significant defects caused by
installation workmanship. Generally, most new components are factory-tested (recognize that the
Copyright © 2016, Georgia Tech Research Corporation
Cable Diagnostic Focused Initiative (CDFI)
Phase II, Released February 2016
4-20
standards and implementations may be quite different from component type to component type) so
there is an expectation that there are no built-in defects. Thus the goal of performing the diagnostic
test is to help ensure that the system is free from gross defects. Importantly, the test technology and
test conditions selected for commissioning tests are generally not designed for aged systems and
should not be applied to aged systems. However, when new components or cable segments are
installed on an aged system, modifications to the test program may be required.
Condition assessment diagnostics are applied to aged cable systems. This is much more of a process
approach rather than spot check assessment using a pass/fail criterion. Consequently, it is important
to focus on classification and avoid doing harm (further weakening) to the system.
4.2.3 Information on the Diagnostic Techniques
Utility engineers have voiced a desire for guidance on the experience levels necessary for
conducting diagnostic tests and interpreting test results (the Generation phase of SAGE). Table 5
provides basic information garnered from the research activities on available diagnostic techniques,
their expected output and who is involved.
Copyright © 2016, Georgia Tech Research Corporation
Cable Diagnostic Focused Initiative (CDFI)
Phase II, Released February 2016
4-21
Table 5: Typical Diagnostic Technique Deployment
Technique
Testing
performed by
Interpretation of
Raw Data
Form of Output
to end user
Condition
Assessment
performed by
Time Domain
Reflectometry (TDR)
Utility or
Provider
Technician
Utility or Provider
Technician or
Engineer
TDR Trace
Utility or Provider
by comparison with
library of curves
Offline Partial Discharge
Resonant ac
Provider
Engineer
Provider
Engineer
Report with
classification
data 1
Provider using
Proprietary Criteria 4
Offline Partial Discharge
VLF
Provider or
Utility
Technician or
Engineer
Utility or Provider
Engineer
Data or Report
with
numeric data 2
Provider or Utility
using Knowledge
Rules 5
Offline Partial Discharge
DAC
Utility or
Provider
Technician
Utility or Provider
using Knowledge
Rules 5
Online Partial Discharge
Provider
Technician or
Engineer
Provider
Engineer
Report with
classification
data 1
Provider using
Proprietary Criteria 4
Tan δ (VLF)
Utility
Technician
Utility
Technician or
Engineer
Numeric data 2
Utility using
Knowledge Rules
from
IEEE Std. 400.2™
or CDFI Tools
Withstand
AC Resonant Utility
Technician
Utility
Technician or
Engineer
Survival data 3
(Pass / Fail)VLF
Monitored
Withstand
PD
Provider or
Utility
Provider or Utility
Engineer
Survival data 3
(Pass / Fail) &
numeric data 2
Utility using
Knowledge Rules
from
CDFI Tools
Tan δ
Utility
Technician
Utility
Technician or
Engineer
1
Classification Data – results are described in terms of the membership of a number of classes
ranging from good to poor performance (A, B, C; Repair, Replace, etc.); no information is
conveyed about the relative position within a class (it is not possible to prioritize within a class);
class membership can be determined by either Proprietary Criteria or Knowledge Rules.
2
Numeric Data – results are described in terms of a continuous variable (inception voltage, loss,
count etc).
3
Survival Data – two classes: Pass / Not Pass; no information is conveyed about the margin within
a class.
4
Proprietary Criteria – the membership in a class (see footnote 1 above) is determined by multiple
criteria for the measured and system data which are not open to scrutiny; the receiver of the
classification data (see footnote 1 above) is unable to reassess the class membership as they do not
(generally) have access to the measured data or the criteria; the receiver of the data has no means to
verify whether the criteria have changed (improved of degraded).
5
Knowledge Rules – the membership in a class (see footnote 1 above) is determined by multiple
criteria for the measured and system data which are open to scrutiny; the receiver of the
classification data (see footnote 1 above) is able to reassess the class membership as they have
Copyright © 2016, Georgia Tech Research Corporation
Cable Diagnostic Focused Initiative (CDFI)
Phase II, Released February 2016
4-22
access to the measured data and the criteria; the receiver of the data has a means to verify that the
criteria have remained unchanged over time.
As discussed earlier, the assessment provided by diagnostic testing technologies generally falls into
two location categories: global and local. Table 6 describes which diagnostic tests are most
commonly used for global and local assessments.
Table 6: Local vs. Global Assessments for Diagnostic Techniques
Technique
Identifies Local
Defects
Identifies Global
Degradation
Time Domain Reflectometry (TDR) X
Offline Partial Discharge (AC Resonant) X
Offline Partial Discharge (VLF) X
Offline Partial Discharge (DAC) X
Online Partial Discharge X *
Tan δ (VLF) X
Withstand
AC Resonant X**
VLF X**
DC (PILC Only) X**
Monitored
Withstand
AC Resonant PD X
VLF PD X
Tan δ X** X
* While traditional PD measurements focus on local defects, online providers sometimes provide an
assessment that is related to global condition assessment.
** The location is determined by TDR when dielectric puncture occurs
4.2.4 Choosing the most appropriate diagnostics - Selection
4.2.4.1 Basic Approach
In principle, the issues outlined in Section 4.2.1, Table 1 through Table 6 with the detailed
information in the diagnostic specific chapters provide sufficient information to select the most
appropriate diagnostic. However, those with little or no diagnostic testing experience may find the
information provided below to be a more convenient way to start the selection process.
The approach uses five questions help to identify options to consider:
1. Who do you anticipate will perform the tests?
2. How would you best describe your tolerance to dielectric failures on test (FOT)?
3. How would you best describe the majority of cable circuits in the portion of the system
under consideration?
4. How would you describe the age of the cable system?
Copyright © 2016, Georgia Tech Research Corporation
Cable Diagnostic Focused Initiative (CDFI)
Phase II, Released February 2016
4-23
5. Do you know what is failing?
Questions 1 and 2 are used in Table 7 to select the appropriate table with which to consider the
outputs from Questions 3 to 5.
The diagnostic suggestions take into account both the reliability engineering (electrical engineering
and dielectric science) and social science elements of the decision making process. Some of the
main rule of thumb/experience/heuristic based approaches are provided below:
Time-Domain Reflectometry (TDR)
 This test should be utilized on all but the most complicated / long circuits to obtain at a
minimum the length of the cable system.
 It provides useful information on the number of joints in a cable circuit.
 It can be difficult to interpret when multiple joints are present.
 It does not provide quantitative data on the condition of the cable neutral.
VLF Tan δ
 Test protocols are well defined and exist in approved industry standard (IEEE 400.xx).
 Assessment tools are available for interpreting the data into “No Action Required”, “Further
Study”, and “Action Required” classes for all insulation types.
 A Health Index can be determined.
 Is often conducted and interpreted by utility personnel.
Simple Withstand Voltage
 Test protocols exist (AC Resonant & VLF) and are described in approved industry standards
(IEEE 400.xx).
 AC Resonant, DC & VLF voltages meet the criteria for Withstand Tests.
 VLF withstand tests are useful for evaluating hybrid cable systems.
 This is the most straightforward diagnostic test to interpret and perform.
 This test is almost always conducted by utility personnel.
Monitored Withstand Voltage
 Test protocols are available (AC Resonant & VLF) and are described in an approved
industry standard (IEEE 400.xx).
 Assessment tools are available, for VLF Tan , to make decisions in real time while the test
is being performed, significantly increasing test program efficiency.
 Can be conducted and interpreted by utility personnel.
Partial Discharge (Damped AC (DAC))
 Technique is promising; however, there are no users of this technique in USA or Canada.
 May be conducted and interpreted by utility personnel.
Partial Discharge (AC Resonant & VLF)
 There is limited agreement in the industry on condition assessment if PD is present.
 No industry standard is available for interpreting PD measurements in the field.
Copyright © 2016, Georgia Tech Research Corporation
Cable Diagnostic Focused Initiative (CDFI)
Phase II, Released February 2016
4-24
 This is the most difficult diagnostic to employ in the field.
 This technique remains too complicated for most utilities to conduct and interpret on their
own, although recent automation efforts are improving usability.
It is important to recall that all the tables in this chapter should be useful for an experienced user but
are designed for:
 People first embarking on diagnostic testing; and
 People who have performed some diagnostic testing but are considering moving to a
different location / cable type / mode of operation.
4.2.4.2 Specific Guidance
Questions 1 and 2 (above) are used in Table 7 to select the appropriate table with which to consider
the outputs from Questions 3 to 5. Table 7 summarizes the research findings and provides specific
diagnostic technique suggestions based on a user’s tolerance for failures on test (FOTs) and who is
anticipated to conduct the test.
Table 7: Initial Diagnostic Screening Matrix
How would you best describe
your tolerance to dielectric
Failures on Test (FOT)
Who do you anticipate to undertake
the tests?
Utility Personnel Sub-Contractor
Acceptable to avoid Failures
in Service (FIS)
See
Table 8
See
Table 9
Should be Minimized but
Acceptable to avoid Failures
in Service (FIS)
See
Table 10
See
Not Acceptable (Very Few)
even to avoid Failures in
Service (FIS)
See
Table 12
See
Table 13
Table 8 through Table 13 use the research results to suggest reasonable tests to consider based on
what is known about the cable circuits under consideration from Table 7. If the text is in light blue,
the indicated test(s) might be undertaken but have a low likelihood of rendering useful information.
Copyright © 2016, Georgia Tech Research Corporation
Cable Diagnostic Focused Initiative (CDFI)
Phase II, Released February 2016
4-25
Table 8: Acceptable Risk of Failures on Test (FOT), Test by Utility Personnel
How would you describe the age of the cable system?
Howwouldyoubestdescribethemajorityofcablesinthecable
system
New Old
Extruded
TDR – Chapter 5 & 11
And
Simple VLF Withstand –
Chapter 9
Don’t know
what is failing
TDR – Chapter 5 & 11
And
Simple VLF Withstand – Chapter 9
TDR – Chapter 5 & 11
And
Monitored VLF Withstand –
Chapter 10
TDR – Chapter 5 & 11
And
VLF Tan Delta – Chapter 5
I think that
accessories are
failing
TDR – Chapter 5 & 11
And
Simple VLF Withstand – Chapter 9
TDR – Chapter 5 & 11
And
Monitored VLF Withstand –
Chapter 10
Hybrid
Simple VLF Withstand –
Chapter 9
Don’t know
what is failing
Simple VLF Withstand – Chapter 9
I think that
accessories are
failing
Simple VLF Withstand – Chapter 9
Paper
Simple VLF Withstand –
Chapter 9,
if possible consider TDR –
Chapter 4 & 11
Don’t know
what is failing
Simple VLF Withstand – Chapter 9,
if possible consider
TDR – Chapter 5 & 11
Simple DC Withstand –
Chapter 9
I think that
accessories are
failing
TDR – Chapter 4 & 11
And
Simple VLF Withstand – Chapter 9
Copyright © 2016, Georgia Tech Research Corporation
Cable Diagnostic Focused Initiative (CDFI)
Phase II, Released February 2016
4-26
Table 9: Acceptable Risk of Failures on Test (FOT), Test by Sub-Contractors
How would you describe the age of the cable system?
Howwouldyoubestdescribethemajorityofcablesinthecable
system
New Old
Extruded
TDR – Chapter 5 & 11
And
Simple VLF Withstand –
Chapter 9
Don’t know
what is failing
TDR – Chapter 5 & 11
And
Monitored VLF Withstand –
Chapter 10
TDR – Chapter 5 & 11
And
VLF Tan Delta – Chapter 5
TDR – Chapter 5 & 11
And
Simple VLF Withstand – Chapter 9
I think that
accessories are
failing
TDR – Chapter 5 & 11
And
Monitored VLF Withstand – Chapter
10
TDR – Chapter 5 & 11
And
Simple VLF Withstand – Chapter 9
Hybrid
Simple VLF Withstand –
Chapter 9
Don’t know
what is failing
Simple VLF Withstand – Chapter 9
I think that
accessories are
failing
Simple VLF Withstand – Chapter 9
Paper
Simple VLF Withstand –
Chapter 9,
And
TDR – Chapter 4 & 11
Don’t know
what is failing
Simple VLF Withstand – Chapter 9,
And
TDR – Chapter 5 & 11
Simple DC Withstand –
Chapter 9
I think that
accessories are
failing
TDR – Chapter 4 & 11
And
Simple VLF Withstand – Chapter 9
If the text is in light blue, the indicated test(s) might be undertaken but have a low likelihood of
rendering useful information.
Copyright © 2016, Georgia Tech Research Corporation
Cable Diagnostic Focused Initiative (CDFI)
Phase II, Released February 2016
4-27
Table 10: Minimal Risk of Failures on Test (FOT), Test by Utility Personnel
How would you describe the age of the cable system?
Howwouldyoubestdescribethemajorityofcablesin
thecablesystem
New Old
Extruded
TDR – Chapter 5 & 11
And
Simple VLF Withstand –
Chapter 9
Don’t know what
is failing
TDR – Chapter 5 & 11
And
Monitored VLF Withstand –
Chapter 10
TDR – Chapter 5 & 11
And
VLF Tan Delta – Chapter 5
I think that
accessories are
failing
TDR – Chapter 5 & 11
And
Monitored VLF Withstand –
Chapter 10
Hybrid
Simple VLF Withstand –
Chapter 9
Don’t know what
is failing
Simple VLF Withstand – Chapter
9
I think that
accessories are
failing
Simple VLF Withstand – Chapter
9
Paper
Simple VLF Withstand –
Chapter 9,
if possible consider TDR –
Chapter 4 & 11
Don’t know what
is failing
Simple VLF Withstand – Chapter
9,
if possible consider
TDR – Chapter 5 & 11
Simple DC Withstand –
Chapter 9
I think that
accessories are
failing
TDR – Chapter 4 & 11
And
Simple VLF Withstand – Chapter
9
Copyright © 2016, Georgia Tech Research Corporation
Cable Diagnostic Focused Initiative (CDFI)
Phase II, Released February 2016
4-28
Table 11: Minimal Risk of Failures on Test (FOT), Test by Sub Contractors
How would you describe the age of the cable system?
Howwouldyoubestdescribethemajorityofcablesinthecablesystem
New Old
Extruded
TDR – Chapter 5 & 11
And
Simple VLF Withstand –
Chapter 9 Don’t know
what is failing
TDR – Chapter 5 & 11
And
Monitored VLF Withstand –
Chapter 10
TDR – Chapter 5 & 11
And
Offline PD – Chapter 7 or 8
TDR – Chapter 5 & 11
And
VLF Tan Delta – Chapter 5
I think that
accessories are
failing
TDR – Chapter 5 & 11
And
Monitored VLF Withstand – Chapter
10
TDR – Chapter 5 & 11
And
Offline PD – Chapter 7 or 8
Hybrid
Simple VLF Withstand –
Chapter 9
Don’t know
what is failing
Monitored VLF Withstand – Chapter
10
Simple VLF Withstand – Chapter 9
I think that
accessories are
failing
Simple VLF Withstand – Chapter 9
Paper
Simple VLF Withstand –
Chapter 9,
And
TDR – Chapter 4 & 11
Don’t know
what is failing
Simple VLF Withstand – Chapter 9,
And
TDR – Chapter 5 & 11
Simple DC Withstand –
Chapter 9
I think that
accessories are
failing
TDR – Chapter 4 & 11
And
Simple VLF Withstand – Chapter 9
TDR – Chapter 4 & 11
And
Online PD – Chapter 7 or 8
If the text is in light blue, the indicated test(s) might be undertaken but have a low likelihood of
rendering useful information.
Copyright © 2016, Georgia Tech Research Corporation
Cable Diagnostic Focused Initiative (CDFI)
Phase II, Released February 2016
4-29
Table 12: Failures on Test (FOT) Not Acceptable, Test by Utility Personnel
How would you describe the age of the cable system
Howwouldyoubestdescribethemajorityofcablesin
thecablesystem
New Old
Extruded
TDR – Chapter 5 &
11
Don’t know
what is
failing
TDR – Chapter 5 & 11
And
VLF Tan Delta – Chapter 5
I think that
accessories
are failing
TDR – Chapter 5 & 11
And
VLF Tan Delta – Chapter 5
Hybrid Nothing Available
Don’t know
what is
failing
Nothing Available
I think that
accessories
are failing
Nothing Available
Paper
Nothing Available
Don’t know
what is
failing
Nothing Available
Nothing Available
I think that
accessories
are failing
TDR – Chapter 5 & 11
If the text is in light blue, the indicated test(s) might be undertaken but have a low likelihood of
rendering useful information.
Copyright © 2016, Georgia Tech Research Corporation
Cable Diagnostic Focused Initiative (CDFI)
Phase II, Released February 2016
4-30
Table 13: Failures on Test (FOT) Not Acceptable, Test by Sub Contractors
How would you describe the age of the cable system
Howwouldyoubestdescribethemajorityofcablesinthecable
system
New Old
Extruded
TDR – Chapter 5 & 11
And
Offline DAC PD –
Chapter 7 & 8
Don’t know
what is failing
TDR – Chapter 5 & 11
And
VLF Tan Delta – Chapter 5
TDR – Chapter 5 & 11
And
Offline DAC PD – Chapter 7 & 8
I think that
accessories are
failing
TDR – Chapter 5 & 11
And
VLF Tan Delta – Chapter 5
TDR – Chapter 5 & 11
And
Offline DAC PD – Chapter 7 & 8
Online PD – Chapter 7
Hybrid
TDR – Chapter 5 & 11
And
Offline DAC PD –
Chapter 7 & 8
Don’t know
what is failing
Nothing Available
I think that
accessories are
failing
Online PD – Chapter 7
Paper
TDR – Chapter 5 & 11
And
Offline DAC PD –
Chapter 7 & 8
Don’t know
what is failing
VLF Tan Delta – Chapter 5
Online PD – Chapter 7
Offline DAC PD – Chapter 7
Online PD – Chapter 7
I think that
accessories are
failing
Online PD – Chapter 7
Offline DAC PD – Chapter 7
If the text is in light blue, the indicated test(s) might be undertaken but have a low likelihood of
rendering useful information.
Copyright © 2016, Georgia Tech Research Corporation
Cable Diagnostic Focused Initiative (CDFI)
Phase II, Released February 2016
4-31
The Decision Tables (Table 8 - Table 13) above can be quite intimidating as they display the
plethora of options and the potential solutions revealed by this research. In an effort to make them
more understandable, two Case Studies are presented to demonstrate their use.
Case 1:
Assume that you are a new user, the failure rate is 150% of average and failures in service have a
high impact. Table 3 shows that we know that diagnostic testing is a reasonable thing to do (Useful
for learning, with increasing benefits but also increasing risks).
Now we need to answer additional questions (see section 4.4.1):
1. Who is the service provider? Diagnostic testing would be performed by a sub-contractor.
2. What is the acceptability of Failures on Test (FOT)? Failures on test are acceptable but
should be minimized.
3. What is the cable type? Majority of the cables on the system are extruded
4. What is the cable age? Old
5. What is failing? Accessories
With this information, Table 7 tells us that we should go to Table 11. Table 11 indicates to us that
the following diagnostic test technologies are recommended and directs us to the specific chapter
for further guidance:
1. TDR – Chapter 5 & 11
2. Monitored VLF Withstand – Chapter 10
3. Offline PD – Chapter 7 or 8
Case 2:
Now assume that you are a new user, the failure rate is 250% of average and failures in service have
a low impact. Table 3 shows that we know that diagnostic testing should be very beneficial
(Optimal – maximum benefits with maximum risks).
Now we need to answer additional questions:
1. Who is the service provider? Diagnostic testing would be performed by a utility crew.
2. What is the acceptability of Failures on Test (FOT)? Failures on test are acceptable.
3. What is the cable type? Hybrid (mixture)
4. What is the cable age? Old
5. What is failing? Don’t know
With this information, Table 7 tells us that we should go to Table 8. Table 8 indicates to us that the
following diagnostic test technologies are recommended and directs us to the specific chapter for
further guidance:
1. Simple VLF
Copyright © 2016, Georgia Tech Research Corporation
Cable Diagnostic Focused Initiative (CDFI)
Phase II, Released February 2016
4-32
A blank assessment template is provided below as a convenient method for recording the
circumstances for your situation and the answers to the five questions.
FAILURE
RATE
More than Twice
Average Failure Rate
Between Average and
Twice Average Failure
Rate
Less than Average
Failure Rate
Failure in Service
has a Low Impact
Failure in Service
has a Medium
Impact
Failure in Service
has a High Impact
IMPACT OF FAILURE
Describe Area chosen for Testing:
Relevant History of Cable System
1. Who do you anticipate to undertake the
tests?
2. How would you best describe your
tolerance to dielectric Failures On Test
(FOT)?
Table 7 indicates Table
3. How would you best describe the majority
of cables in the cable system?
4. How would you describe the age of the
cable system?
5. In your Old Cable System - Do you know
what is failing
Consider the following Diagnostics (Taken from relevant Table (Table 8 to Table 13)
Copyright © 2016, Georgia Tech Research Corporation
Cable Diagnostic Focused Initiative (CDFI)
Phase II, Released February 2016
4-33
4.3 Summary
The complexity of cable system diagnostic testing can be daunting for those unfamiliar with the
process. The research information in this chapter is intended help by condensing a plethora of
information on diagnostic testing into a series of easy to follow steps or processes. The discussion is
designed to help potential cable diagnostic technology users a way to focus on the relevant issues.
It does this by providing an overview of how to approach diagnostic testing with a quick review of
available technologies and how they might reasonably be deployed under a given set of
circumstances.
It is important to reinforce the fact that these are general guidelines. Someone with an advanced
knowledge of diagnostic testing may choose to take a different approach and still achieve positive
outcomes. However the intent is to point unfamiliar users in the right direction such that they can
avoid costly mistakes and maximize the potential value of performing a cable system diagnostic test
program.

More Related Content

What's hot

NEETRAC (Chapter 11: Metallic Shield Assessment)
NEETRAC (Chapter 11: Metallic Shield Assessment)NEETRAC (Chapter 11: Metallic Shield Assessment)
NEETRAC (Chapter 11: Metallic Shield Assessment)AHMED MOHAMED HEGAB
 
NEETRAC (Chapter 6: Dissipation Factor)
NEETRAC (Chapter 6: Dissipation Factor)NEETRAC (Chapter 6: Dissipation Factor)
NEETRAC (Chapter 6: Dissipation Factor)AHMED MOHAMED HEGAB
 
NEETRAC (Chapter 12: Other Diagnostic Techniques)
NEETRAC (Chapter 12: Other Diagnostic Techniques)NEETRAC (Chapter 12: Other Diagnostic Techniques)
NEETRAC (Chapter 12: Other Diagnostic Techniques)AHMED MOHAMED HEGAB
 
NEETRAC (Chapter 13: Benefits of Diagnostics)
NEETRAC (Chapter 13: Benefits of Diagnostics)NEETRAC (Chapter 13: Benefits of Diagnostics)
NEETRAC (Chapter 13: Benefits of Diagnostics)AHMED MOHAMED HEGAB
 
NEETRAC (Chapter 10: Monitored Withstand Techniques)
NEETRAC (Chapter 10: Monitored Withstand Techniques)NEETRAC (Chapter 10: Monitored Withstand Techniques)
NEETRAC (Chapter 10: Monitored Withstand Techniques)AHMED MOHAMED HEGAB
 
High Voltage On-Site Testing with Partial Discharge Measurement (Cigre 502)
High Voltage On-Site Testing with Partial Discharge Measurement (Cigre 502)High Voltage On-Site Testing with Partial Discharge Measurement (Cigre 502)
High Voltage On-Site Testing with Partial Discharge Measurement (Cigre 502)AHMED MOHAMED HEGAB
 
Antenna System Guide
Antenna System GuideAntenna System Guide
Antenna System GuideHuynh MVT
 
INL-EXT-16-39808 CBP_ Design_Guidance
INL-EXT-16-39808 CBP_ Design_GuidanceINL-EXT-16-39808 CBP_ Design_Guidance
INL-EXT-16-39808 CBP_ Design_GuidanceJohanna Oxstrand
 
Obsolete and Emerging Technologies
Obsolete and Emerging TechnologiesObsolete and Emerging Technologies
Obsolete and Emerging TechnologiesMark G. Bearss
 
Overview of cable television
Overview of cable televisionOverview of cable television
Overview of cable televisionMinh Tiệp HP
 
Nema standards publication mg 2 2001
Nema standards publication mg 2 2001Nema standards publication mg 2 2001
Nema standards publication mg 2 2001Danilo Poma Muñoz
 
(Ebook pdf) - engineering - doe fuel cell handbook
(Ebook   pdf) - engineering - doe fuel cell handbook(Ebook   pdf) - engineering - doe fuel cell handbook
(Ebook pdf) - engineering - doe fuel cell handbookJupira Silva
 
Adams The Legalized Crime Of Banking And A Constitutional Remedy (1958)
Adams   The Legalized Crime Of Banking And A Constitutional Remedy (1958)Adams   The Legalized Crime Of Banking And A Constitutional Remedy (1958)
Adams The Legalized Crime Of Banking And A Constitutional Remedy (1958)legalservices
 
1183-FinalAssessmentReport-accessible
1183-FinalAssessmentReport-accessible1183-FinalAssessmentReport-accessible
1183-FinalAssessmentReport-accessibleYasoba Atukorale
 
How to implement digital medicine in the future
How to implement digital medicine in the futureHow to implement digital medicine in the future
How to implement digital medicine in the futureYoon Sup Choi
 
인공지능은 의료를 어떻게 혁신할 것인가 (ver 2)
인공지능은 의료를 어떻게 혁신할 것인가 (ver 2)인공지능은 의료를 어떻게 혁신할 것인가 (ver 2)
인공지능은 의료를 어떻게 혁신할 것인가 (ver 2)Yoon Sup Choi
 
Surgency Hacking for Defense 2017
Surgency Hacking for Defense 2017Surgency Hacking for Defense 2017
Surgency Hacking for Defense 2017Stanford University
 

What's hot (17)

NEETRAC (Chapter 11: Metallic Shield Assessment)
NEETRAC (Chapter 11: Metallic Shield Assessment)NEETRAC (Chapter 11: Metallic Shield Assessment)
NEETRAC (Chapter 11: Metallic Shield Assessment)
 
NEETRAC (Chapter 6: Dissipation Factor)
NEETRAC (Chapter 6: Dissipation Factor)NEETRAC (Chapter 6: Dissipation Factor)
NEETRAC (Chapter 6: Dissipation Factor)
 
NEETRAC (Chapter 12: Other Diagnostic Techniques)
NEETRAC (Chapter 12: Other Diagnostic Techniques)NEETRAC (Chapter 12: Other Diagnostic Techniques)
NEETRAC (Chapter 12: Other Diagnostic Techniques)
 
NEETRAC (Chapter 13: Benefits of Diagnostics)
NEETRAC (Chapter 13: Benefits of Diagnostics)NEETRAC (Chapter 13: Benefits of Diagnostics)
NEETRAC (Chapter 13: Benefits of Diagnostics)
 
NEETRAC (Chapter 10: Monitored Withstand Techniques)
NEETRAC (Chapter 10: Monitored Withstand Techniques)NEETRAC (Chapter 10: Monitored Withstand Techniques)
NEETRAC (Chapter 10: Monitored Withstand Techniques)
 
High Voltage On-Site Testing with Partial Discharge Measurement (Cigre 502)
High Voltage On-Site Testing with Partial Discharge Measurement (Cigre 502)High Voltage On-Site Testing with Partial Discharge Measurement (Cigre 502)
High Voltage On-Site Testing with Partial Discharge Measurement (Cigre 502)
 
Antenna System Guide
Antenna System GuideAntenna System Guide
Antenna System Guide
 
INL-EXT-16-39808 CBP_ Design_Guidance
INL-EXT-16-39808 CBP_ Design_GuidanceINL-EXT-16-39808 CBP_ Design_Guidance
INL-EXT-16-39808 CBP_ Design_Guidance
 
Obsolete and Emerging Technologies
Obsolete and Emerging TechnologiesObsolete and Emerging Technologies
Obsolete and Emerging Technologies
 
Overview of cable television
Overview of cable televisionOverview of cable television
Overview of cable television
 
Nema standards publication mg 2 2001
Nema standards publication mg 2 2001Nema standards publication mg 2 2001
Nema standards publication mg 2 2001
 
(Ebook pdf) - engineering - doe fuel cell handbook
(Ebook   pdf) - engineering - doe fuel cell handbook(Ebook   pdf) - engineering - doe fuel cell handbook
(Ebook pdf) - engineering - doe fuel cell handbook
 
Adams The Legalized Crime Of Banking And A Constitutional Remedy (1958)
Adams   The Legalized Crime Of Banking And A Constitutional Remedy (1958)Adams   The Legalized Crime Of Banking And A Constitutional Remedy (1958)
Adams The Legalized Crime Of Banking And A Constitutional Remedy (1958)
 
1183-FinalAssessmentReport-accessible
1183-FinalAssessmentReport-accessible1183-FinalAssessmentReport-accessible
1183-FinalAssessmentReport-accessible
 
How to implement digital medicine in the future
How to implement digital medicine in the futureHow to implement digital medicine in the future
How to implement digital medicine in the future
 
인공지능은 의료를 어떻게 혁신할 것인가 (ver 2)
인공지능은 의료를 어떻게 혁신할 것인가 (ver 2)인공지능은 의료를 어떻게 혁신할 것인가 (ver 2)
인공지능은 의료를 어떻게 혁신할 것인가 (ver 2)
 
Surgency Hacking for Defense 2017
Surgency Hacking for Defense 2017Surgency Hacking for Defense 2017
Surgency Hacking for Defense 2017
 

Similar to NEETRAC (Chapter 4: How to Start)

Penetration Testing Procedures & Methodologies.pdf
Penetration Testing Procedures & Methodologies.pdfPenetration Testing Procedures & Methodologies.pdf
Penetration Testing Procedures & Methodologies.pdfHimalaya raj Sinha
 
General Principals Of Software Validation
General Principals Of Software ValidationGeneral Principals Of Software Validation
General Principals Of Software Validationstaciemarotta
 
Mobile Healthcare: Patient Data Delivery by Jim Bloedau
Mobile Healthcare: Patient Data Delivery by Jim BloedauMobile Healthcare: Patient Data Delivery by Jim Bloedau
Mobile Healthcare: Patient Data Delivery by Jim BloedauHIMSS
 
Online Psychological Testing by Australian Psychological Society (2018)
Online Psychological Testing by Australian Psychological Society (2018)Online Psychological Testing by Australian Psychological Society (2018)
Online Psychological Testing by Australian Psychological Society (2018)Fian Rizky
 
Final Report on the Cost-Effectiveness of Providing HIV Testing and Counselin...
Final Report on the Cost-Effectiveness of Providing HIV Testing and Counselin...Final Report on the Cost-Effectiveness of Providing HIV Testing and Counselin...
Final Report on the Cost-Effectiveness of Providing HIV Testing and Counselin...HFG Project
 
Partnerships in Clinical Trials 2014
Partnerships in Clinical Trials 2014Partnerships in Clinical Trials 2014
Partnerships in Clinical Trials 2014The Avoca Group
 
AIDSTAR-One Namibia Alcohol Demonstration Endline Report
AIDSTAR-One Namibia Alcohol Demonstration Endline ReportAIDSTAR-One Namibia Alcohol Demonstration Endline Report
AIDSTAR-One Namibia Alcohol Demonstration Endline ReportAIDSTAROne
 
Benefits of PD diagnosis on GIS condition assessment
Benefits of PD diagnosis on GIS condition assessmentBenefits of PD diagnosis on GIS condition assessment
Benefits of PD diagnosis on GIS condition assessmentPower System Operation
 
Dr Dev Kambhampati | USAID- Supply Chain Costing Tool User's Manual
Dr Dev Kambhampati | USAID- Supply Chain Costing Tool User's ManualDr Dev Kambhampati | USAID- Supply Chain Costing Tool User's Manual
Dr Dev Kambhampati | USAID- Supply Chain Costing Tool User's ManualDr Dev Kambhampati
 
Solar powering your community, a guide for local governments
Solar powering your community, a guide for local governmentsSolar powering your community, a guide for local governments
Solar powering your community, a guide for local governmentsJustin Bean
 
Using BCMA to Improve Quality & Safety
Using BCMA to Improve Quality & SafetyUsing BCMA to Improve Quality & Safety
Using BCMA to Improve Quality & Safetysafecomputers
 
Standards for improving the quality of care for children and young adolescent...
Standards for improving the quality of care for children and young adolescent...Standards for improving the quality of care for children and young adolescent...
Standards for improving the quality of care for children and young adolescent...Trinity Care Foundation
 
Population health management resource guide.pdf
Population health management resource guide.pdfPopulation health management resource guide.pdf
Population health management resource guide.pdfAliMusa44
 
Inspirata_Inc._Award_Write_Up
Inspirata_Inc._Award_Write_UpInspirata_Inc._Award_Write_Up
Inspirata_Inc._Award_Write_UpAnuj Seth
 
Technology Imperative Final
Technology Imperative  FinalTechnology Imperative  Final
Technology Imperative FinalMatthew DeFranco
 
H. Lee Moffitt Cancer Center and Research Institute, Inc. Request for Propos...
H. Lee Moffitt Cancer Center  and Research Institute, Inc. Request for Propos...H. Lee Moffitt Cancer Center  and Research Institute, Inc. Request for Propos...
H. Lee Moffitt Cancer Center and Research Institute, Inc. Request for Propos...WBDC of Florida
 
Good Laboratory practice and current good manufacturing practice
Good Laboratory practice and current good manufacturing practiceGood Laboratory practice and current good manufacturing practice
Good Laboratory practice and current good manufacturing practicePostgradoMLCC
 
Future market platforms and electric network optimization
Future market platforms and electric network optimization Future market platforms and electric network optimization
Future market platforms and electric network optimization Paul De Martini
 

Similar to NEETRAC (Chapter 4: How to Start) (20)

Penetration Testing Procedures & Methodologies.pdf
Penetration Testing Procedures & Methodologies.pdfPenetration Testing Procedures & Methodologies.pdf
Penetration Testing Procedures & Methodologies.pdf
 
General Principals Of Software Validation
General Principals Of Software ValidationGeneral Principals Of Software Validation
General Principals Of Software Validation
 
Mobile Healthcare: Patient Data Delivery by Jim Bloedau
Mobile Healthcare: Patient Data Delivery by Jim BloedauMobile Healthcare: Patient Data Delivery by Jim Bloedau
Mobile Healthcare: Patient Data Delivery by Jim Bloedau
 
Online Psychological Testing by Australian Psychological Society (2018)
Online Psychological Testing by Australian Psychological Society (2018)Online Psychological Testing by Australian Psychological Society (2018)
Online Psychological Testing by Australian Psychological Society (2018)
 
Final Report on the Cost-Effectiveness of Providing HIV Testing and Counselin...
Final Report on the Cost-Effectiveness of Providing HIV Testing and Counselin...Final Report on the Cost-Effectiveness of Providing HIV Testing and Counselin...
Final Report on the Cost-Effectiveness of Providing HIV Testing and Counselin...
 
Partnerships in Clinical Trials 2014
Partnerships in Clinical Trials 2014Partnerships in Clinical Trials 2014
Partnerships in Clinical Trials 2014
 
AIDSTAR-One Namibia Alcohol Demonstration Endline Report
AIDSTAR-One Namibia Alcohol Demonstration Endline ReportAIDSTAR-One Namibia Alcohol Demonstration Endline Report
AIDSTAR-One Namibia Alcohol Demonstration Endline Report
 
Benefits of PD diagnosis on GIS condition assessment
Benefits of PD diagnosis on GIS condition assessmentBenefits of PD diagnosis on GIS condition assessment
Benefits of PD diagnosis on GIS condition assessment
 
Dr Dev Kambhampati | USAID- Supply Chain Costing Tool User's Manual
Dr Dev Kambhampati | USAID- Supply Chain Costing Tool User's ManualDr Dev Kambhampati | USAID- Supply Chain Costing Tool User's Manual
Dr Dev Kambhampati | USAID- Supply Chain Costing Tool User's Manual
 
Monitoring and evaluation toolkit
Monitoring and evaluation toolkitMonitoring and evaluation toolkit
Monitoring and evaluation toolkit
 
Solar powering your community, a guide for local governments
Solar powering your community, a guide for local governmentsSolar powering your community, a guide for local governments
Solar powering your community, a guide for local governments
 
Using BCMA to Improve Quality & Safety
Using BCMA to Improve Quality & SafetyUsing BCMA to Improve Quality & Safety
Using BCMA to Improve Quality & Safety
 
Standards for improving the quality of care for children and young adolescent...
Standards for improving the quality of care for children and young adolescent...Standards for improving the quality of care for children and young adolescent...
Standards for improving the quality of care for children and young adolescent...
 
Population health management resource guide.pdf
Population health management resource guide.pdfPopulation health management resource guide.pdf
Population health management resource guide.pdf
 
Inspirata_Inc._Award_Write_Up
Inspirata_Inc._Award_Write_UpInspirata_Inc._Award_Write_Up
Inspirata_Inc._Award_Write_Up
 
Trial io pcori doc v1
Trial io pcori doc v1Trial io pcori doc v1
Trial io pcori doc v1
 
Technology Imperative Final
Technology Imperative  FinalTechnology Imperative  Final
Technology Imperative Final
 
H. Lee Moffitt Cancer Center and Research Institute, Inc. Request for Propos...
H. Lee Moffitt Cancer Center  and Research Institute, Inc. Request for Propos...H. Lee Moffitt Cancer Center  and Research Institute, Inc. Request for Propos...
H. Lee Moffitt Cancer Center and Research Institute, Inc. Request for Propos...
 
Good Laboratory practice and current good manufacturing practice
Good Laboratory practice and current good manufacturing practiceGood Laboratory practice and current good manufacturing practice
Good Laboratory practice and current good manufacturing practice
 
Future market platforms and electric network optimization
Future market platforms and electric network optimization Future market platforms and electric network optimization
Future market platforms and electric network optimization
 

More from AHMED MOHAMED HEGAB

IEEE Guide for Field Testing of Shielded Power Cable (IEEE 400.2 2013)
IEEE Guide for Field Testing of Shielded Power Cable (IEEE 400.2 2013)IEEE Guide for Field Testing of Shielded Power Cable (IEEE 400.2 2013)
IEEE Guide for Field Testing of Shielded Power Cable (IEEE 400.2 2013)AHMED MOHAMED HEGAB
 
IEEE Guide for the Application and Interpretation of FRA for oil Transformer
IEEE Guide for the Application and Interpretation of FRA for oil TransformerIEEE Guide for the Application and Interpretation of FRA for oil Transformer
IEEE Guide for the Application and Interpretation of FRA for oil TransformerAHMED MOHAMED HEGAB
 
Guidelines for Unconventional Partial Discharge Measurement (CIGRE 444)
Guidelines for Unconventional Partial Discharge Measurement (CIGRE 444)Guidelines for Unconventional Partial Discharge Measurement (CIGRE 444)
Guidelines for Unconventional Partial Discharge Measurement (CIGRE 444)AHMED MOHAMED HEGAB
 
Guide for Transformer Maintenance (Cigre-445)
Guide for Transformer Maintenance (Cigre-445)Guide for Transformer Maintenance (Cigre-445)
Guide for Transformer Maintenance (Cigre-445)AHMED MOHAMED HEGAB
 
Introduction to power quality (Megger)
Introduction to power quality (Megger)Introduction to power quality (Megger)
Introduction to power quality (Megger)AHMED MOHAMED HEGAB
 
Electrical Classic Control (Basics)
Electrical Classic Control (Basics)Electrical Classic Control (Basics)
Electrical Classic Control (Basics)AHMED MOHAMED HEGAB
 
Cable fault location methods (Megger)
Cable fault location methods (Megger)Cable fault location methods (Megger)
Cable fault location methods (Megger)AHMED MOHAMED HEGAB
 
Protection Relays Numbering (ANSI)
Protection Relays Numbering (ANSI)Protection Relays Numbering (ANSI)
Protection Relays Numbering (ANSI)AHMED MOHAMED HEGAB
 

More from AHMED MOHAMED HEGAB (11)

Testing of Transformer (AREVA)
Testing of Transformer (AREVA)Testing of Transformer (AREVA)
Testing of Transformer (AREVA)
 
IEEE Guide for Field Testing of Shielded Power Cable (IEEE 400.2 2013)
IEEE Guide for Field Testing of Shielded Power Cable (IEEE 400.2 2013)IEEE Guide for Field Testing of Shielded Power Cable (IEEE 400.2 2013)
IEEE Guide for Field Testing of Shielded Power Cable (IEEE 400.2 2013)
 
IEEE Guide for the Application and Interpretation of FRA for oil Transformer
IEEE Guide for the Application and Interpretation of FRA for oil TransformerIEEE Guide for the Application and Interpretation of FRA for oil Transformer
IEEE Guide for the Application and Interpretation of FRA for oil Transformer
 
Guidelines for Unconventional Partial Discharge Measurement (CIGRE 444)
Guidelines for Unconventional Partial Discharge Measurement (CIGRE 444)Guidelines for Unconventional Partial Discharge Measurement (CIGRE 444)
Guidelines for Unconventional Partial Discharge Measurement (CIGRE 444)
 
Tan Delta on MV Cables (Megger)
Tan Delta on MV Cables (Megger)Tan Delta on MV Cables (Megger)
Tan Delta on MV Cables (Megger)
 
Guide for Transformer Maintenance (Cigre-445)
Guide for Transformer Maintenance (Cigre-445)Guide for Transformer Maintenance (Cigre-445)
Guide for Transformer Maintenance (Cigre-445)
 
Introduction to power quality (Megger)
Introduction to power quality (Megger)Introduction to power quality (Megger)
Introduction to power quality (Megger)
 
Electrical Classic Control (Basics)
Electrical Classic Control (Basics)Electrical Classic Control (Basics)
Electrical Classic Control (Basics)
 
Reading of electrical drawing
Reading of electrical drawingReading of electrical drawing
Reading of electrical drawing
 
Cable fault location methods (Megger)
Cable fault location methods (Megger)Cable fault location methods (Megger)
Cable fault location methods (Megger)
 
Protection Relays Numbering (ANSI)
Protection Relays Numbering (ANSI)Protection Relays Numbering (ANSI)
Protection Relays Numbering (ANSI)
 

Recently uploaded

(SHREYA) Chakan Call Girls Just Call 7001035870 [ Cash on Delivery ] Pune Esc...
(SHREYA) Chakan Call Girls Just Call 7001035870 [ Cash on Delivery ] Pune Esc...(SHREYA) Chakan Call Girls Just Call 7001035870 [ Cash on Delivery ] Pune Esc...
(SHREYA) Chakan Call Girls Just Call 7001035870 [ Cash on Delivery ] Pune Esc...ranjana rawat
 
HARDNESS, FRACTURE TOUGHNESS AND STRENGTH OF CERAMICS
HARDNESS, FRACTURE TOUGHNESS AND STRENGTH OF CERAMICSHARDNESS, FRACTURE TOUGHNESS AND STRENGTH OF CERAMICS
HARDNESS, FRACTURE TOUGHNESS AND STRENGTH OF CERAMICSRajkumarAkumalla
 
Processing & Properties of Floor and Wall Tiles.pptx
Processing & Properties of Floor and Wall Tiles.pptxProcessing & Properties of Floor and Wall Tiles.pptx
Processing & Properties of Floor and Wall Tiles.pptxpranjaldaimarysona
 
Call Girls in Nagpur Suman Call 7001035870 Meet With Nagpur Escorts
Call Girls in Nagpur Suman Call 7001035870 Meet With Nagpur EscortsCall Girls in Nagpur Suman Call 7001035870 Meet With Nagpur Escorts
Call Girls in Nagpur Suman Call 7001035870 Meet With Nagpur EscortsCall Girls in Nagpur High Profile
 
Sheet Pile Wall Design and Construction: A Practical Guide for Civil Engineer...
Sheet Pile Wall Design and Construction: A Practical Guide for Civil Engineer...Sheet Pile Wall Design and Construction: A Practical Guide for Civil Engineer...
Sheet Pile Wall Design and Construction: A Practical Guide for Civil Engineer...Dr.Costas Sachpazis
 
UNIT-III FMM. DIMENSIONAL ANALYSIS
UNIT-III FMM.        DIMENSIONAL ANALYSISUNIT-III FMM.        DIMENSIONAL ANALYSIS
UNIT-III FMM. DIMENSIONAL ANALYSISrknatarajan
 
APPLICATIONS-AC/DC DRIVES-OPERATING CHARACTERISTICS
APPLICATIONS-AC/DC DRIVES-OPERATING CHARACTERISTICSAPPLICATIONS-AC/DC DRIVES-OPERATING CHARACTERISTICS
APPLICATIONS-AC/DC DRIVES-OPERATING CHARACTERISTICSKurinjimalarL3
 
Call for Papers - African Journal of Biological Sciences, E-ISSN: 2663-2187, ...
Call for Papers - African Journal of Biological Sciences, E-ISSN: 2663-2187, ...Call for Papers - African Journal of Biological Sciences, E-ISSN: 2663-2187, ...
Call for Papers - African Journal of Biological Sciences, E-ISSN: 2663-2187, ...Christo Ananth
 
CCS335 _ Neural Networks and Deep Learning Laboratory_Lab Complete Record
CCS335 _ Neural Networks and Deep Learning Laboratory_Lab Complete RecordCCS335 _ Neural Networks and Deep Learning Laboratory_Lab Complete Record
CCS335 _ Neural Networks and Deep Learning Laboratory_Lab Complete RecordAsst.prof M.Gokilavani
 
(ANVI) Koregaon Park Call Girls Just Call 7001035870 [ Cash on Delivery ] Pun...
(ANVI) Koregaon Park Call Girls Just Call 7001035870 [ Cash on Delivery ] Pun...(ANVI) Koregaon Park Call Girls Just Call 7001035870 [ Cash on Delivery ] Pun...
(ANVI) Koregaon Park Call Girls Just Call 7001035870 [ Cash on Delivery ] Pun...ranjana rawat
 
The Most Attractive Pune Call Girls Budhwar Peth 8250192130 Will You Miss Thi...
The Most Attractive Pune Call Girls Budhwar Peth 8250192130 Will You Miss Thi...The Most Attractive Pune Call Girls Budhwar Peth 8250192130 Will You Miss Thi...
The Most Attractive Pune Call Girls Budhwar Peth 8250192130 Will You Miss Thi...ranjana rawat
 
High Profile Call Girls Nagpur Isha Call 7001035870 Meet With Nagpur Escorts
High Profile Call Girls Nagpur Isha Call 7001035870 Meet With Nagpur EscortsHigh Profile Call Girls Nagpur Isha Call 7001035870 Meet With Nagpur Escorts
High Profile Call Girls Nagpur Isha Call 7001035870 Meet With Nagpur Escortsranjana rawat
 
Call for Papers - Educational Administration: Theory and Practice, E-ISSN: 21...
Call for Papers - Educational Administration: Theory and Practice, E-ISSN: 21...Call for Papers - Educational Administration: Theory and Practice, E-ISSN: 21...
Call for Papers - Educational Administration: Theory and Practice, E-ISSN: 21...Christo Ananth
 
(RIA) Call Girls Bhosari ( 7001035870 ) HI-Fi Pune Escorts Service
(RIA) Call Girls Bhosari ( 7001035870 ) HI-Fi Pune Escorts Service(RIA) Call Girls Bhosari ( 7001035870 ) HI-Fi Pune Escorts Service
(RIA) Call Girls Bhosari ( 7001035870 ) HI-Fi Pune Escorts Serviceranjana rawat
 
College Call Girls Nashik Nehal 7001305949 Independent Escort Service Nashik
College Call Girls Nashik Nehal 7001305949 Independent Escort Service NashikCollege Call Girls Nashik Nehal 7001305949 Independent Escort Service Nashik
College Call Girls Nashik Nehal 7001305949 Independent Escort Service NashikCall Girls in Nagpur High Profile
 
(MEERA) Dapodi Call Girls Just Call 7001035870 [ Cash on Delivery ] Pune Escorts
(MEERA) Dapodi Call Girls Just Call 7001035870 [ Cash on Delivery ] Pune Escorts(MEERA) Dapodi Call Girls Just Call 7001035870 [ Cash on Delivery ] Pune Escorts
(MEERA) Dapodi Call Girls Just Call 7001035870 [ Cash on Delivery ] Pune Escortsranjana rawat
 
KubeKraft presentation @CloudNativeHooghly
KubeKraft presentation @CloudNativeHooghlyKubeKraft presentation @CloudNativeHooghly
KubeKraft presentation @CloudNativeHooghlysanyuktamishra911
 
Introduction and different types of Ethernet.pptx
Introduction and different types of Ethernet.pptxIntroduction and different types of Ethernet.pptx
Introduction and different types of Ethernet.pptxupamatechverse
 
IMPLICATIONS OF THE ABOVE HOLISTIC UNDERSTANDING OF HARMONY ON PROFESSIONAL E...
IMPLICATIONS OF THE ABOVE HOLISTIC UNDERSTANDING OF HARMONY ON PROFESSIONAL E...IMPLICATIONS OF THE ABOVE HOLISTIC UNDERSTANDING OF HARMONY ON PROFESSIONAL E...
IMPLICATIONS OF THE ABOVE HOLISTIC UNDERSTANDING OF HARMONY ON PROFESSIONAL E...RajaP95
 

Recently uploaded (20)

(SHREYA) Chakan Call Girls Just Call 7001035870 [ Cash on Delivery ] Pune Esc...
(SHREYA) Chakan Call Girls Just Call 7001035870 [ Cash on Delivery ] Pune Esc...(SHREYA) Chakan Call Girls Just Call 7001035870 [ Cash on Delivery ] Pune Esc...
(SHREYA) Chakan Call Girls Just Call 7001035870 [ Cash on Delivery ] Pune Esc...
 
HARDNESS, FRACTURE TOUGHNESS AND STRENGTH OF CERAMICS
HARDNESS, FRACTURE TOUGHNESS AND STRENGTH OF CERAMICSHARDNESS, FRACTURE TOUGHNESS AND STRENGTH OF CERAMICS
HARDNESS, FRACTURE TOUGHNESS AND STRENGTH OF CERAMICS
 
Processing & Properties of Floor and Wall Tiles.pptx
Processing & Properties of Floor and Wall Tiles.pptxProcessing & Properties of Floor and Wall Tiles.pptx
Processing & Properties of Floor and Wall Tiles.pptx
 
Call Girls in Nagpur Suman Call 7001035870 Meet With Nagpur Escorts
Call Girls in Nagpur Suman Call 7001035870 Meet With Nagpur EscortsCall Girls in Nagpur Suman Call 7001035870 Meet With Nagpur Escorts
Call Girls in Nagpur Suman Call 7001035870 Meet With Nagpur Escorts
 
Sheet Pile Wall Design and Construction: A Practical Guide for Civil Engineer...
Sheet Pile Wall Design and Construction: A Practical Guide for Civil Engineer...Sheet Pile Wall Design and Construction: A Practical Guide for Civil Engineer...
Sheet Pile Wall Design and Construction: A Practical Guide for Civil Engineer...
 
UNIT-III FMM. DIMENSIONAL ANALYSIS
UNIT-III FMM.        DIMENSIONAL ANALYSISUNIT-III FMM.        DIMENSIONAL ANALYSIS
UNIT-III FMM. DIMENSIONAL ANALYSIS
 
APPLICATIONS-AC/DC DRIVES-OPERATING CHARACTERISTICS
APPLICATIONS-AC/DC DRIVES-OPERATING CHARACTERISTICSAPPLICATIONS-AC/DC DRIVES-OPERATING CHARACTERISTICS
APPLICATIONS-AC/DC DRIVES-OPERATING CHARACTERISTICS
 
DJARUM4D - SLOT GACOR ONLINE | SLOT DEMO ONLINE
DJARUM4D - SLOT GACOR ONLINE | SLOT DEMO ONLINEDJARUM4D - SLOT GACOR ONLINE | SLOT DEMO ONLINE
DJARUM4D - SLOT GACOR ONLINE | SLOT DEMO ONLINE
 
Call for Papers - African Journal of Biological Sciences, E-ISSN: 2663-2187, ...
Call for Papers - African Journal of Biological Sciences, E-ISSN: 2663-2187, ...Call for Papers - African Journal of Biological Sciences, E-ISSN: 2663-2187, ...
Call for Papers - African Journal of Biological Sciences, E-ISSN: 2663-2187, ...
 
CCS335 _ Neural Networks and Deep Learning Laboratory_Lab Complete Record
CCS335 _ Neural Networks and Deep Learning Laboratory_Lab Complete RecordCCS335 _ Neural Networks and Deep Learning Laboratory_Lab Complete Record
CCS335 _ Neural Networks and Deep Learning Laboratory_Lab Complete Record
 
(ANVI) Koregaon Park Call Girls Just Call 7001035870 [ Cash on Delivery ] Pun...
(ANVI) Koregaon Park Call Girls Just Call 7001035870 [ Cash on Delivery ] Pun...(ANVI) Koregaon Park Call Girls Just Call 7001035870 [ Cash on Delivery ] Pun...
(ANVI) Koregaon Park Call Girls Just Call 7001035870 [ Cash on Delivery ] Pun...
 
The Most Attractive Pune Call Girls Budhwar Peth 8250192130 Will You Miss Thi...
The Most Attractive Pune Call Girls Budhwar Peth 8250192130 Will You Miss Thi...The Most Attractive Pune Call Girls Budhwar Peth 8250192130 Will You Miss Thi...
The Most Attractive Pune Call Girls Budhwar Peth 8250192130 Will You Miss Thi...
 
High Profile Call Girls Nagpur Isha Call 7001035870 Meet With Nagpur Escorts
High Profile Call Girls Nagpur Isha Call 7001035870 Meet With Nagpur EscortsHigh Profile Call Girls Nagpur Isha Call 7001035870 Meet With Nagpur Escorts
High Profile Call Girls Nagpur Isha Call 7001035870 Meet With Nagpur Escorts
 
Call for Papers - Educational Administration: Theory and Practice, E-ISSN: 21...
Call for Papers - Educational Administration: Theory and Practice, E-ISSN: 21...Call for Papers - Educational Administration: Theory and Practice, E-ISSN: 21...
Call for Papers - Educational Administration: Theory and Practice, E-ISSN: 21...
 
(RIA) Call Girls Bhosari ( 7001035870 ) HI-Fi Pune Escorts Service
(RIA) Call Girls Bhosari ( 7001035870 ) HI-Fi Pune Escorts Service(RIA) Call Girls Bhosari ( 7001035870 ) HI-Fi Pune Escorts Service
(RIA) Call Girls Bhosari ( 7001035870 ) HI-Fi Pune Escorts Service
 
College Call Girls Nashik Nehal 7001305949 Independent Escort Service Nashik
College Call Girls Nashik Nehal 7001305949 Independent Escort Service NashikCollege Call Girls Nashik Nehal 7001305949 Independent Escort Service Nashik
College Call Girls Nashik Nehal 7001305949 Independent Escort Service Nashik
 
(MEERA) Dapodi Call Girls Just Call 7001035870 [ Cash on Delivery ] Pune Escorts
(MEERA) Dapodi Call Girls Just Call 7001035870 [ Cash on Delivery ] Pune Escorts(MEERA) Dapodi Call Girls Just Call 7001035870 [ Cash on Delivery ] Pune Escorts
(MEERA) Dapodi Call Girls Just Call 7001035870 [ Cash on Delivery ] Pune Escorts
 
KubeKraft presentation @CloudNativeHooghly
KubeKraft presentation @CloudNativeHooghlyKubeKraft presentation @CloudNativeHooghly
KubeKraft presentation @CloudNativeHooghly
 
Introduction and different types of Ethernet.pptx
Introduction and different types of Ethernet.pptxIntroduction and different types of Ethernet.pptx
Introduction and different types of Ethernet.pptx
 
IMPLICATIONS OF THE ABOVE HOLISTIC UNDERSTANDING OF HARMONY ON PROFESSIONAL E...
IMPLICATIONS OF THE ABOVE HOLISTIC UNDERSTANDING OF HARMONY ON PROFESSIONAL E...IMPLICATIONS OF THE ABOVE HOLISTIC UNDERSTANDING OF HARMONY ON PROFESSIONAL E...
IMPLICATIONS OF THE ABOVE HOLISTIC UNDERSTANDING OF HARMONY ON PROFESSIONAL E...
 

NEETRAC (Chapter 4: How to Start)

  • 1. Copyright © 2016, Georgia Tech Research Corporation Cable Diagnostic Focused Initiative (CDFI) Phase II, Released February 2016 4-1 CHAPTER 4 How to Start Nigel Hampton This chapter represents the state of the art at the time of release. Readers are encouraged to consult the link below for the version of this chapter with the most recent release date: http://www.neetrac.gatech.edu/cdfi-publications.html
  • 2. Copyright © 2016, Georgia Tech Research Corporation Cable Diagnostic Focused Initiative (CDFI) Phase II, Released February 2016 4-2 DISCLAIMER OF WARRANTIES AND LIMITATION OF LIABILITIES This document was prepared by Board of Regents of the University System of Georgia by and on behalf of the Georgia Institute of Technology NEETRAC (NEETRAC) as an account of work supported by the US Department of Energy and Industrial Sponsors through agreements with the Georgia Tech Research Institute (GTRC). Neither NEETRAC, GTRC, any member of NEETRAC or any cosponsor nor any person acting on behalf of any of them: a) Makes any warranty or representation whatsoever, express or implied, i. With respect to the use of any information, apparatus, method, process, or similar item disclosed in this document, including merchantability and fitness for a particular purpose, or ii. That such use does not infringe on or interfere with privately owned rights, including any party’s intellectual property, or iii. That this document is suitable to any particular user’s circumstance; or b) Assumes responsibility for any damages or other liability whatsoever (including any consequential damages, even if NEETRAC or any NEETRAC representative has been advised of the possibility of such damages) resulting from your selection or use of this document or any information, apparatus, method, process or similar item disclosed in this document. DOE Disclaimer: This report was prepared as an account of work sponsored by an agency of the United States Government. Neither the United States Government nor any agency thereof, nor any of their employees, makes any warranty, express or implied, or assumes any legal liability or responsibility for the accuracy, completeness, or usefulness of any information, apparatus, product, or process disclosed, or represents that its use would not infringe privately owned rights. Reference herein to any specific commercial product, process, or service by trade name, trademark, manufacturer, or otherwise does not necessarily constitute or imply its endorsement, recommendation, or favoring by the United States Government or any agency thereof. The views and opinions of authors expressed herein do not necessarily state or reflect those of the United States Government or any agency thereof. NOTICE Copyright of this report and title to the evaluation data contained herein shall reside with GTRC. Reference herein to any specific commercial product, process or service by its trade name, trademark, manufacturer or otherwise does not constitute or imply its endorsement, recommendation or favoring by NEETRAC. The information contained herein represents a reasonable research effort and is, to our knowledge, accurate and reliable at the date of publication. It is the user's responsibility to conduct the necessary assessments in order to satisfy themselves as to the suitability of the products or recommendations for the user's particular purpose.
  • 3. Copyright © 2016, Georgia Tech Research Corporation Cable Diagnostic Focused Initiative (CDFI) Phase II, Released February 2016 4-3 TABLE OF CONTENTS 4.0 How to Start................................................................................................................................... 4  4.1 Evolution of Cable System Diagnostics..................................................................................... 4  4.2 Choosing the Most Appropriate Diagnostic Program for an MV Cable System ..................... 10  4.2.1 Getting Started.................................................................................................................... 11  4.2.2 The Process - SAGE........................................................................................................... 12  4.2.2.1 Selection....................................................................................................................... 13  4.2.2.2 Action........................................................................................................................... 17  4.2.2.3 Generation.................................................................................................................... 18  4.2.2.4 Evaluation .................................................................................................................... 19  4.2.3 Information on the Diagnostic Techniques ........................................................................ 20  4.2.4 Choosing the most appropriate diagnostics - Selection ..................................................... 22  4.2.4.1 Basic Approach............................................................................................................ 22  4.2.4.2 Specific Guidance........................................................................................................ 24  4.3 Summary................................................................................................................................... 33  LIST OF FIGURES Figure 1: Range of Usage for the different diagnostic techniques - 2014 ........................................... 5  Figure 2: Range of Usage for the different diagnostic techniques – 2006........................................... 7  Figure 3: Range of Usage for the different diagnostic techniques – 2014........................................... 7  Figure 4: Usage for diagnostic approaches (left) & voltage sources (right) – 2006............................ 8  Figure 5: Usage for diagnostic approaches (left) & voltage sources (right) – 2014............................ 8  Figure 6: Effect of SAGE on the Failure Rate of a Target Population.............................................. 13  LIST OF TABLES Table 1: Example Selection Matrix - Qualitative – Residential Customers..................................... 16  Table 2: Example Selection Matrix – Semi Quantitative – Residential Customers .......................... 16  Table 3: Interpretation of the Selection for a New User of Diagnostics............................................ 17  Table 4: Interpretation of the Selection for an Experienced User of Diagnostics ............................. 17  Table 5: Typical Diagnostic Technique Deployment ........................................................................ 21  Table 6: Local vs. Global Assessments for Diagnostic Techniques.................................................. 22  Table 7: Initial Diagnostic Screening Matrix..................................................................................... 24  Table 8: Acceptable Risk of Failures on Test (FOT), Test by Utility Personnel............................... 25  Table 9: Acceptable Risk of Failures on Test (FOT), Test by Sub-Contractors................................ 26  Table 10: Minimal Risk of Failures on Test (FOT), Test by Utility Personnel................................. 27  Table 11: Minimal Risk of Failures on Test (FOT), Test by Sub Contractors.................................. 28  Table 12: Failures on Test (FOT) Not Acceptable, Test by Utility Personnel .................................. 29  Table 13: Failures on Test (FOT) Not Acceptable, Test by Sub Contractors.................................... 30 
  • 4. Copyright © 2016, Georgia Tech Research Corporation Cable Diagnostic Focused Initiative (CDFI) Phase II, Released February 2016 4-4 4.0 HOW TO START The section of a diagnostic technology should be made near the start of the process, but not right at the start, of the diagnostic testing process. At first sight, the choice may appear to be simple and might be based on prior experience or recommendations from colleagues/fellow utilities or sales/marketing materials. However, the decision is actually quite complex and requires a review of many influencing factors. This chapter provides guidance on how to optimize the selection process. Section 4.1 provides a historical perspective of diagnostics and serves to provide information such that prior experience and recommendations of colleagues/fellow utilities can be used in the right context. Section 4.2 charts several paths such that a user may best benefit from the accumulated experience of utility practitioners. It addresses the selection of the optimal test location and gives a five step process for arriving at a short list of diagnostics to consider. The prime benefit of such a process is that the decision making is transparent and each part of the decision making process is preserved for future review. 4.1 Evolution of Cable System Diagnostics Research into the evolution started with a survey to establish the use of cable system diagnostics in North America was conducted in 2006 as part of CDFI Phase I and this provided one of the first industry wide estimates of diagnostic test deployment on electric utility systems. NEETRAC repeated the survey in 2014 using interviews with knowledgeable personnel. The work is now complete and results are reported for 103 utility entities in Canada and the US. Typically, the utilities contacted had more than 200,000 customers and information could be gathered for more than 70% of these utilities. Consequently, the sampling is believed to be representative of the utilities in the US and Canada. The information was captured at the utility operating company level so that regional variations and preferences could be captured. Furthermore, there can be much discussion over what constitutes “utility use”. In this work, to be considered a diagnostic used by a utility, the technique has to be part of a normal/established activity for determining cable system asset health on new and aged systems. Thus, pilot studies and laboratory experiments are not included. Some information is available for Mexico; however the usage could not be established to the same level as for entities in Canada and the US, thus data for Mexico are not included at this time. Each utility entity is considered on its own and given equal weighting, which addresses the fact that individual operating companies within a utility corporation (e.g. AEP, Exelon, FirstEnergy, PPL etc.) often have different approaches. This is very much in line with the manner in which diagnostic test usage was reported in the initial study of 2006. It is important to note in this approach that each respondent is considered equally (same weighting regardless of entity size). Viewed in this manner, over 73% of utilities surveyed report they do not employ cable system diagnostics. The most widely deployed technique reported to date is Simple VLF Withstand.
  • 5. Copyright © 2016, Georgia Tech Research Corporation Cable Diagnostic Focused Initiative (CDFI) Phase II, Released February 2016 4-5 The operating entity approach detailed above gives equal weighting to all entities independent of the size of the operating company. Another perspective may be gained if it were possible to consider the utility size. In principle, the optimal way to incorporate this would be to use the size of the underground MV system. However, this is known and knowable for only a very small fraction (5% – 10% of the sample) of the respondents. The main issue with the reduced number of respondents would be “confirmation bias” (i.e. the folks using diagnostics would be systematically more likely to provide the length information and thus bias the survey). Thus, it was determined that the information would be more useful if the large number of respondents was retained and some other means of size adjustment established. One approach is to use the number of customers served by a utility as an alias for the size of the underground system. It is recognized that this weighting is not entirely correct but it is reasonably pragmatic. Using this approach, each utility response was weighted by the reported number of customers that the utility serves. This perspective estimates that the use of diagnostics increases from 26.5% to 43.9% when adjusted for size. Figure 1: Range of Usage for the different diagnostic techniques - 2014 As mentioned, neither the entity approach or customer approach described above are likely to provide the “correct” usage; however, they most likely define the upper and lower ranges of the usage. Thus, it is possible to refine the estimated diagnostic usage with a process somewhat analogous to Bayesian Analysis which combines available estimates and engineering knowledge to provide a more accurate/complete estimate. Figure 1 shows the improved estimates by providing likely ranges for each diagnostic technique (drawn from the two different approaches) as well as the “no use” category. At this time, it is recommended that the midpoint of these ranges be used if a VLF Withstand Simple VLF TD VLF Monitored W ithstand TD PD AC & VLF None DC Withstand Simple 80 70 60 50 40 30 20 10 0 Technique Usage2014(%) 15 4.5 8 6 65 2
  • 6. Copyright © 2016, Georgia Tech Research Corporation Cable Diagnostic Focused Initiative (CDFI) Phase II, Released February 2016 4-6 single value is needed. The analysis completed thus far suggests that, for example, the VLF Simple Withstand usage lies somewhere between 10.8% and 18.7%, with 15% being a reasonable number to use if a range is not appropriate. Multiple voltage sources are available for use by those utilities that currently deploy diagnostics on their systems. These include using resonant ac (10 – 300 Hz), Very Low Frequency (VLF), damped ac (DAC), and dc. These sources may be used in one of two modes: diagnostic (Tan δ, PD, etc.) or withstand (Simple and Monitored). This analysis takes the same quasi-Bayesian approach described above to estimate the usage ranges. It is not possible to establish the most common testing mode as Withstand (HiPot) and Diagnostic modes overlap. The preceding information described the survey that was completed in 2014. Additionally, the basic information from the entity only analysis completed in 2006 can be applied to develop an estimate for 2006. This has been done using the same approaches outlined above to provide a side by side usage evolution of diagnostic techniques (see Figure 2 through Figure 5). In the figures below the following terms are used: TD = Tan Delta, PD = Partial Discharge, VLF = Very Low Frequency AC waveforms, AC = AC waveforms with frequencies in the range 10 to 300 Hz (usually derived from resonant systems), Withstand = Hipot, DAC = Damped AC or Oscillating Wave. At first sight this analysis may appear to be only from a historical interest. However, the changes reflect changes in equipment, improvements in application knowledge and standards activities that have been ongoing during the intervening eight years.
  • 7. Copyright © 2016, Georgia Tech Research Corporation Cable Diagnostic Focused Initiative (CDFI) Phase II, Released February 2016 4-7 2006 Figure 2: Range of Usage for the different diagnostic techniques – 2006 2014 Figure 3: Range of Usage for the different diagnostic techniques – 2014 VLF Withstand Simple VLF TD VLF Monitored W ithstand TD PD AC & VLF None DC Withstand Simple 80 70 60 50 40 30 20 10 0 Technique Usage2006(%) 13.05 3.552.8 5.85 72 2.7 VLF Withstand Simple VLF TD VLF Monitored W ithstand TD PD AC & VLF None DC Withstand Simple 80 70 60 50 40 30 20 10 0 Technique Usage2014(%) 15 4.5 8 6 65 2
  • 8. Copyright © 2016, Georgia Tech Research Corporation Cable Diagnostic Focused Initiative (CDFI) Phase II, Released February 2016 4-8 2006 Figure 4: Usage for diagnostic approaches (left) & voltage sources (right) – 2006 2014 Figure 5: Usage for diagnostic approaches (left) & voltage sources (right) – 2014 Inspection of the cable diagnostic testing technology usage above at MV enables the techniques to be grouped into two broad categories: Mainstream & Niche. VLFDCDAC10 - 300 HzHipotDiagnostic 35 30 25 20 15 10 5 0 Voltage Source Usage2006(%) 20 2.7 0 4.9 15.8 8 VLFDCDAC10 - 300HzHipotDiagnostic 35 30 25 20 15 10 5 0 Voltage Source Usage2014(%) 28 2 0 5 17 18
  • 9. Copyright © 2016, Georgia Tech Research Corporation Cable Diagnostic Focused Initiative (CDFI) Phase II, Released February 2016 4-9 a) Mainstream techniques i. Time- Domain Reflectometry (TDR); ii. Tan δ at Very Low Frequencies (VLF); iii. Simple Withstand Tests at Elevated Very Low Frequencies (VLF); iv. Simple Withstand Tests at Elevated Resonant ac – HV & EHV only; v. Monitored Withstand Tests at Elevated Very Low Frequencies (VLF) with simultaneous monitoring of Tan δ; vi. Monitored Withstand Tests at Elevated Resonant ac with simultaneous monitoring of PD – HV & EHV only; vii. Partial Discharge (PD) at elevated Resonant ac or Very Low Frequencies (VLF) Voltages. b) Niche techniques (not routinely deployed but where equipment maybe/has been commercially available); i. Partial Discharge (PD) at elevated Damped ac (DAC) Voltages; ii. Combined Diagnostic Tests at Very Low Frequencies (VLF) using sequential PD and Tan δ; iii. Dielectric Spectroscopy; iv. DC Leakage Current; v. Polarization and Depolarization Current; vi. Recovery Voltage. At the diagnostic technique level, evolutionary key takeaways are: Time-Domain Reflectometry (TDR)  Usage is difficult to determine.  The level of usage is estimated to be in the range of 6% -10% in 2014, which is up from the 5% - 8% level of 2006. VLF Tan δ  Since 2006 the greatest evolution is in the areas of VLF sources and Tan δ measurement / interpretation. In 2006 the devices were large, complicated to set up and difficult to transport - a trailer or van was required. In 2014 these devices are now portable (one man can move them) with complete integration of the VLF source and Tan δ measurement device in one box.  The level of usage has increased from 3.5% to 4.5%. However, this likely underestimates that activity as there are a number of users who, between 2006 & 2014, adopted Tan δ and then migrated to Monitored Withstand.  The guidance provided in the updated IEEE Std. 400.2 has very likely supported the change. Simple Withstand  The use of Simple dc Withstand has continued to decline with the conversion to Simple VLF Withstand. The rate of conversion would likely have been higher but it has been limited by the availability of funding for new VLF test units.  The growth of Simple VLF Withstand has continued (13.5% - 15%) both from adoption and transfer from dc.
  • 10. Copyright © 2016, Georgia Tech Research Corporation Cable Diagnostic Focused Initiative (CDFI) Phase II, Released February 2016 4-10 Monitored Withstand  The biggest growth over this period was in the area of the Monitored Withstand: 2.8% in 2006 to 8% in 2014.  The drivers of the growth have been two-fold: - Miniaturization / simplification / availability of the equipment - Guidance & familiarity stimulated by IEEE Std. 400 & IEEE Std. 400.2 Damped AC (DAC) Partial Discharge  This technique shows great promise for PD detection in the field by utilities; however, there are currently no users of this technique in the USA or Canada. Partial Discharge  The use of PD in the offline mode has been essentially static over the time period in the utility space VLF Simple Withstand  The estimates for 2014 show that VLF is the most preferred of the test voltages  The increase in usage since 2006 (20% - 28%) is notable and statistically significant Withstand (Hipot) vs Diagnostic  In 2006 Withstand (Hipot) was the most preferred mode of operation  In 2014 the use of withstand (Hipot) increased by 1.2%, while diagnostic tests have increased by 10%  In 2014 both withstand (Hipot) and diagnostic tests usage are equal In all the above comments it is important to recall that in this work, for a technique to be considered a utility diagnostic used by a utility, the technique has to be part of a normal / established activity for determining cable system asset health on new and aged cable systems. Thus pilot studies, industrial applications, commercial energy generation (wind farms etc.) and laboratory experiments are not included. Usage estimates that include these applications might be at variance with those provided here. 4.2 Choosing the Most Appropriate Diagnostic Program for an MV Cable System As noted in other chapters “there is no one right approach” to cable system diagnostic testing. Each situation/cable circuit/area/region/utility is likely to have conditions and priorities that will dictate an approach that is unique for that segment. This section offers a general perspective on how the information included in other chapters of this report can be used to select the most appropriate diagnostic for the circuit or set of circuits under consideration. The preceding section has shown how the usage of diagnostics has changed over the relatively short span of this project. Thus it is unwise to use the simple expedient approach of using previous experience / recommendations to guide the choice as the whole arena has changed so dramatically.
  • 11. Copyright © 2016, Georgia Tech Research Corporation Cable Diagnostic Focused Initiative (CDFI) Phase II, Released February 2016 4-11 At first sight, the diagnostic selection process would appear to be solely based on technical principles. However, experience gained from 10 years of conducting the CDFI research (from surveys of practitioners, internal discussions and working with more than 25 CDFI participants) shows that diagnostic testing decisions are very often based on a variety of perspectives, including asset management, reliability engineering, dielectric science as well as a very good dose of social science. The social science perspective can cause the most difficulty for engineers. However, it is a vital part of the diagnostic selection process because it requires engineers to consider topics that are qualitative in nature, such as,  risk tolerance;  interfaces with field personnel (including the operators and test crews before, during and after test);  likely outcomes from the test;  skill level required to perform the test;  decision making process during the test; and  decision making process after the test is performed. The comments and guidance included in this chapter encompass all of these elements and thus may be considered as a tabulated (rather than software based) expert system. Thus this chapter is primarily directed towards:  Personnel who are not familiar with diagnostic testing  Experienced personnel who are looking to test in new geographic areas and / or test cable systems they have not previously tested The approaches discussed are offered as only as suggestions and are based on what has worked for others unfamiliar with the topic. It is important to recognize that any approach should start from the needs of the program (essentially the social science) rather than first choosing a diagnostic technology and then trying to find a good location to use it. 4.2.1 Getting Started To begin, it is important to remember the following: 1) Treat the cable circuits as a system – not simply a cable or a cable accessory. It is not possible to perform a diagnostic test on just a segment of cable or just an accessory. All cable circuits consist of both elements so the circuit it must be treated as a system. 2) Gather as much information as possible about the cable system including its age, accessory types, cable design, insulation type and the failure history 3) Establish why diagnostic tests should be performed on your cable system. 4) Establish the potential diagnostic technologies are available for performing the evaluation and what it takes to deploy each technology (skills required, switching by field crews, etc.). 5) Establish your options for corrective actions (run to failure, repair, rejuvenate, replace).
  • 12. Copyright © 2016, Georgia Tech Research Corporation Cable Diagnostic Focused Initiative (CDFI) Phase II, Released February 2016 4-12 So ‘why perform diagnostic tests on a cable system’? Interestingly, the reasons are quite varied. Outlining the reason(s) does not directly dictate the specific diagnostic test approach to take. However, a clear understanding of why you are performing diagnostic tests on your cable system will help guide the decisions that need to be made once diagnostic data is obtained. There are a number of drivers/motives for performing diagnostic tests on cable systems, including a need to: 1. Help assure that a new system was properly installed 2. Help assure that an existing system was effectively repaired 3. Improve cable system reliability (reduce failures) 4. Prevent failures before they occur 5. Optimize the use of maintenance dollars 6. Optimize the use of capitol (cable replacement) dollars 7. Follow a management directive to use a specific diagnostic technology 4.2.2 The Process - SAGE The NEETRAC research has led to the development of the acronym SAGE to describe the four basic phases of an effective diagnostic program. SAGE was first developed in CDFI Phase I and has been refined in Phase II. These elements are described as follows: Selection: This phase encompasses two actions: a) choose the cable circuits to be tested; and b) determine the constraints for the testing Taken together, these actions lead to the selection of the most appropriate diagnostic technology to use for the evaluation. Action: This phase involves answering the question: What actions are likely to be taken as the result of the diagnostic outcomes (results) or interpretations? The actions are in two groups (Act or Not Act) and may include replacement, defer action, rejuvenation, and/or repair. These actions are chosen based on what is most suitable for the cable system topology and most prevalent failure mechanisms (local or global degradation). Generation: This phase has been expanded to include two sequential parts: a) Generating the test data b) Using the measured data (singly or in combinations) to determine a final result which may involve placing the cable system segments or circuits into an act or not act class or to establish a health index. Ultimately these two parts help to establish the preferred remediation (Action).
  • 13. Copyright © 2016, Georgia Tech Research Corporation Cable Diagnostic Focused Initiative (CDFI) Phase II, Released February 2016 4-13 Evaluation: This phase provides answers to the questions: Are the methods employed for Selection, Action, and Generation giving the expected results - lower rates of failure and increased times between failures? Can the diagnostic elements be improved? Figure 6 illustrates how the four components function together over time to produce, if implemented properly, a reduction in the failure rate. Note that this benefit is not realized immediately nor does it cease once the program has ended - there is a lag before the benefit is fully realized. Furthermore, failure rates do not begin to change until the actions directed by the diagnostic testing (Generation) are well underway. Selection, Generation, and Action are each defined stages in time while the Evaluation component is ongoing throughout the entire test program and beyond. Figure 6: Effect of SAGE on the Failure Rate of a Target Population Note: the failure rate in Figure 6 continues to increase during the Selection and Generation phases. Only after the actions are completed does the failure rate start to decrease. After some time, the failure rate will begin to increase again and this would retrigger the SAGE process. Each phase of the SAGE process is discussed in more detail in the following sections of this chapter. 4.2.2.1 Selection The selection phase represents the first stage of the SAGE process. This process should be performed before a diagnostic technology is chosen. Elements of the selection process that help the user decide which circuits to test are outlined as follows: Choosing the cable circuits to be tested The utility should use all available data / knowledge to identify those circuits that may be susceptible to failure within a chosen time horizon, generally 5-10 years. These circuits may be in
  • 14. Copyright © 2016, Georgia Tech Research Corporation Cable Diagnostic Focused Initiative (CDFI) Phase II, Released February 2016 4-14 areas that have historically experienced higher than usual failure rates or may simply be of critical importance to system operation or a combination of both. Regardless of the criteria used, the size and composition of this population greatly affects potential reliability improvements and economic savings resulting from the program. These circuits constitute the “target population” that will be tested and acted on using one or more diagnostic tests. Important considerations for the Selection process are: System Construction  How are the circuits used in the system?  Is the system a radial, looped or network system?  What level of redundancy is present?  Can circuits be easily isolated without impacting customers?  What is the cable design?  voltage class  insulation thickness  insulation material (Polyethylene, EPR, fluid impregnated paper)  metallic shield type (tape, LCT, wires)  jacket (yes or no) Available Historical Data  Number of circuits of the same type in service  their ages  their failure histories  If data are not available then simple heuristics may suffice – see Table 1. Failure Projections  How fast are failure rates increasing?  If there are cable or accessory designs in use, in which are the failure rates increasing fastest? Prevalent Failure Mechanism  What causes the most failures?  What is the failure the mechanism?  electrical (electrical or water trees)  mechanical (damage)  environmental (neutral corrosion)  inherent (manufacturing imperfections)  thermal in nature (overheating connectors)? Objective  Is the objective to:  improve reliability?  reduce maintenance costs?  garner knowledge of system health before determining action to take?  a combination of all three?
  • 15. Copyright © 2016, Georgia Tech Research Corporation Cable Diagnostic Focused Initiative (CDFI) Phase II, Released February 2016 4-15  Has a budget been allocated to achieve the objective? The above information is invaluable in determining which circuits to test. However, the relative importance of a circuit(s) is also essential since they will often supply important customers where an outage would result in notable economic or newsworthy consequence for the utility. Determine the testing constraints It is very important to establish in advance what you can and cannot do or accept during a diagnostic test program. A list of things to consider is outlined below. Acceptability of Failure During Testing  How much risk of failure can be tolerated?  Is a failure tolerable during testing if circuits are subjected to elevated test voltages? This is important because in many cases once a cable segment fails, testing in that area is curtailed until a repair can be affected. This will noticeably impact the throughput/efficiency of the test program. Tolerance of Uncertainty  How accommodating is the organization of uncertainty? Does your organization insist that answers be black or white or is it accepting of shades of grey? Performing Tests and Interpreting Results  Will testing be performed by internal resources or subcontractor resources?  Who will interpret the test results?  Is the test interpretation processed internally or externally or by a subcontractor?  Is the subcontractor part of the remediation process and therefore subject to bias when making the interpretation? Acceptance of Complexity and Transparency  Is it institutionally acceptable to have a complex process for interpreting the results or is a simple answer required?  Does your company accept an answer without knowing how the data is processed (opaque process), or does your company want to know, or be able to know at some future date, exactly how the test results are used to make recommendations (transparency) Note that as the information content of a diagnostic technique increases, so does the complexity. Nimbleness of Decision Making - as the information content of a diagnostic technique increases so does the need for real time decision making Is it institutionally appropriate for decisions to be devolved to test crews or a subcontractor; both of these are often stakeholders in the remediation process Cost of the Diagnostic  Does the estimated cost (cost per circuit = cost per day / throughput) of the diagnostic represent a large portion of the replacement cost of the component?
  • 16. Copyright © 2016, Georgia Tech Research Corporation Cable Diagnostic Focused Initiative (CDFI) Phase II, Released February 2016 4-16 Resolution of the Diagnostic  Does the diagnostic provide enough information to classify the components into the desired number of subpopulations? The two part process above (choosing the circuits and establishing the constraints) results in very good context information but is difficult to make actionable. The following example (Table 1) illustrates how a company could collate this information as a means of classifying the circuits they may want to test. The example area contains 14 circuits, which are classified by a two dimensional selection matrix which balances failure rate against the impact of service failures. Table 1: Example Selection Matrix - Qualitative – Residential Customers FAILURE RATE More than Twice Average Failure Rate 2 circuits Between Average and Twice Average Failure Rate 2 circuits 2 circuits Less than Average Failure Rate 3 circuits 2 circuits 3 circuits Failure in Service has a Low Impact Failure in Service has a Medium Impact Failure in Service has a High Impact IMPACT OF FAILURE Numeric information (number of circuits) is preferred to describe the cells. However, this information may not be available. When that occurs, the cost of an outage could potentially be used as an alias for the impact of service failures. The example in Table 2 is similar to Table 1, but the data used is based upon the economic cost of a failure ($ pa) using the established DOE model discussed in Chapter 14. In this table, the cost of an outage (failure) for the circuit(s) represented in the cell is shown in bold. It is a function of the number of customers on the circuit(s) along with the impact cost of an outage per 1000 customers. The cost of a failure per 1000 customer is a function of the SAIFI and SAIDI rates for the circuits in question. Table 2: Example Selection Matrix – Semi Quantitative – Residential Customers FAILURE RATE 140% Average SAIFI (High SAIFI) $600 100 customers $6k/1000 customers $0 0 $8k/1000 customers $0 0 $10k/1000 customers Average SAIFI $0 0 $4k/1000 customers $1200 200 customers $6k/1000 customers $1800 200 customers $9k/1000 customers 60% Average SAIFI (Low SAIFI) $900 300 customers $3k/1000 customers $1000 200 customers $5k/1000 customers $2100 300 customers $7k/1000 customers 50% Average SAIDI Average SAIDI 160% Average SAIDI IMPACT OF A FAILURE
  • 17. Copyright © 2016, Georgia Tech Research Corporation Cable Diagnostic Focused Initiative (CDFI) Phase II, Released February 2016 4-17 Ultimately, some decision making overlay is required. Work in the CDFI has shown that that a new user of diagnostics should approach testing somewhat differently than an experienced user. The differences are shown in Table 3 and Table 4. One of the most significant errors that new users make is that they immediately attempt to test in the upper right hand area, where their experience level is not sufficient to deal with the multitude of issues associated with an area that has a large number of problems. A much more effective strategy is to start testing in either of the green areas and then move to the green areas of Table 4 as experience increases. Table 3: Interpretation of the Selection for a New User of Diagnostics FAILURE RATE More than Twice Average Failure Rate Useful for gaining experience, but benefits are likely low Not optimal for a new user - too many issues to handle/consider Between Average and Twice Average Failure Rate Useful for learning, with increasing benefits but also increasing risks Less than Average Failure Rate Not optimal – likely low benefit Failure in Service has a Low Impact Failure in Service has a Medium Impact Failure in Service has a High Impact IMPACT OF FAILURE Table 4: Interpretation of the Selection for an Experienced User of Diagnostics FAILURE RATE More than Twice Average Failure Rate Not Optimal – likely low benefit Optimal – maximum benefits (with maximum risks) Between Average and Twice Average Failure Rate Optimal - increasing benefits / risks Less than Average Failure Rate Not Optimal – likely low benefit Failure in Service has a Low Impact Failure in Service has a Medium Impact Failure in Service has a High Impact IMPACT OF FAILURE 4.2.2.2 Action The Action stage of the SAGE process refers to the establishment of possible repair and replacement actions based on the results from the diagnostic test. Ideally, a specific action can be established for each circuit tested based on the condition indicated from the diagnostic test. The goal is to perform the minimum level of actions that will restore the circuit to reliable operation for the next several years.
  • 18. Copyright © 2016, Georgia Tech Research Corporation Cable Diagnostic Focused Initiative (CDFI) Phase II, Released February 2016 4-18 Each action has an associated cost and level of reliability improvement that it will deliver. For example, the cost of replacing a bad splice in a 500 ft segment is very different from the cost of replacing the entire segment. On the other hand, the reliability of the repaired segment is not likely to be as high as the reliability of the replaced segment. An economic analysis can be used to quantify the value for one action compared to another. When considering cable systems, the list of available actions is relatively short and includes: a) Wholesale Replacement – complete replacement of the entire target population; b) Targeted Replacement – replace only the segments that the diagnostic test indicates are degraded; c) Repair – remove short length(s) of cable and replace with two joints and a piece of cable or replace problematic accessories; d) Rejuvenation – liquid injection (PE-based insulations); and e) Do Nothing. The choice of actions will affect the choice of diagnostic technique(s) since some diagnostics are unable to locate specific points of degradation within a given segment. Furthermore, the composition of the target population might limit the actions a utility is able to take. Once a suitable approach for each diagnosis exists, tests may be performed on the target population to generate the diagnostic data. This constitutes the next phase of the process – the Generation phase. 4.2.2.3 Generation The generation stage of the SAGE process starts with the choice of a suitable diagnostic followed by testing on the target population of circuits. By definition, the diagnostic techniques measure specific characteristics of the circuit thought to be symptomatic of known failure mechanisms. Generation has two sequential parts: a) generating the test data; and b) using the measured data (singly or in combinations) to determine a final result (Action Class or a Health Index). The different diagnostic technologies available for generating test data are discussed in Section 4.3. However, at this point it is useful to consider some examples. The first example is for cable diagnostic tests made using Tan  (dielectric loss measurements). The actual measured values are:  sequences (usually 6) of Tan  data at 0.5Uo;  sequences (usually 6) of Tan  data at 1.0 Uo; and  sequences (usually 6) of Tan  data at 1.5Uo. These measurements permit, derived parameters to be calculated:
  • 19. Copyright © 2016, Georgia Tech Research Corporation Cable Diagnostic Focused Initiative (CDFI) Phase II, Released February 2016 4-19  Tip Up;  Tip Up of the Tip Up (Tu Tu);  Standard deviation of Tan  at 1.0Uo; and  Mean Tan  at 1.0 Uo. The derived parameters enable, one of two determinations can be made: a) The tested cable segment can be placed in one of the three classifications: i. action required (AR); ii. further study (FS); or iii. no action required (NA). OR b) A Health Index can be calculated used to indicate where the tested cable segment lies along the spectrum of cable segments tested to date i.e. this segment is the xth percentile of all similar cable systems tested to date. The second example is for cable diagnostic tests made using Damped ac (DAC) partial discharge measurements. In this case the actual measurements indicate one of the following and are qualitatively/subjectively used to determine whether or not the tested cable segment falls into the action required, further study or no action required category:  discharge present above the background noise below 1U0 at location X;  discharge present above the noise in range of U0 to 1.4U0 at location X; or  discharge present above the noise above 1.4U0 at location X. Although numerical values may be ascribed to this type of measurement, there is no adequate or definitive method of interpreting the different numbers such that the tested cable circuit may be placed into a specific condition category. This means that partial discharge measurements made on similar cable circuits cannot be compared and partial discharge measurements made using different technologies cannot be compared. 4.2.2.4 Evaluation The final stage of the SAGE process is the evaluation stage. This is the stage where utility engineers ask themselves: Are we getting what we expected? This question covers many issues, but can be summarized in two key topics: (1) Cost and (2) Reliability. A diagnostic program must deliver improved reliability at a lower cost as compared to other maintenance strategies to be considered effective. Evaluation tools, such as those presented in Appendix A can be used to assess the impact the program has made on system reliability. Furthermore, the utility can then adjust in real time to improve program performance. The evaluation phase represents an ongoing process that remains in place until the need again arises to conduct another diagnostic program. Commissioning diagnostics are used shortly after a system is installed or after a repair. When diagnostics are used for this purpose, the health (classification) of the system is not of primary interest. The engineer simply wants to know if there are any significant defects caused by installation workmanship. Generally, most new components are factory-tested (recognize that the
  • 20. Copyright © 2016, Georgia Tech Research Corporation Cable Diagnostic Focused Initiative (CDFI) Phase II, Released February 2016 4-20 standards and implementations may be quite different from component type to component type) so there is an expectation that there are no built-in defects. Thus the goal of performing the diagnostic test is to help ensure that the system is free from gross defects. Importantly, the test technology and test conditions selected for commissioning tests are generally not designed for aged systems and should not be applied to aged systems. However, when new components or cable segments are installed on an aged system, modifications to the test program may be required. Condition assessment diagnostics are applied to aged cable systems. This is much more of a process approach rather than spot check assessment using a pass/fail criterion. Consequently, it is important to focus on classification and avoid doing harm (further weakening) to the system. 4.2.3 Information on the Diagnostic Techniques Utility engineers have voiced a desire for guidance on the experience levels necessary for conducting diagnostic tests and interpreting test results (the Generation phase of SAGE). Table 5 provides basic information garnered from the research activities on available diagnostic techniques, their expected output and who is involved.
  • 21. Copyright © 2016, Georgia Tech Research Corporation Cable Diagnostic Focused Initiative (CDFI) Phase II, Released February 2016 4-21 Table 5: Typical Diagnostic Technique Deployment Technique Testing performed by Interpretation of Raw Data Form of Output to end user Condition Assessment performed by Time Domain Reflectometry (TDR) Utility or Provider Technician Utility or Provider Technician or Engineer TDR Trace Utility or Provider by comparison with library of curves Offline Partial Discharge Resonant ac Provider Engineer Provider Engineer Report with classification data 1 Provider using Proprietary Criteria 4 Offline Partial Discharge VLF Provider or Utility Technician or Engineer Utility or Provider Engineer Data or Report with numeric data 2 Provider or Utility using Knowledge Rules 5 Offline Partial Discharge DAC Utility or Provider Technician Utility or Provider using Knowledge Rules 5 Online Partial Discharge Provider Technician or Engineer Provider Engineer Report with classification data 1 Provider using Proprietary Criteria 4 Tan δ (VLF) Utility Technician Utility Technician or Engineer Numeric data 2 Utility using Knowledge Rules from IEEE Std. 400.2™ or CDFI Tools Withstand AC Resonant Utility Technician Utility Technician or Engineer Survival data 3 (Pass / Fail)VLF Monitored Withstand PD Provider or Utility Provider or Utility Engineer Survival data 3 (Pass / Fail) & numeric data 2 Utility using Knowledge Rules from CDFI Tools Tan δ Utility Technician Utility Technician or Engineer 1 Classification Data – results are described in terms of the membership of a number of classes ranging from good to poor performance (A, B, C; Repair, Replace, etc.); no information is conveyed about the relative position within a class (it is not possible to prioritize within a class); class membership can be determined by either Proprietary Criteria or Knowledge Rules. 2 Numeric Data – results are described in terms of a continuous variable (inception voltage, loss, count etc). 3 Survival Data – two classes: Pass / Not Pass; no information is conveyed about the margin within a class. 4 Proprietary Criteria – the membership in a class (see footnote 1 above) is determined by multiple criteria for the measured and system data which are not open to scrutiny; the receiver of the classification data (see footnote 1 above) is unable to reassess the class membership as they do not (generally) have access to the measured data or the criteria; the receiver of the data has no means to verify whether the criteria have changed (improved of degraded). 5 Knowledge Rules – the membership in a class (see footnote 1 above) is determined by multiple criteria for the measured and system data which are open to scrutiny; the receiver of the classification data (see footnote 1 above) is able to reassess the class membership as they have
  • 22. Copyright © 2016, Georgia Tech Research Corporation Cable Diagnostic Focused Initiative (CDFI) Phase II, Released February 2016 4-22 access to the measured data and the criteria; the receiver of the data has a means to verify that the criteria have remained unchanged over time. As discussed earlier, the assessment provided by diagnostic testing technologies generally falls into two location categories: global and local. Table 6 describes which diagnostic tests are most commonly used for global and local assessments. Table 6: Local vs. Global Assessments for Diagnostic Techniques Technique Identifies Local Defects Identifies Global Degradation Time Domain Reflectometry (TDR) X Offline Partial Discharge (AC Resonant) X Offline Partial Discharge (VLF) X Offline Partial Discharge (DAC) X Online Partial Discharge X * Tan δ (VLF) X Withstand AC Resonant X** VLF X** DC (PILC Only) X** Monitored Withstand AC Resonant PD X VLF PD X Tan δ X** X * While traditional PD measurements focus on local defects, online providers sometimes provide an assessment that is related to global condition assessment. ** The location is determined by TDR when dielectric puncture occurs 4.2.4 Choosing the most appropriate diagnostics - Selection 4.2.4.1 Basic Approach In principle, the issues outlined in Section 4.2.1, Table 1 through Table 6 with the detailed information in the diagnostic specific chapters provide sufficient information to select the most appropriate diagnostic. However, those with little or no diagnostic testing experience may find the information provided below to be a more convenient way to start the selection process. The approach uses five questions help to identify options to consider: 1. Who do you anticipate will perform the tests? 2. How would you best describe your tolerance to dielectric failures on test (FOT)? 3. How would you best describe the majority of cable circuits in the portion of the system under consideration? 4. How would you describe the age of the cable system?
  • 23. Copyright © 2016, Georgia Tech Research Corporation Cable Diagnostic Focused Initiative (CDFI) Phase II, Released February 2016 4-23 5. Do you know what is failing? Questions 1 and 2 are used in Table 7 to select the appropriate table with which to consider the outputs from Questions 3 to 5. The diagnostic suggestions take into account both the reliability engineering (electrical engineering and dielectric science) and social science elements of the decision making process. Some of the main rule of thumb/experience/heuristic based approaches are provided below: Time-Domain Reflectometry (TDR)  This test should be utilized on all but the most complicated / long circuits to obtain at a minimum the length of the cable system.  It provides useful information on the number of joints in a cable circuit.  It can be difficult to interpret when multiple joints are present.  It does not provide quantitative data on the condition of the cable neutral. VLF Tan δ  Test protocols are well defined and exist in approved industry standard (IEEE 400.xx).  Assessment tools are available for interpreting the data into “No Action Required”, “Further Study”, and “Action Required” classes for all insulation types.  A Health Index can be determined.  Is often conducted and interpreted by utility personnel. Simple Withstand Voltage  Test protocols exist (AC Resonant & VLF) and are described in approved industry standards (IEEE 400.xx).  AC Resonant, DC & VLF voltages meet the criteria for Withstand Tests.  VLF withstand tests are useful for evaluating hybrid cable systems.  This is the most straightforward diagnostic test to interpret and perform.  This test is almost always conducted by utility personnel. Monitored Withstand Voltage  Test protocols are available (AC Resonant & VLF) and are described in an approved industry standard (IEEE 400.xx).  Assessment tools are available, for VLF Tan , to make decisions in real time while the test is being performed, significantly increasing test program efficiency.  Can be conducted and interpreted by utility personnel. Partial Discharge (Damped AC (DAC))  Technique is promising; however, there are no users of this technique in USA or Canada.  May be conducted and interpreted by utility personnel. Partial Discharge (AC Resonant & VLF)  There is limited agreement in the industry on condition assessment if PD is present.  No industry standard is available for interpreting PD measurements in the field.
  • 24. Copyright © 2016, Georgia Tech Research Corporation Cable Diagnostic Focused Initiative (CDFI) Phase II, Released February 2016 4-24  This is the most difficult diagnostic to employ in the field.  This technique remains too complicated for most utilities to conduct and interpret on their own, although recent automation efforts are improving usability. It is important to recall that all the tables in this chapter should be useful for an experienced user but are designed for:  People first embarking on diagnostic testing; and  People who have performed some diagnostic testing but are considering moving to a different location / cable type / mode of operation. 4.2.4.2 Specific Guidance Questions 1 and 2 (above) are used in Table 7 to select the appropriate table with which to consider the outputs from Questions 3 to 5. Table 7 summarizes the research findings and provides specific diagnostic technique suggestions based on a user’s tolerance for failures on test (FOTs) and who is anticipated to conduct the test. Table 7: Initial Diagnostic Screening Matrix How would you best describe your tolerance to dielectric Failures on Test (FOT) Who do you anticipate to undertake the tests? Utility Personnel Sub-Contractor Acceptable to avoid Failures in Service (FIS) See Table 8 See Table 9 Should be Minimized but Acceptable to avoid Failures in Service (FIS) See Table 10 See Not Acceptable (Very Few) even to avoid Failures in Service (FIS) See Table 12 See Table 13 Table 8 through Table 13 use the research results to suggest reasonable tests to consider based on what is known about the cable circuits under consideration from Table 7. If the text is in light blue, the indicated test(s) might be undertaken but have a low likelihood of rendering useful information.
  • 25. Copyright © 2016, Georgia Tech Research Corporation Cable Diagnostic Focused Initiative (CDFI) Phase II, Released February 2016 4-25 Table 8: Acceptable Risk of Failures on Test (FOT), Test by Utility Personnel How would you describe the age of the cable system? Howwouldyoubestdescribethemajorityofcablesinthecable system New Old Extruded TDR – Chapter 5 & 11 And Simple VLF Withstand – Chapter 9 Don’t know what is failing TDR – Chapter 5 & 11 And Simple VLF Withstand – Chapter 9 TDR – Chapter 5 & 11 And Monitored VLF Withstand – Chapter 10 TDR – Chapter 5 & 11 And VLF Tan Delta – Chapter 5 I think that accessories are failing TDR – Chapter 5 & 11 And Simple VLF Withstand – Chapter 9 TDR – Chapter 5 & 11 And Monitored VLF Withstand – Chapter 10 Hybrid Simple VLF Withstand – Chapter 9 Don’t know what is failing Simple VLF Withstand – Chapter 9 I think that accessories are failing Simple VLF Withstand – Chapter 9 Paper Simple VLF Withstand – Chapter 9, if possible consider TDR – Chapter 4 & 11 Don’t know what is failing Simple VLF Withstand – Chapter 9, if possible consider TDR – Chapter 5 & 11 Simple DC Withstand – Chapter 9 I think that accessories are failing TDR – Chapter 4 & 11 And Simple VLF Withstand – Chapter 9
  • 26. Copyright © 2016, Georgia Tech Research Corporation Cable Diagnostic Focused Initiative (CDFI) Phase II, Released February 2016 4-26 Table 9: Acceptable Risk of Failures on Test (FOT), Test by Sub-Contractors How would you describe the age of the cable system? Howwouldyoubestdescribethemajorityofcablesinthecable system New Old Extruded TDR – Chapter 5 & 11 And Simple VLF Withstand – Chapter 9 Don’t know what is failing TDR – Chapter 5 & 11 And Monitored VLF Withstand – Chapter 10 TDR – Chapter 5 & 11 And VLF Tan Delta – Chapter 5 TDR – Chapter 5 & 11 And Simple VLF Withstand – Chapter 9 I think that accessories are failing TDR – Chapter 5 & 11 And Monitored VLF Withstand – Chapter 10 TDR – Chapter 5 & 11 And Simple VLF Withstand – Chapter 9 Hybrid Simple VLF Withstand – Chapter 9 Don’t know what is failing Simple VLF Withstand – Chapter 9 I think that accessories are failing Simple VLF Withstand – Chapter 9 Paper Simple VLF Withstand – Chapter 9, And TDR – Chapter 4 & 11 Don’t know what is failing Simple VLF Withstand – Chapter 9, And TDR – Chapter 5 & 11 Simple DC Withstand – Chapter 9 I think that accessories are failing TDR – Chapter 4 & 11 And Simple VLF Withstand – Chapter 9 If the text is in light blue, the indicated test(s) might be undertaken but have a low likelihood of rendering useful information.
  • 27. Copyright © 2016, Georgia Tech Research Corporation Cable Diagnostic Focused Initiative (CDFI) Phase II, Released February 2016 4-27 Table 10: Minimal Risk of Failures on Test (FOT), Test by Utility Personnel How would you describe the age of the cable system? Howwouldyoubestdescribethemajorityofcablesin thecablesystem New Old Extruded TDR – Chapter 5 & 11 And Simple VLF Withstand – Chapter 9 Don’t know what is failing TDR – Chapter 5 & 11 And Monitored VLF Withstand – Chapter 10 TDR – Chapter 5 & 11 And VLF Tan Delta – Chapter 5 I think that accessories are failing TDR – Chapter 5 & 11 And Monitored VLF Withstand – Chapter 10 Hybrid Simple VLF Withstand – Chapter 9 Don’t know what is failing Simple VLF Withstand – Chapter 9 I think that accessories are failing Simple VLF Withstand – Chapter 9 Paper Simple VLF Withstand – Chapter 9, if possible consider TDR – Chapter 4 & 11 Don’t know what is failing Simple VLF Withstand – Chapter 9, if possible consider TDR – Chapter 5 & 11 Simple DC Withstand – Chapter 9 I think that accessories are failing TDR – Chapter 4 & 11 And Simple VLF Withstand – Chapter 9
  • 28. Copyright © 2016, Georgia Tech Research Corporation Cable Diagnostic Focused Initiative (CDFI) Phase II, Released February 2016 4-28 Table 11: Minimal Risk of Failures on Test (FOT), Test by Sub Contractors How would you describe the age of the cable system? Howwouldyoubestdescribethemajorityofcablesinthecablesystem New Old Extruded TDR – Chapter 5 & 11 And Simple VLF Withstand – Chapter 9 Don’t know what is failing TDR – Chapter 5 & 11 And Monitored VLF Withstand – Chapter 10 TDR – Chapter 5 & 11 And Offline PD – Chapter 7 or 8 TDR – Chapter 5 & 11 And VLF Tan Delta – Chapter 5 I think that accessories are failing TDR – Chapter 5 & 11 And Monitored VLF Withstand – Chapter 10 TDR – Chapter 5 & 11 And Offline PD – Chapter 7 or 8 Hybrid Simple VLF Withstand – Chapter 9 Don’t know what is failing Monitored VLF Withstand – Chapter 10 Simple VLF Withstand – Chapter 9 I think that accessories are failing Simple VLF Withstand – Chapter 9 Paper Simple VLF Withstand – Chapter 9, And TDR – Chapter 4 & 11 Don’t know what is failing Simple VLF Withstand – Chapter 9, And TDR – Chapter 5 & 11 Simple DC Withstand – Chapter 9 I think that accessories are failing TDR – Chapter 4 & 11 And Simple VLF Withstand – Chapter 9 TDR – Chapter 4 & 11 And Online PD – Chapter 7 or 8 If the text is in light blue, the indicated test(s) might be undertaken but have a low likelihood of rendering useful information.
  • 29. Copyright © 2016, Georgia Tech Research Corporation Cable Diagnostic Focused Initiative (CDFI) Phase II, Released February 2016 4-29 Table 12: Failures on Test (FOT) Not Acceptable, Test by Utility Personnel How would you describe the age of the cable system Howwouldyoubestdescribethemajorityofcablesin thecablesystem New Old Extruded TDR – Chapter 5 & 11 Don’t know what is failing TDR – Chapter 5 & 11 And VLF Tan Delta – Chapter 5 I think that accessories are failing TDR – Chapter 5 & 11 And VLF Tan Delta – Chapter 5 Hybrid Nothing Available Don’t know what is failing Nothing Available I think that accessories are failing Nothing Available Paper Nothing Available Don’t know what is failing Nothing Available Nothing Available I think that accessories are failing TDR – Chapter 5 & 11 If the text is in light blue, the indicated test(s) might be undertaken but have a low likelihood of rendering useful information.
  • 30. Copyright © 2016, Georgia Tech Research Corporation Cable Diagnostic Focused Initiative (CDFI) Phase II, Released February 2016 4-30 Table 13: Failures on Test (FOT) Not Acceptable, Test by Sub Contractors How would you describe the age of the cable system Howwouldyoubestdescribethemajorityofcablesinthecable system New Old Extruded TDR – Chapter 5 & 11 And Offline DAC PD – Chapter 7 & 8 Don’t know what is failing TDR – Chapter 5 & 11 And VLF Tan Delta – Chapter 5 TDR – Chapter 5 & 11 And Offline DAC PD – Chapter 7 & 8 I think that accessories are failing TDR – Chapter 5 & 11 And VLF Tan Delta – Chapter 5 TDR – Chapter 5 & 11 And Offline DAC PD – Chapter 7 & 8 Online PD – Chapter 7 Hybrid TDR – Chapter 5 & 11 And Offline DAC PD – Chapter 7 & 8 Don’t know what is failing Nothing Available I think that accessories are failing Online PD – Chapter 7 Paper TDR – Chapter 5 & 11 And Offline DAC PD – Chapter 7 & 8 Don’t know what is failing VLF Tan Delta – Chapter 5 Online PD – Chapter 7 Offline DAC PD – Chapter 7 Online PD – Chapter 7 I think that accessories are failing Online PD – Chapter 7 Offline DAC PD – Chapter 7 If the text is in light blue, the indicated test(s) might be undertaken but have a low likelihood of rendering useful information.
  • 31. Copyright © 2016, Georgia Tech Research Corporation Cable Diagnostic Focused Initiative (CDFI) Phase II, Released February 2016 4-31 The Decision Tables (Table 8 - Table 13) above can be quite intimidating as they display the plethora of options and the potential solutions revealed by this research. In an effort to make them more understandable, two Case Studies are presented to demonstrate their use. Case 1: Assume that you are a new user, the failure rate is 150% of average and failures in service have a high impact. Table 3 shows that we know that diagnostic testing is a reasonable thing to do (Useful for learning, with increasing benefits but also increasing risks). Now we need to answer additional questions (see section 4.4.1): 1. Who is the service provider? Diagnostic testing would be performed by a sub-contractor. 2. What is the acceptability of Failures on Test (FOT)? Failures on test are acceptable but should be minimized. 3. What is the cable type? Majority of the cables on the system are extruded 4. What is the cable age? Old 5. What is failing? Accessories With this information, Table 7 tells us that we should go to Table 11. Table 11 indicates to us that the following diagnostic test technologies are recommended and directs us to the specific chapter for further guidance: 1. TDR – Chapter 5 & 11 2. Monitored VLF Withstand – Chapter 10 3. Offline PD – Chapter 7 or 8 Case 2: Now assume that you are a new user, the failure rate is 250% of average and failures in service have a low impact. Table 3 shows that we know that diagnostic testing should be very beneficial (Optimal – maximum benefits with maximum risks). Now we need to answer additional questions: 1. Who is the service provider? Diagnostic testing would be performed by a utility crew. 2. What is the acceptability of Failures on Test (FOT)? Failures on test are acceptable. 3. What is the cable type? Hybrid (mixture) 4. What is the cable age? Old 5. What is failing? Don’t know With this information, Table 7 tells us that we should go to Table 8. Table 8 indicates to us that the following diagnostic test technologies are recommended and directs us to the specific chapter for further guidance: 1. Simple VLF
  • 32. Copyright © 2016, Georgia Tech Research Corporation Cable Diagnostic Focused Initiative (CDFI) Phase II, Released February 2016 4-32 A blank assessment template is provided below as a convenient method for recording the circumstances for your situation and the answers to the five questions. FAILURE RATE More than Twice Average Failure Rate Between Average and Twice Average Failure Rate Less than Average Failure Rate Failure in Service has a Low Impact Failure in Service has a Medium Impact Failure in Service has a High Impact IMPACT OF FAILURE Describe Area chosen for Testing: Relevant History of Cable System 1. Who do you anticipate to undertake the tests? 2. How would you best describe your tolerance to dielectric Failures On Test (FOT)? Table 7 indicates Table 3. How would you best describe the majority of cables in the cable system? 4. How would you describe the age of the cable system? 5. In your Old Cable System - Do you know what is failing Consider the following Diagnostics (Taken from relevant Table (Table 8 to Table 13)
  • 33. Copyright © 2016, Georgia Tech Research Corporation Cable Diagnostic Focused Initiative (CDFI) Phase II, Released February 2016 4-33 4.3 Summary The complexity of cable system diagnostic testing can be daunting for those unfamiliar with the process. The research information in this chapter is intended help by condensing a plethora of information on diagnostic testing into a series of easy to follow steps or processes. The discussion is designed to help potential cable diagnostic technology users a way to focus on the relevant issues. It does this by providing an overview of how to approach diagnostic testing with a quick review of available technologies and how they might reasonably be deployed under a given set of circumstances. It is important to reinforce the fact that these are general guidelines. Someone with an advanced knowledge of diagnostic testing may choose to take a different approach and still achieve positive outcomes. However the intent is to point unfamiliar users in the right direction such that they can avoid costly mistakes and maximize the potential value of performing a cable system diagnostic test program.