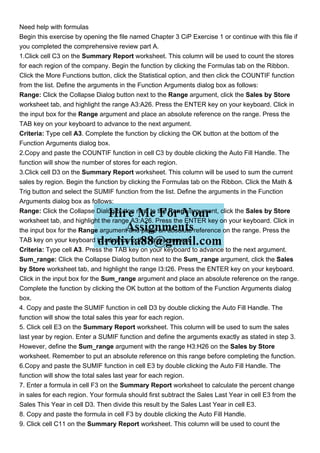
Need help with formulas
Begin this exercise by opening the file named Chapter 3 CiP Exercise 1 or continue with this file if
you completed the comprehensive review part A.
1.Click cell C3 on the Summary Report worksheet. This column will be used to count the stores
for each region of the company. Begin the function by clicking the Formulas tab on the Ribbon.
Click the More Functions button, click the Statistical option, and then click the COUNTIF function
from the list. Define the arguments in the Function Arguments dialog box as follows:
Range: Click the Collapse Dialog button next to the Range argument, click the Sales by Store
worksheet tab, and highlight the range A3:A26. Press the ENTER key on your keyboard. Click in
the input box for the Range argument and place an absolute reference on the range. Press the
TAB key on your keyboard to advance to the next argument.
Criteria: Type cell A3. Complete the function by clicking the OK button at the bottom of the
Function Arguments dialog box.
2.Copy and paste the COUNTIF function in cell C3 by double clicking the Auto Fill Handle. The
function will show the number of stores for each region.
3.Click cell D3 on the Summary Report worksheet. This column will be used to sum the current
sales by region. Begin the function by clicking the Formulas tab on the Ribbon. Click the Math &
Trig button and select the SUMIF function from the list. Define the arguments in the Function
Arguments dialog box as follows:
Range: Click the Collapse Dialog button next to the Range argument, click the Sales by Store
worksheet tab, and highlight the range A3:A26. Press the ENTER key on your keyboard. Click in
the input box for the Range argument and place an absolute reference on the range. Press the
TAB key on your keyboard to advance to the next argument.
Criteria: Type cell A3. Press the TAB key on your keyboard to advance to the next argument.
Sum_range: Click the Collapse Dialog button next to the Sum_range argument, click the Sales
by Store worksheet tab, and highlight the range I3:I26. Press the ENTER key on your keyboard.
Click in the input box for the Sum_range argument and place an absolute reference on the range.
Complete the function by clicking the OK button at the bottom of the Function Arguments dialog
box.
4. Copy and paste the SUMIF function in cell D3 by double clicking the Auto Fill Handle. The
function will show the total sales this year for each region.
5. Click cell E3 on the Summary Report worksheet. This column will be used to sum the sales
last year by region. Enter a SUMIF function and define the arguments exactly as stated in step 3.
However, define the Sum_range argument with the range H3:H26 on the Sales by Store
worksheet. Remember to put an absolute reference on this range before completing the function.
6.Copy and paste the SUMIF function in cell E3 by double clicking the Auto Fill Handle. The
function will show the total sales last year for each region.
7. Enter a formula in cell F3 on.
Click cell C3 on the Summary Report worksheet This column w.pdfABHISANJEET
Click cell C3 on the Summary Report worksheet. This column will be used to count the stores for
each region of the company. Begin the function by clicking the Formulas tab on the Ribbon. Click
the More Functions button, click the Statistical option, and then click the COUNTIF function from
the list. Define the arguments in the Function Arguments dialog box as follows: Range: Click the
Collapse Dialog button next to the Range argument, click the Sales by Store worksheet tab, and
highlight the range A3:A26. Press the ENTER key on your keyboard. Click in the input box for the
Range argument and place an absolute reference on the range. Press the TAB key on your
keyboard to advance to the next argument. Criteria: Type cell A3. Complete the function by
clicking the OK button at the bottom of the Function Arguments dialog box. Copy and paste the
COUNTIF function in cell C3 by double clicking the Auto Fill Handle. The function will show the
number of stores for each region. Click cell D3 on the Summary Report worksheet. This column
will be used to sum the current sales by region. Begin the function by clicking the Formulas tab on
the Ribbon. Click the Math & Trig button and select the SUMIF function from the list. Define the
arguments in the Function Arguments dialog box as follows: Range: Click the Collapse Dialog
button next to the Range argument, click the Sales by Store worksheet tab, and highlight the
range A3:A26. Press the ENTER key on your keyboard. Click in the input box for the Range
argument and place an absolute reference on the range. Press the TAB key on your keyboard to
advance to the next argument. Criteria: Type cell A3. Press the TAB key on your keyboard to
advance to the next argument. Sum_range: Click the Collapse Dialog button next to the
Sum_range argument, click the Sales by Store worksheet tab, and highlight the range I3:I26.
Press the ENTER key on your keyboard. Click in the input box for the Sum_range argument and
place an absolute reference on the range. Complete the function by clicking the OK button at the
bottom of the Function Arguments dialog box. Copy and paste the SUMIF function in cell D3 by
double clicking the Auto Fill Handle. The function will show the total sales this year for each
region. Click cell E3 on the Summary Report worksheet. This column will be used to sum the sales
last year by region. Enter a SUMIF function and define the arguments exactly as stated in step 3.
However, define the Sum_range argument with the range H3:H26 on the Sales by Store
worksheet. Remember to put an absolute reference on this range before completing the function.
Copy and paste the SUMIF function in cell E3 by double clicking the Auto Fill Handle. The function
will show the total sales last year for each region. Enter a formula in cell F3 on the Summary
Report worksheet to calculate the percent change in sales for each region. Your formula should
first subtract the Sales Last Year in cell E3 from the Sales This Year in cell D3.
This image appears when a project instruction has changed to accommo.docxjuan1826
This image appears when a project instruction has changed to accommodate an update to
Microsoft 365 Apps
. If the instruction does not match your version of Office, try using the alternate instruction instead.
Open the start file
EX2019-SkillReview-8-1
. The file will be renamed automatically to include your name. Change the project file name if directed to do so by your instructor, and save it.
If the workbook opens in Protected View, click the
Enable Editing
button in the Message Bar at the top of the workbook so you can modify the workbook.
NOTE
: If group titles are not visible on your
Ribbon
in
Excel for Mac
, click the
Excel
menu and select
Preferences
to open the
Excel Preferences
dialog box. Click the
View
button and check the
Group Titles
check box under
In Ribbon, Show
. Close the
Excel Preferences
dialog box.
Use GETPIVOTDATA to extract data from a PivotTable. In cell D1 on the
Analysis
worksheet, display the total annual sales for Ambulatory Care of TX, Inc.
If necessary, go to the
Analysis
worksheet.
Select cell
D1
.
Type
=
Click the
PivotTable
worksheet tab.
Click cell
B4
.
Press
Enter
.
Use consolidate to create a summary of the sales data by region. The summary will be located on the
Analysis
worksheet.
Remain on the
Analysis
worksheet and select cell
A4
.
On the
Data
tab, in the
Data Tools
group, click the
Consolidate
button.
Verify that
Sum
is selected in the
Function
box.
If there are any references in the
All references
box, click each and then click the
-
button to remove them.
Click in the
Reference
box, and then click the
Sales Data
worksheet tab. Click and drag to select cells
C3:E67
.
Click both the
Top row
and
Left column
check boxes.
Click
OK
.
On the
Analysis
worksheet, delete cells
B4:B12
, allowing the other cells to shift left.
Sort the sales data alphabetically by region and then by last name.
Go to the
Sales Data
worksheet, and click any cell in the data set.
On the
Data
tab, in the
Sort & Filter
group, click the
Sort
button.
In the
Sort
dialog, expand the
Sort by
,
Column
list, and select
Region
.
Click the
+
button to add a level.
Expand the
Then by, Column
list, and select
Last Name
.
Click
OK
.
Add subtotals to the data to calculate the total commission earned for each sales associate.
On the
Data
tab, in the
Outline
group, click the
Subtotal
button.
Expand the
At each change in
list, and select
Last Name
.
Verify that
Sum
is selected in the
Use function
box.
Verify that there is a checkmark next to
Commission Earned
in the
Add subtotal to
box.
Click
OK
.
Copy the subtotal data to the
Analysis
worksheet.
On the
Sales Data
worksheet, click the outline level
2
button to collapse the list so only the total commission earned for each sales associate is visible. This will make it easier to copy the data.
Select cells
A3:G77
and copy th.
Advance-excel-professional-trainer-in-mumbaiUnmesh Baile
Vibrant Technologies is headquarted in Mumbai,India.We are the best Advanced Excel training provider in Navi Mumbai who provides Live Projects to students.We provide Corporate Training also.We are Best Advanced Excel classes in Mumbai according to our students and corporates
Grader - Instructions Excel 2019 ProjectExcel_Comprehensive_Capstone2_Summer_Revenue
Project Description:
In this project, you will apply skills you practiced from the objectives in Excel Chapters 4 through 10. You will develop a workbook for Frank Osei, the Vice President of Finance, that includes financial information and analysis regarding summer product revenue.
Steps to Perform:
Step
Instructions
Points Possible
1
Open the Excel file
Student_
Excel_Comp_Cap2_Summer_Revenue.xlsx downloaded with this project.
0
2
On the Maine Store worksheet, in the range B9:B16, use the Fill Series feature to enter interest rates beginning with
8.00%. Decrease the amounts by
.50% ending with
4.50%. Format the rates as Percent Style with two decimal places and apply bold and center.
4
3
In cell B8, enter a PMT function using the information in the range B2:B4 to calculate a monthly payment. Be sure that the result displays as a positive number.
2
4
In cells B8:H16, create a Data Table using the information in cells B2:B4 where the row input cell is the Period and the column input cell is the rate. Apply the format in B8 to the results in the data table, and then AutoFit columns C:H. Format the payment option closest to and less than $10,000 per month with the Note cell style. Change the Orientation to Landscape.
4
5
On the Quarterly Apparel Costs worksheet, apply the Currency [0] cell style to the range B6:E6. Apply the Comma [0] cell style to the range B7:E17. To the range B18:E18, apply the Currency [0] and Total cell styles.
2
6
Name the ranges B6:E10
Swim_Costs; B11:E14
Shirt_Costs; B15:E16
Jacket_Costs; and B17:E17
Hats_Costs.
2
7
Insert a new row 15. In cell A15, type
Go Explore Shirts. In cell B15, type
9500. In cell C15, type
9695. In cell D15, type
8315. In cell E15, type
9275. Display the Name Manager, and then edit the
Shirt_Costs name to include row 15. Select
Hats_Costs, and edit the name to
Headwear_Costs. (Mac users, click Define Name and make edits using the Define Name dialog box.)
4
8
Click cell B19. On the Formulas tab, in the Formula Auditing group, click Error Checking, and then select Update Formula to Include Cells. Use the fill handle to copy the corrected formula from cell B19 across through cell E19.
2
9
On the Quarterly Apparel Costs worksheet, in cell B25, insert a SUM function to sum the Swim_Costs named range, using the name in the formula. Cr.
For sales data analysis, by creating data breakdowns and filters (example by region, product, salesperson, etc). Objective of Easy Pivot is to provide alternative, easier to understand Pivot Table.
A Skills Approach Excel 2013 Chapter 3 Using Formulas and Fu.docxannetnash8266
A Skills Approach: Excel 2013 Chapter 3: Using Formulas and Functions
1 | Page skill review 3.1 Last Updated 4/3/15
skill review 3.1
In this project, you will complete a staff billing workbook similar to the one you worked on in Chapter 1. This
worksheet is more complicated and uses a variety of formulas to calculate information about each staff member’s
weekly billing and to generate client bills from the staff hours. As you work on the Marshall Hours worksheet, you
can use the Luz Hours or Stevens Hours worksheet as a guide. This is a long project. Be sure to save your work often!
Skills needed to complete this project:
Naming Ranges of Cells
Using CONCATENATE to Combine Text
Creating Formulas Referencing Data from Other Worksheets
Finding Data Using the VLOOKUP Function
Working with Named Ranges
Using the Function Arguments Dialog to Enter Function
Creating Formulas Using Counting Functions
Using Formula AutoComplete to Enter Functions
Calculating Averages
Finding Minimum and Maximum Values
Using the Logical Function IF
Displaying and Printing Formulas
Using Date and Time Functions
Checking Formulas for Errors
Finding Errors Using Trace Precedents and Trace Dependents
Updating Named Ranges with the Name Manager
Editing and Deleting Names with the Name Manager
Calculating Loan Payments Using the PMT Function
1. Open the start file EX2013-SkillReview-3-1.The file will be renamed automatically to include your
name. Change the project file name if directed to do so by your instructor, and save it.
2. If the workbook opens in Protected View, click the Enable Editing button in the Message Bar at
the top of the workbook.
3. The Luz Hours and Stevens Hours worksheets are completed, but they contain errors. You’ll need to fix
the errors before working on the Marshall Hours worksheet.
a. Click the Luz Hours sheet tab.
b. Click cell C4.
c. Notice the #NAME? error. Move your mouse over the Smart Tag icon to display a tool tip
describing the possible error—The formula contains unrecognized text.
d. The formula =VLOOKUP(C3,BillableRates,4,FALSE) references the named range
BillableRates. That name has not yet been defined. That’s what is causing the error.
4. Billable rates are kept in the Rates worksheet. Create the name BillableRates to use in formulas
throughout the workbook.
a. Click the Rates sheet tab.
b. Select cells A3:D5.
c. Type BillableRates in the Name box.
d. Press Enter.
Step 1
Download
start file
A Skills Approach: Excel 2013 Chapter 3: Using Formulas and Functions
2 | Page skill review 3.1 Last Updated 4/3/15
5. Return to the Luz Hours worksheet. Notice all the errors have been fixed. Now you can move on to
completing the Marshall Hours sheet.
6. Enter a formula in cell C2 to display Marshall’s full name in the format Bob Smith. Staff names are
kept in the Rates worksheet.
a. Click the Marshall Hours sheet tab, and click cell.
Solved in excel every step. Result is exactly as the screenshot in instruction sheet. You need to insert documentation worksheet from your excel which contains your name.
this assignment is due today...... 6 hours to do...... You are o.docxdmark846
this assignment is due today...... 6 hours to do......
You are only editing the excel attachment
__________________________________________________________________________
Edit the excel attachment by doing the following steps:
Open the start file
EX2019-SkillReview-1-1
. The file will be renamed automatically to include your name. Change the file name if directed to do so by your instructor, and save it.
If the workbook opens in Protected View, click the
Enable Editing
button in the Message Bar at the top of the workbook so you can modify the workbook.
Explore the workbook. If you accidentally make changes while exploring, press Ctrl + Z to undo the change.
Click the worksheet tab labeled
Stevens Hours
.
If necessary, use the vertical scroll bar to scroll down so you can see both weeks of billable hours. (If necessary, use the vertical scroll bar again to return to the top of the worksheet.)
Click cell
B2
(the cell displaying the staff member’s last name, Stevens). This is the cell at the intersection of column B and row 2.
Note that the column B and row 2 selector boxes highlight.
Note that the status bar displays Ready, indicating that you are in Ready mode.
On the
Home
tab, in the
Number
group, look at the
Number Format
box at the top of the group. Note that the format for this cell is
General
.
Double-click cell
B2
to switch to Edit mode. Note that the status bar now displays
Edit
, and the blinking cursor appears within the cell. If you needed to, you could edit the text directly in the cell.
Press Esc to exit Edit mode and return to Ready mode.
Press Enter twice to move to cell
B4
(the cell displaying the staff member’s billable rate). This cell is formatted with the Accounting Number Format number format.
Look in the
Number Format
box and note that the format for this cell is
Accounting
.
On the
Home
tab, in the
Styles
group, look in the
Cell Styles
gallery, and note that the cell style
Currency
is highlighted. (If the
Cell Styles
gallery is collapsed on your Ribbon, click the
Cell Styles
button to display it.)
Click cell
B8
(the cell displaying the number of hours for Monday, August 5). This cell is formatted with the Comma cell style.
Look in the
Number Format
box and note that the format for this cell is also
Accounting
.
On the
Home
tab, in the
Styles
group, look in the
Cell Styles
gallery, and note that the cell style
Comma
is highlighted for this cell. (If the
Cell Styles
gallery is collapsed on your Ribbon, click the
Cell Styles
button to display it.)
Note the style differences between cell
B4
(Accounting Number Format, Currency style) and cell
B8
(Accounting Number Format, Comma style).
Click cell
B7
(the cell displaying the date 8/5/2019). This cell is formatted using the Short Date format. Note that the
Number Format
box displays
Date
.
Double-click cell
B14
.
Note that the status bar now disp.
The Wear-Ever Shoes company maintains inventory data and custome.docxpelise1
The Wear-Ever Shoes company maintains inventory data and customer survey results in your workbook. You use
Lookup & Reference
,
Database
, and
Logical
functions to complete the data. You also use a
Financial
function to calculate depreciation and a
Text
function to enter email addresses.
[Student Learning Outcomes 6.1, 6.2, 6.3, 6.5, 6.6, 6.7]
File Needed:
WearEverShoes-06.xlsx
(Available from the
Start File
link.)
Completed Project File Name:
[your name]-WearEverShoes-06.xlsx
Skills Covered in This Project
Nest
INDEX
and
MATCH
functions.
Use
SUMIFS
from the
Math & Trig
category.
Use
DAVERAGE
.
Create an
IFS
formula.
Use a
Text
function to concatenate text strings.
Calculate depreciation with the
DB
function.
Open the
WearEverShoes-06
start file. The file will be renamed automatically to include your name. Change the project file name if directed to do so by your instructor, and save it.
Click the
Inventory
sheet tab.
Select cells
A3:I39
, click the
Name
box, type
Inventory
as the range name, and press
Enter
.
Select cell
L5
and type
WE006
.
Create a nested function with
INDEX
and
MATCH
to display inventory for a product.
Select cell
L6
.
Click the
Lookup & Reference
button [
Formulas
tab,
Function Library
group] and choose
INDEX
. Select the first argument list
array, row_num, column_num
and click
OK
.
For the
Array
argument, press
F3
(
FN
+
F3
) and select
Inventory
.
Click the
Row_num
box and click the
Name
box arrow. Choose
MATCH
in the list or choose
More Functions
to find and select
MATCH
. The
INDEX
function uses this
MATCH
statement to find the row.
Click cell
L5
for the
Lookup_value
argument.
Click the
Lookup_array
box and select cells
A3:A39
. This
MATCH
function finds the row that matches cell L5 in column A.
Click the
Match_type
argument and type
0
.
Click
INDEX
in the
Formula
bar. (Click
OK
if the argument list opens.)
Click the
Column_num
argument, click the
Name
box arrow, and choose
MATCH
(Figure 6-92).
Figure 6-92
MATCH
is nested twice
Type
quantity
in the
Lookup_value
box.
Click the
Lookup_array
box and select cells
A3:I3
. This
MATCH
function finds the cell in the “Quantity” column after the row is located by the first
MATCH
function.
Click the
Match_type
box and type
0
. The formula is
=INDEX(Inventory,MATCH(L5,A3:A39,0),MATCH(“quantity”,A3:I3,0))
.
Click
OK
. The result is 2.
Click cell
L5
, type
WE015
, and press
Enter
. The quantity is updated.
Use
SUMIFS
to calculate total pairs in stock by specific criteria.
Select cell
M13
.
Click the
Math & Trig
button [
Formulas
tab,
Function Library
group] and choose
SUMIFS
.
Select cells
E4:E39
for the
Sum_range
argument and press
F4
(
FN
+
F4
) to make the references absolute.
Click the
Criteria_range1
box, select cells
C4:C39
, the “Color” field, and press
F4
(
FN
+
F4
).
Click the
Criteria1
.
IMPORTANT If you are a Canadian user, be sure to verify that yourhe45mcurnow
IMPORTANT
: If you are a Canadian user, be sure to verify that your browser and Microsoft Office use the same country settings. See
here
for a Help topic on how to change your settings.
Open the start file
EX2019-SkillReview-1-1
. The file will be renamed automatically to include your name. Change the file name if directed to do so by your instructor, and save it.
If the workbook opens in Protected View, click the
Enable Editing
button in the Message Bar at the top of the workbook so you can modify the workbook.
NOTE
: If
group titles
are not visible on your Ribbon, click the
Excel
menu and select
Preferences
to open the
Excel Preferences
dialog box. Click the
View
button and check the
Group Titles
check box under
In Ribbon, Show
. Close the
Excel Preferences
dialog box.
Explore the workbook. If you accidentally make changes while exploring, press Ctrl + Z to undo the change.
Click the worksheet tab labeled
Stevens Hours
.
If necessary, use the vertical scroll bar to scroll down so you can see both weeks of billable hours. (If necessary, use the vertical scroll bar again to return to the top of the worksheet.)
Click cell
B2
(the cell displaying the staff member’s last name, Stevens). This is the cell at the intersection of column B and row 2.
Note that the column B and row 2 selector boxes highlight.
Note that the status bar displays Ready, indicating that you are in Ready mode.
On the
Home
tab, in the
Number
group, look at the
Number Format
box at the top of the group. Note that the format for this cell is
General
.
Double-click cell
B2
to switch to Edit mode. Note that the status bar now displays
Edit
, and the blinking cursor appears within the cell. If you needed to, you could edit the text directly in the cell.
Press Esc to exit Edit mode and return to Ready mode.
Press Enter twice to move to cell
B4
(the cell displaying the staff member’s billable rate). This cell is formatted with the
Accounting
Number Format
(or
Custom
) number format.
Look in the
Number Format
box and note that the format for this cell is
Accounting
(or
Custom
).
On the
Home
tab, in the
Styles
group, look in the
Cell Styles
gallery, and note that the cell style
Currency
is highlighted. (If the
Cell Styles
gallery is collapsed on your Ribbon, click the
Cell Styles
button to display it.)
Click cell
B8
(the cell displaying the number of hours for Monday, August 5). This cell is formatted with the Custom cell style.
Look in the
Number Format
box and note that the format for this cell is also
Accounting
(or
Custom
).
On the
Home
tab, in the
Styles
group, look in the
Cell Styles
gallery, and note that the cell style
Comma
is highlighted for this cell. (If the
Cell Styles
gallery is collapsed on your Ribbon, click the
Cell Styles
button to display it.)
Note the style differences between cell
B4
(Accounting Number Format, Currency style) and ...
River bed Corporation is preparing its December 312020 ba.pdfabhijitakolkar1
River bed Corporation is preparing its December 31,2020 , balance sheet. The following items
may be reported as either a current or long-term liability. 1. On December 15,2020 . Riverbed
declared a cash dividend of $2.40 per share to stockholders of record on December 31 . The
dividend is payable on January 15, 2021. Riverbed has issued 1,000,000 shares of common
stock, of which 50,000 shares are held in treasury. 2. At December 31 , bonds payable of $111,
299,000 are outstanding. The bonds pay 12% interest every September 30 and mature in
installments of $27,824,750 every September 30 , beginning September 30,2021. 3. At December
31,2019 , customer advances were $13,603,000. During 2020 , Riverbed collected $30,634,000 of
customer advances; advances of $26,948,000 should be recognized in income. For each item
above, indicate the dollar amounts to be reported as a current liability and as a long-term liability, if
any..
Which of the following statements is supported by the theory.pdfabhijitakolkar1
Which of the following statements is supported by the theory of endosymbiosis? You may select
more than one answer.
Group of answer choices:
Protist lineages have arisen from both primary and secondary endosymbiosis
Primary endosymbiosis led to the evolution and radiation of plants
One of the early steps in primary endosymbiosis involved an internal symbiosis between a
heterotrophic bacterium and another early microorganism (probably an Archaea)
Plant lineages have arisen from both primary and secondary endosymbiosis.
More Related Content
Similar to Need help with formulas Begin this exercise by opening the .pdf
For sales data analysis, by creating data breakdowns and filters (example by region, product, salesperson, etc). Objective of Easy Pivot is to provide alternative, easier to understand Pivot Table.
A Skills Approach Excel 2013 Chapter 3 Using Formulas and Fu.docxannetnash8266
A Skills Approach: Excel 2013 Chapter 3: Using Formulas and Functions
1 | Page skill review 3.1 Last Updated 4/3/15
skill review 3.1
In this project, you will complete a staff billing workbook similar to the one you worked on in Chapter 1. This
worksheet is more complicated and uses a variety of formulas to calculate information about each staff member’s
weekly billing and to generate client bills from the staff hours. As you work on the Marshall Hours worksheet, you
can use the Luz Hours or Stevens Hours worksheet as a guide. This is a long project. Be sure to save your work often!
Skills needed to complete this project:
Naming Ranges of Cells
Using CONCATENATE to Combine Text
Creating Formulas Referencing Data from Other Worksheets
Finding Data Using the VLOOKUP Function
Working with Named Ranges
Using the Function Arguments Dialog to Enter Function
Creating Formulas Using Counting Functions
Using Formula AutoComplete to Enter Functions
Calculating Averages
Finding Minimum and Maximum Values
Using the Logical Function IF
Displaying and Printing Formulas
Using Date and Time Functions
Checking Formulas for Errors
Finding Errors Using Trace Precedents and Trace Dependents
Updating Named Ranges with the Name Manager
Editing and Deleting Names with the Name Manager
Calculating Loan Payments Using the PMT Function
1. Open the start file EX2013-SkillReview-3-1.The file will be renamed automatically to include your
name. Change the project file name if directed to do so by your instructor, and save it.
2. If the workbook opens in Protected View, click the Enable Editing button in the Message Bar at
the top of the workbook.
3. The Luz Hours and Stevens Hours worksheets are completed, but they contain errors. You’ll need to fix
the errors before working on the Marshall Hours worksheet.
a. Click the Luz Hours sheet tab.
b. Click cell C4.
c. Notice the #NAME? error. Move your mouse over the Smart Tag icon to display a tool tip
describing the possible error—The formula contains unrecognized text.
d. The formula =VLOOKUP(C3,BillableRates,4,FALSE) references the named range
BillableRates. That name has not yet been defined. That’s what is causing the error.
4. Billable rates are kept in the Rates worksheet. Create the name BillableRates to use in formulas
throughout the workbook.
a. Click the Rates sheet tab.
b. Select cells A3:D5.
c. Type BillableRates in the Name box.
d. Press Enter.
Step 1
Download
start file
A Skills Approach: Excel 2013 Chapter 3: Using Formulas and Functions
2 | Page skill review 3.1 Last Updated 4/3/15
5. Return to the Luz Hours worksheet. Notice all the errors have been fixed. Now you can move on to
completing the Marshall Hours sheet.
6. Enter a formula in cell C2 to display Marshall’s full name in the format Bob Smith. Staff names are
kept in the Rates worksheet.
a. Click the Marshall Hours sheet tab, and click cell.
Solved in excel every step. Result is exactly as the screenshot in instruction sheet. You need to insert documentation worksheet from your excel which contains your name.
this assignment is due today...... 6 hours to do...... You are o.docxdmark846
this assignment is due today...... 6 hours to do......
You are only editing the excel attachment
__________________________________________________________________________
Edit the excel attachment by doing the following steps:
Open the start file
EX2019-SkillReview-1-1
. The file will be renamed automatically to include your name. Change the file name if directed to do so by your instructor, and save it.
If the workbook opens in Protected View, click the
Enable Editing
button in the Message Bar at the top of the workbook so you can modify the workbook.
Explore the workbook. If you accidentally make changes while exploring, press Ctrl + Z to undo the change.
Click the worksheet tab labeled
Stevens Hours
.
If necessary, use the vertical scroll bar to scroll down so you can see both weeks of billable hours. (If necessary, use the vertical scroll bar again to return to the top of the worksheet.)
Click cell
B2
(the cell displaying the staff member’s last name, Stevens). This is the cell at the intersection of column B and row 2.
Note that the column B and row 2 selector boxes highlight.
Note that the status bar displays Ready, indicating that you are in Ready mode.
On the
Home
tab, in the
Number
group, look at the
Number Format
box at the top of the group. Note that the format for this cell is
General
.
Double-click cell
B2
to switch to Edit mode. Note that the status bar now displays
Edit
, and the blinking cursor appears within the cell. If you needed to, you could edit the text directly in the cell.
Press Esc to exit Edit mode and return to Ready mode.
Press Enter twice to move to cell
B4
(the cell displaying the staff member’s billable rate). This cell is formatted with the Accounting Number Format number format.
Look in the
Number Format
box and note that the format for this cell is
Accounting
.
On the
Home
tab, in the
Styles
group, look in the
Cell Styles
gallery, and note that the cell style
Currency
is highlighted. (If the
Cell Styles
gallery is collapsed on your Ribbon, click the
Cell Styles
button to display it.)
Click cell
B8
(the cell displaying the number of hours for Monday, August 5). This cell is formatted with the Comma cell style.
Look in the
Number Format
box and note that the format for this cell is also
Accounting
.
On the
Home
tab, in the
Styles
group, look in the
Cell Styles
gallery, and note that the cell style
Comma
is highlighted for this cell. (If the
Cell Styles
gallery is collapsed on your Ribbon, click the
Cell Styles
button to display it.)
Note the style differences between cell
B4
(Accounting Number Format, Currency style) and cell
B8
(Accounting Number Format, Comma style).
Click cell
B7
(the cell displaying the date 8/5/2019). This cell is formatted using the Short Date format. Note that the
Number Format
box displays
Date
.
Double-click cell
B14
.
Note that the status bar now disp.
The Wear-Ever Shoes company maintains inventory data and custome.docxpelise1
The Wear-Ever Shoes company maintains inventory data and customer survey results in your workbook. You use
Lookup & Reference
,
Database
, and
Logical
functions to complete the data. You also use a
Financial
function to calculate depreciation and a
Text
function to enter email addresses.
[Student Learning Outcomes 6.1, 6.2, 6.3, 6.5, 6.6, 6.7]
File Needed:
WearEverShoes-06.xlsx
(Available from the
Start File
link.)
Completed Project File Name:
[your name]-WearEverShoes-06.xlsx
Skills Covered in This Project
Nest
INDEX
and
MATCH
functions.
Use
SUMIFS
from the
Math & Trig
category.
Use
DAVERAGE
.
Create an
IFS
formula.
Use a
Text
function to concatenate text strings.
Calculate depreciation with the
DB
function.
Open the
WearEverShoes-06
start file. The file will be renamed automatically to include your name. Change the project file name if directed to do so by your instructor, and save it.
Click the
Inventory
sheet tab.
Select cells
A3:I39
, click the
Name
box, type
Inventory
as the range name, and press
Enter
.
Select cell
L5
and type
WE006
.
Create a nested function with
INDEX
and
MATCH
to display inventory for a product.
Select cell
L6
.
Click the
Lookup & Reference
button [
Formulas
tab,
Function Library
group] and choose
INDEX
. Select the first argument list
array, row_num, column_num
and click
OK
.
For the
Array
argument, press
F3
(
FN
+
F3
) and select
Inventory
.
Click the
Row_num
box and click the
Name
box arrow. Choose
MATCH
in the list or choose
More Functions
to find and select
MATCH
. The
INDEX
function uses this
MATCH
statement to find the row.
Click cell
L5
for the
Lookup_value
argument.
Click the
Lookup_array
box and select cells
A3:A39
. This
MATCH
function finds the row that matches cell L5 in column A.
Click the
Match_type
argument and type
0
.
Click
INDEX
in the
Formula
bar. (Click
OK
if the argument list opens.)
Click the
Column_num
argument, click the
Name
box arrow, and choose
MATCH
(Figure 6-92).
Figure 6-92
MATCH
is nested twice
Type
quantity
in the
Lookup_value
box.
Click the
Lookup_array
box and select cells
A3:I3
. This
MATCH
function finds the cell in the “Quantity” column after the row is located by the first
MATCH
function.
Click the
Match_type
box and type
0
. The formula is
=INDEX(Inventory,MATCH(L5,A3:A39,0),MATCH(“quantity”,A3:I3,0))
.
Click
OK
. The result is 2.
Click cell
L5
, type
WE015
, and press
Enter
. The quantity is updated.
Use
SUMIFS
to calculate total pairs in stock by specific criteria.
Select cell
M13
.
Click the
Math & Trig
button [
Formulas
tab,
Function Library
group] and choose
SUMIFS
.
Select cells
E4:E39
for the
Sum_range
argument and press
F4
(
FN
+
F4
) to make the references absolute.
Click the
Criteria_range1
box, select cells
C4:C39
, the “Color” field, and press
F4
(
FN
+
F4
).
Click the
Criteria1
.
IMPORTANT If you are a Canadian user, be sure to verify that yourhe45mcurnow
IMPORTANT
: If you are a Canadian user, be sure to verify that your browser and Microsoft Office use the same country settings. See
here
for a Help topic on how to change your settings.
Open the start file
EX2019-SkillReview-1-1
. The file will be renamed automatically to include your name. Change the file name if directed to do so by your instructor, and save it.
If the workbook opens in Protected View, click the
Enable Editing
button in the Message Bar at the top of the workbook so you can modify the workbook.
NOTE
: If
group titles
are not visible on your Ribbon, click the
Excel
menu and select
Preferences
to open the
Excel Preferences
dialog box. Click the
View
button and check the
Group Titles
check box under
In Ribbon, Show
. Close the
Excel Preferences
dialog box.
Explore the workbook. If you accidentally make changes while exploring, press Ctrl + Z to undo the change.
Click the worksheet tab labeled
Stevens Hours
.
If necessary, use the vertical scroll bar to scroll down so you can see both weeks of billable hours. (If necessary, use the vertical scroll bar again to return to the top of the worksheet.)
Click cell
B2
(the cell displaying the staff member’s last name, Stevens). This is the cell at the intersection of column B and row 2.
Note that the column B and row 2 selector boxes highlight.
Note that the status bar displays Ready, indicating that you are in Ready mode.
On the
Home
tab, in the
Number
group, look at the
Number Format
box at the top of the group. Note that the format for this cell is
General
.
Double-click cell
B2
to switch to Edit mode. Note that the status bar now displays
Edit
, and the blinking cursor appears within the cell. If you needed to, you could edit the text directly in the cell.
Press Esc to exit Edit mode and return to Ready mode.
Press Enter twice to move to cell
B4
(the cell displaying the staff member’s billable rate). This cell is formatted with the
Accounting
Number Format
(or
Custom
) number format.
Look in the
Number Format
box and note that the format for this cell is
Accounting
(or
Custom
).
On the
Home
tab, in the
Styles
group, look in the
Cell Styles
gallery, and note that the cell style
Currency
is highlighted. (If the
Cell Styles
gallery is collapsed on your Ribbon, click the
Cell Styles
button to display it.)
Click cell
B8
(the cell displaying the number of hours for Monday, August 5). This cell is formatted with the Custom cell style.
Look in the
Number Format
box and note that the format for this cell is also
Accounting
(or
Custom
).
On the
Home
tab, in the
Styles
group, look in the
Cell Styles
gallery, and note that the cell style
Comma
is highlighted for this cell. (If the
Cell Styles
gallery is collapsed on your Ribbon, click the
Cell Styles
button to display it.)
Note the style differences between cell
B4
(Accounting Number Format, Currency style) and ...
River bed Corporation is preparing its December 312020 ba.pdfabhijitakolkar1
River bed Corporation is preparing its December 31,2020 , balance sheet. The following items
may be reported as either a current or long-term liability. 1. On December 15,2020 . Riverbed
declared a cash dividend of $2.40 per share to stockholders of record on December 31 . The
dividend is payable on January 15, 2021. Riverbed has issued 1,000,000 shares of common
stock, of which 50,000 shares are held in treasury. 2. At December 31 , bonds payable of $111,
299,000 are outstanding. The bonds pay 12% interest every September 30 and mature in
installments of $27,824,750 every September 30 , beginning September 30,2021. 3. At December
31,2019 , customer advances were $13,603,000. During 2020 , Riverbed collected $30,634,000 of
customer advances; advances of $26,948,000 should be recognized in income. For each item
above, indicate the dollar amounts to be reported as a current liability and as a long-term liability, if
any..
Which of the following statements is supported by the theory.pdfabhijitakolkar1
Which of the following statements is supported by the theory of endosymbiosis? You may select
more than one answer.
Group of answer choices:
Protist lineages have arisen from both primary and secondary endosymbiosis
Primary endosymbiosis led to the evolution and radiation of plants
One of the early steps in primary endosymbiosis involved an internal symbiosis between a
heterotrophic bacterium and another early microorganism (probably an Archaea)
Plant lineages have arisen from both primary and secondary endosymbiosis.
Write a threepage report of approximately 1 500 words in .pdfabhijitakolkar1
Write a three-page report (of approximately 1 500 words) in which you evaluate how Land Bank,
as part of its corporate governance effort, is ensuring that the company is well-managed and
functioning with integrity and accountability.
Guide:
-Introduction
-Define corporate governance in the context of Land Bank.
-orporate governance at Land Bank elements to consider: Land Banks corporate governance
effort Stakeholder engagement and relationships Risks and opportunities Strategy and resource
allocation Performance and outlook Remuneration Governance
- Define corporate citizenship in the context of Land Bank.
-Consider the following forces that guide and shape ethical conduct at Land Bank: Ethics
management strategy Ethics risk assessment.
- Concludion.
Which of the following are associated with mitotic division .pdfabhijitakolkar1
Which of the following are associated with mitotic division in animals (select all that apply)?
cell plate
recombination
kinetochores
contractile ring
ploidy reduction
synapsis
cell plate
recombination
kinetochores
contractile ring
ploidy reduction
synapsis.
What is the optimal foraging model Natural selection shou.pdfabhijitakolkar1
What is the optimal foraging model?
Natural selection should favor behavior that minimizes costs and maximizes benefits.
Rovers will outcompete sitters independent of population density.
Crowded conditions are a selective pressure on foraging behavior.
Natural selection favors the dominant rover phenotype..
Sheffield Corp emite 5100 acciones ordinarias de valor nomi.pdfabhijitakolkar1
Sheffield Corp. emite 5100 acciones ordinarias de valor nominal de $10 con un valor razonable de
$30 por accin y 8100 acciones preferentes de valor nominal de $10 con un valor razonable de $20
por accin por una suma global de $301000. El producto asignado a las acciones ordinarias es
$127000
$153000
$146200
$154800.
What do the following program segments print Find the answe.pdfabhijitakolkar1
What do the following program segments print? Find the answers by tracing the code, not by using
the computer. a. n=1 C. x=1.0 for i in range (2,5) : y=1.0 n=n+i i=0 print(n) while y>=1.5 : b. n=1/2
x=x/2 i=2 y=x+y while i<6 : n=n+1/iprint(i) i=i+1 print(i).
The North American pronghorn has a number of adaptations whi.pdfabhijitakolkar1
The North American pronghorn has a number of adaptations which allow it to survive in an open
plains environment, including teeth and a digestive system specialized to process prairie grasses
and shrubs. Found in parts of Southern Alberta, individuals of this species can sustain speeds of
up to 80km/ hour, and are known to travel in herds. Cougars, wolves, coyotes and bobcats are
their major predators. At one time, herds of nearly 40000000 pronghorn were scattered across
North America; now there are fewer than 30000. 3) Provide two examples of specific features of
the pronghorn's abiotic environment that have helped shape its physical features and behaviour.
Explain each. (2) 4) List and explain one biotic and one abiotic limiting factor that might be
responsible for the reduction in pronghorn populations in recent years. (2) 5) A hypothetical
terrestrial ecosystem lies near the equator in a region known to receive relatively high amounts of
precipitation. What characteristics would we expect this ecosystem to display? Explain (think of
the flora and fauna). (2).
The journal entry to record the accrual of interest expense .pdfabhijitakolkar1
The journal entry to record the accrual of interest expense on a one-year note requires a credit to
Prepaid Interest.
Interest Expense.
Cash.
Interest Payable.
Prepaid Interest.
Interest Expense.
Cash.
Interest Payable..
tewer mill subit a dim in the coming vear 0055094501110.pdfabhijitakolkar1
tewer mill subit a dim in the coming vear? 0.0550.9450.1110.834 Aishe in the ont. Thes ors 4.000
teron in tre le: 2000 16.500 thes ars 2400 1.349 Hase in tha iat.
TA 204a Differentiate local from systemic signs of malign.pdfabhijitakolkar1
TA 20.4a. Differentiate local from systemic signs of malignant neoplasms
and include
an example of each.
b. Explain the systemic effects of malignant tumors with regard to (1)
pain, (2) bleeding, (3)
weight loss, and (4) fatigue
b. Explain the systemic effects of malignant tumors with regard to (1)
pain, (2) bleeding, (3)
weight loss, and (4) fatigue.
RunHeavy Corporation RHC is a corporation that manages a l.pdfabhijitakolkar1
RunHeavy Corporation (RHC) is a corporation that manages a local band. It had the following
activities during its first month.
RHC was formed with an investment of $10,800 cash, paid in by the leader of the band on
January 3 in exchange for common stock.
On January 4, RHC purchased music equipment by paying $1,600 cash and signing an $9,200
promissory note payable in three years.
On January 5, RHC booked the band for six concert events, at a price of $2,700 each, but no cash
was collected yet.
Of the six events, four were completed between January 10 and 20.
On January 22, cash was collected for three of the four events.
The other two bookings were for February concerts, but on January 24, RHC collected half of the
$2,700 fee for one of them.
On January 27, RHC paid $2,740 cash for the bands travel-related costs.
On January 28, RHC paid its band members a total of $2,280 cash for salaries and wages for the
first three events.
As of January 31, the band members hadnt yet been paid wages for the fourth event completed in
January, but they would be paid in February at the same rate as for the first three events.
As of January 31, RHC has not yet recorded the $151 of monthly depreciation on the equipment.
Also, RHC has not yet paid or recorded the $69 interest owed on the promissory note at January
31.
RHC is subject to a 20% tax rate on the companys income before tax.
Required:
3-a. Prepare an income statement for January 31.
3-b. Prepare a classified balance sheet for January 31.
RUNHEAVY CORPORATION Balance Sheet At January 31 Assets Current AssetsRUNHEAVY
CORPORATION Income Statement At January 31.
Strategic Public Sector Governance The Critical Role of Comm.pdfabhijitakolkar1
Strategic Public Sector Governance
The Critical Role of Communication for Change Management Sponsors Change management
sponsors are the executives or senior leaders with authority to drive change forward in an
organization. Active and visible sponsorship tops the list of key contributors to successful change
initiatives. A global leader in change management, Prosci has studied these contributors in all 11
editions of its Best Practices in Change Management report, and sponsorship came out on top in
every single one. Sponsorship is so important that it beat out the second contributor (a structured
change management approach) by a 4:1 margin in the most recent report. We cannot overstate
the role change management sponsors play in effectively managing change in organizations. They
are responsible for building support, enlisting help from other leaders and motivating change
participants. Purposeful and consistent communication is the tool sponsors must use to provide
context for the change and bring employees on board. Employees and leaders are far more likely
to engage in a change when they understand what it means to them and why its necessary.
Ineffective sponsors often rush through change, failing to facilitate understanding and build
support through frequent and clear communication. Communication considerations for change
management sponsors The purpose of employing communication as one of the key areas of
change management is to disseminate information to the intended group of people. There are
many forms of communication channels available within an organization including employee
portals, newsletters, emails, static and non-static media as well as face to face communications.
Many organization misunderstood the change communication as a process of mediating instead of
intermediating. To have effective communication, information needs to be interpreted and
reinterpret them into ideas and processes that are easy to understand, thus applying the mediating
technique. While using the communication channels, its best to incorporate latest technologies
albeit social network and video conferencing to enhance outreach to employees. However,
although it is the management's decision to establish any means of communication channels
deemed effective, one must avoid a typical top-down and one way conduits approach while using
these communication facilities to avoid a breakdown in communication. Communication helps
change management sponsors explain the vision for the change to create necessary buy-in.
Sponsors that adopt the following communication practices can better articulate the why, what and
so what of the change, increasing the chances that employees will understand and activate the
behaviors needed for success. 1. Communicate the why People, by nature, are resistant to
change. They first need convincing that the change is important and worth the energy it will take to
implement it. Beehives change model of choice, identifies 2. Awareness as th.
Question 11 1 point Control is the process of comparing ac.pdfabhijitakolkar1
Question 11 (1 point)
Control is the process of comparing actual performance against plan to identify deviations,
evaluate possible alternative courses of actions, and take appropriate corrective action.
Question 11 options:
Question 12 (1 point)
Assessing technical performance of a system, facility, or product is often accomplished by
examining the documents found in the scope statement and/or work package documentation.
Question 12 options:
Question 13 (1 point)
Scope changes should be allowed if:
Question 13 options:
It is clear that the project will fail without the change.
The customer wants it and will pay for it.
The project will be improved significantly with the change.
All the above.
Question 14 (1 point)
Milestone schedules are often used to keep higher level stakeholders informed of progress toward
project milestones.
Question 14 options:
Question 15 (1 point)
The best method for assigning costs to the baseline under the Percent Complete Rule is to:
Question 15 options:
Consider all of the sunk costs of the project and project the ROI based on cost information.
Establish frequent checkpoints over the duration of the work package and assign completion
percentages in dollar terms.
Determine actual costs to estimated costs and show a variance column.
Assess how much of the work has been completed and project the time frame for completing the
remainder of the work.
True
False.
La venta de negocios puede lograr muchos objetivos diferente.pdfabhijitakolkar1
La venta de negocios puede lograr muchos objetivos diferentes, excepto _______.
recaudar dinero en efectivo para ayudar a financiar negocios existentes
enfoque del administrador de dispersin
permitir a los gerentes centrar sus esfuerzos ms directamente en los negocios centrales de la
empresa
proporcionar a la empresa ms recursos para gastar en alternativas ms atractivas.
On January 4 2020 Black Corporation acquired 100 of the o.pdfabhijitakolkar1
On January 4, 2020, Black Corporation acquired 100% of the outstanding shares of White Inc by a
share-for-share exchange of its own shares, valued at $1,800,000. The statements of financial
position of both companies just prior to the share exchange are as follows: Statement of Financial
Position December 31, 2019 Black White Cash $ 100,000 $ 80,000 Accounts and other
receivables.
In a survuy peeple were asked whether they thought sun went.pdfabhijitakolkar1
In a survuy, peeple were asked whether they thought sun went around the plinet Earth of vice
versa. Of 1974 , people, 209 thought the aun went areund Eath. a. What proportion of people in
the survey belened the sun went around Earth? b. Find as 95% confidence interval for the
proportion of ali people with this belied.An a survey, people were ksked whether thery thougth sun
went around the planet Earth or vice versa. Of 1974 people. 209 znought the sun aent around
Eath. a. What progortion of people in the survey beleved the sue went arsend Earth? b. Find a
95% confidence interval bar the progertion of al pecele with this betel. a. The proportion of poople
in the survey who beleved the sun wont around Earth is (Flound to theree thecimal flaces as
notedod) b. The 95% confidence interyal is (Reurd to thee decimal places as needed) c. Is the
scentist's ciaim that 20% of poople in the general population belitve the sun goos arocut Earth
plausible? plausible, since the vatue df the confidence interval (Type an irefeger or a decimal. Do
not routhd.).
Kresel Zihniyet Kresel Zihniyet Bu nedir Neden nemlid.pdfabhijitakolkar1
Kresel Zihniyet
Kresel Zihniyet - Bu nedir? Neden nemlidir? Kii onu nasl gelitirir?
Kresel zihniyet rnekleri veya kresel zihniyet eksiklii
Kresel farkndal ve bunun kresel bir organizasyona liderlik etme eklinizi nasl etkilediini aklayn. ne
Kresel zihniyetin zellikleri?
Kresel zihniyetle uluslararas dzeyde nasl liderlik edilir veya ynetilir?
Etnosentrizm nedir? Kresel yneticilerin etnosentrizmi anlamas neden nemlidir?
Ynetim Uygulamasnda Kltrn Rol
Kresel btnleme ile yerel uyum arasndaki gerilimi aklar. irketlerin bu gerilimi ynetmede alternatifleri
nelerdir ve nasl seim yaplr?
Disneyland Paris davasnda bu gerilim nasl ortaya kt? Leo Burnett davas m?
Kltrler Aras Karlamalar ve renme
nsanlarn yeni bir kltre daldklarnda deneyimledikleri dnce ve duygular nelerdir? Kresel bir ynetici
olarak bu duygu ve tepkileri anlamak neden nemlidir?
Kltr oku nedir ve bir irket yurtdnda yaamann/almann zorluklarn amada yneticilere nasl yardmc
olabilir?
Kltrel Farkllklar Anlamak in ereveler
Kltrn ne olduunu, nereden geldiini aklaynz.
Bu kursta tarttmz kltrel boyut ereveleri nelerdir? bizim iin neden nemliler
kltrler aras ynetimi anlamak iin?
Dynamic Complex Flux'u ve kresel irketleri nasl etkilediini aklayn.
Kltrel Yetkinlii Gelitirmek
Yneticiler, kltrleraras yeterliliklerini artrmak iin ne yapabilirler?
Kltrler aras bir ortamda almak iin hangi kresel beceriler gereklidir?
Kendinizi nasl kresel bir lider haline getirebilirsiniz?
letiimde Kltrler Aras Perspektifler
Amerikallarn iletiim tarzlarnn ortak ynlerini karakterize edin ve dier kltrel iletiim tarzlaryla karlatrn.
Kltrleraras iletiim iin en iyi uygulamalar nelerdir? Vakalardan iyi ve kt kltrler aras iletiime dair baz
rnekler nelerdir?
Global Ekipleri Ynetme
Kresel sanal ekiplerin karlat zorluklar. Kresel bir sanal ekip organize etmek ve ynetmek iin
tavsiyeler (rn. Leo Burnett vakas)
Map-Bridge-Integrate modelini aklar.
Kresel Liderlik
Gre. Javidan ve ark. makale (Bakcnn Gznde), GLOBE almasndan kresel liderlik davranlarnn
evrensel engelleri ve kolaylatrclar nelerdir?
Liderler dnya apnda nasl farkllk gsteriyor? Ltfen okumalardan, vakalardan ve makalelerden rnekler
verin
Kresel Strateji Yrtme
Baarl uluslararas ortak giriimleri ynetmenin zorluklar (rn. Cushy Koltuk, Magdi Batato, Asis ve
Delta Beverages)
Drt farkl kresel strateji ve yap trn anlayn; farkllklar nelerdir ve her birini hangi koullar altnda
kullanmalsnz (Corafi, Kresel Matris, Kresel rn, Uluslararas)
Yeni bir lke balamna girmek iin farkl olas modlar, her birinin avantajlar ve dezavantajlar. Nasl
seersiniz?
Kresel bir irkette i ve d uyum arasndaki uyumu nasl deerlendireceinizi anlayn. Kresel bir ynetici
olarak, strateji ve evreyi eletirmek iin uyum (yap, grev/i yaplar, insanlar) iin nelere dikkat
etmelisiniz?
Kresel irketlerin organizasyon tipini nasl deerlendiriyorsunuz? Organizasyon tipi, kresel i ortamnn
karmaklndan nasl etkilenir?
Kresel Yneticileri Semek ve Gelitirmek
Yurt dndan gelen alanlarn karlat temel gerilim nedir?
Etkili gurbeti alanlar seme.
Instrucciones Relaciona cada palabra o frase con su definic.pdfabhijitakolkar1
Instrucciones: Relaciona cada palabra o frase con su definicin. Tenga en cuenta que no se
utilizarn todas las definiciones.
Rasgos polignicos
Rasgos cuantitativos
Gemelos monocigticos
Gemelos dicigticos
Repeticiones cortas en tndem
Transcripcin
cido ribonucleico
Mutacin
Clula madre
La clonacin reproductiva
A.
Sustitucin de genes defectuosos por genes funcionales
B.
Un marco subconsciente
C.
Ingeniera gentica que duplica exactamente un organismo
D.
Trece secuencias de ADN que todos los humanos portamos
MI.
Rasgos que estn influenciados por ms de un gen.
F.
Gemelos idnticos
GRAMO.
Una clula que resulta de la fertilizacin in vitro.
h
Mellizos
I.
Hacer ARNm a partir de ADN
j
Rasgos que involucran las acciones de muchos genes pero tambin interactan con el medio
ambiente.
k
Utiliza ribosa como azcar en el nucletido.
l
Una clula indiferenciada que an no ha sido programada y puede convertirse en cualquier tipo de
clula
METRO.
Rasgos que tienen mucha variacin en una poblacin
NORTE.
Un cambio en la secuencia de ADN.
Instrucciones: Relaciona cada palabra o frase con su definicin. Tenga en cuenta que no se
utilizarn todas las definiciones.
Rasgos polignicos
Rasgos cuantitativos
Gemelos monocigticos
Gemelos dicigticos
Repeticiones cortas en tndem
Transcripcin
cido ribonucleico
Mutacin
Clula madre
La clonacin reproductiva
A.
Sustitucin de genes defectuosos por genes funcionales
B.
Un marco subconsciente
C.
Ingeniera gentica que duplica exactamente un organismo
D.
Trece secuencias de ADN que todos los humanos portamos
MI.
Rasgos que estn influenciados por ms de un gen.
F.
Gemelos idnticos
GRAMO.
Una clula que resulta de la fertilizacin in vitro.
h
Mellizos
I.
Hacer ARNm a partir de ADN
j
Rasgos que involucran las acciones de muchos genes pero tambin interactan con el medio
ambiente.
k
Utiliza ribosa como azcar en el nucletido.
l
Una clula indiferenciada que an no ha sido programada y puede convertirse en cualquier tipo de
clula
METRO.
Rasgos que tienen mucha variacin en una poblacin
NORTE.
Un cambio en la secuencia de ADN..
The Indian economy is classified into different sectors to simplify the analysis and understanding of economic activities. For Class 10, it's essential to grasp the sectors of the Indian economy, understand their characteristics, and recognize their importance. This guide will provide detailed notes on the Sectors of the Indian Economy Class 10, using specific long-tail keywords to enhance comprehension.
For more information, visit-www.vavaclasses.com
Ethnobotany and Ethnopharmacology:
Ethnobotany in herbal drug evaluation,
Impact of Ethnobotany in traditional medicine,
New development in herbals,
Bio-prospecting tools for drug discovery,
Role of Ethnopharmacology in drug evaluation,
Reverse Pharmacology.
Students, digital devices and success - Andreas Schleicher - 27 May 2024..pptxEduSkills OECD
Andreas Schleicher presents at the OECD webinar ‘Digital devices in schools: detrimental distraction or secret to success?’ on 27 May 2024. The presentation was based on findings from PISA 2022 results and the webinar helped launch the PISA in Focus ‘Managing screen time: How to protect and equip students against distraction’ https://www.oecd-ilibrary.org/education/managing-screen-time_7c225af4-en and the OECD Education Policy Perspective ‘Students, digital devices and success’ can be found here - https://oe.cd/il/5yV
How to Split Bills in the Odoo 17 POS ModuleCeline George
Bills have a main role in point of sale procedure. It will help to track sales, handling payments and giving receipts to customers. Bill splitting also has an important role in POS. For example, If some friends come together for dinner and if they want to divide the bill then it is possible by POS bill splitting. This slide will show how to split bills in odoo 17 POS.
Operation “Blue Star” is the only event in the history of Independent India where the state went into war with its own people. Even after about 40 years it is not clear if it was culmination of states anger over people of the region, a political game of power or start of dictatorial chapter in the democratic setup.
The people of Punjab felt alienated from main stream due to denial of their just demands during a long democratic struggle since independence. As it happen all over the word, it led to militant struggle with great loss of lives of military, police and civilian personnel. Killing of Indira Gandhi and massacre of innocent Sikhs in Delhi and other India cities was also associated with this movement.
The French Revolution, which began in 1789, was a period of radical social and political upheaval in France. It marked the decline of absolute monarchies, the rise of secular and democratic republics, and the eventual rise of Napoleon Bonaparte. This revolutionary period is crucial in understanding the transition from feudalism to modernity in Europe.
For more information, visit-www.vavaclasses.com
Unit 8 - Information and Communication Technology (Paper I).pdfThiyagu K
This slides describes the basic concepts of ICT, basics of Email, Emerging Technology and Digital Initiatives in Education. This presentations aligns with the UGC Paper I syllabus.
This is a presentation by Dada Robert in a Your Skill Boost masterclass organised by the Excellence Foundation for South Sudan (EFSS) on Saturday, the 25th and Sunday, the 26th of May 2024.
He discussed the concept of quality improvement, emphasizing its applicability to various aspects of life, including personal, project, and program improvements. He defined quality as doing the right thing at the right time in the right way to achieve the best possible results and discussed the concept of the "gap" between what we know and what we do, and how this gap represents the areas we need to improve. He explained the scientific approach to quality improvement, which involves systematic performance analysis, testing and learning, and implementing change ideas. He also highlighted the importance of client focus and a team approach to quality improvement.
Synthetic Fiber Construction in lab .pptxPavel ( NSTU)
Synthetic fiber production is a fascinating and complex field that blends chemistry, engineering, and environmental science. By understanding these aspects, students can gain a comprehensive view of synthetic fiber production, its impact on society and the environment, and the potential for future innovations. Synthetic fibers play a crucial role in modern society, impacting various aspects of daily life, industry, and the environment. ynthetic fibers are integral to modern life, offering a range of benefits from cost-effectiveness and versatility to innovative applications and performance characteristics. While they pose environmental challenges, ongoing research and development aim to create more sustainable and eco-friendly alternatives. Understanding the importance of synthetic fibers helps in appreciating their role in the economy, industry, and daily life, while also emphasizing the need for sustainable practices and innovation.
Need help with formulas Begin this exercise by opening the .pdf
1. Need help with formulas
Begin this exercise by opening the file named Chapter 3 CiP Exercise 1 or continue with this file if
you completed the comprehensive review part A.
1.Click cell C3 on the Summary Report worksheet. This column will be used to count the stores
for each region of the company. Begin the function by clicking the Formulas tab on the Ribbon.
Click the More Functions button, click the Statistical option, and then click the COUNTIF function
from the list. Define the arguments in the Function Arguments dialog box as follows:
Range: Click the Collapse Dialog button next to the Range argument, click the Sales by Store
worksheet tab, and highlight the range A3:A26. Press the ENTER key on your keyboard. Click in
the input box for the Range argument and place an absolute reference on the range. Press the
TAB key on your keyboard to advance to the next argument.
Criteria: Type cell A3. Complete the function by clicking the OK button at the bottom of the
Function Arguments dialog box.
2.Copy and paste the COUNTIF function in cell C3 by double clicking the Auto Fill Handle. The
function will show the number of stores for each region.
3.Click cell D3 on the Summary Report worksheet. This column will be used to sum the current
sales by region. Begin the function by clicking the Formulas tab on the Ribbon. Click the Math &
Trig button and select the SUMIF function from the list. Define the arguments in the Function
Arguments dialog box as follows:
Range: Click the Collapse Dialog button next to the Range argument, click the Sales by Store
worksheet tab, and highlight the range A3:A26. Press the ENTER key on your keyboard. Click in
the input box for the Range argument and place an absolute reference on the range. Press the
TAB key on your keyboard to advance to the next argument.
Criteria: Type cell A3. Press the TAB key on your keyboard to advance to the next argument.
Sum_range: Click the Collapse Dialog button next to the Sum_range argument, click the Sales
by Store worksheet tab, and highlight the range I3:I26. Press the ENTER key on your keyboard.
Click in the input box for the Sum_range argument and place an absolute reference on the range.
Complete the function by clicking the OK button at the bottom of the Function Arguments dialog
box.
4. Copy and paste the SUMIF function in cell D3 by double clicking the Auto Fill Handle. The
function will show the total sales this year for each region.
5. Click cell E3 on the Summary Report worksheet. This column will be used to sum the sales
last year by region. Enter a SUMIF function and define the arguments exactly as stated in step 3.
However, define the Sum_range argument with the range H3:H26 on the Sales by Store
worksheet. Remember to put an absolute reference on this range before completing the function.
6.Copy and paste the SUMIF function in cell E3 by double clicking the Auto Fill Handle. The
function will show the total sales last year for each region.
7. Enter a formula in cell F3 on the Summary Report worksheet to calculate the percent change
in sales for each region. Your formula should first subtract the Sales Last Year in cell E3 from the
Sales This Year in cell D3. Then divide this result by the Sales Last Year in cell E3.
8. Copy and paste the formula in cell F3 by double clicking the Auto Fill Handle.
9. Click cell C11 on the Summary Report worksheet. This column will be used to count the
2. number of stores by size for the region number typed into cell B9. Begin the function by clicking
the Formulas tab on the Ribbon. Click the More Functions button, click the Statistical option, and
select the COUNTIFS function from the list. Define the arguments in the Function Arguments
dialog box as follows:
Criteria_range1: Click the Collapse Dialog button next to the Criteria_range1 argument, click the
Sales by Store worksheet tab, and highlight the range A3:A26. Press the ENTER key on your
keyboard. Click in the input box for the Criteria_range1argument and place an absolute reference
on the range. Press the TAB key on your keyboard to advance to the next argument.
Criteria1: Type cell B9. Place an absolute reference on this cell location. Press the TAB key on
your keyboard to advance to the next argument.
Criteria_range2: Click the Collapse Dialog button next to the Criteria_range2 argument, click the
Sales by Store worksheet tab, and highlight the range F3:F26. Press the ENTER key on your
keyboard. Click in the input box for the Criteria_range2argument and place an absolute reference
on the range. Press the TAB key on your keyboard to advance to the next argument.
Criteria2: Type cell B11. Complete the function by clicking the OK button at the bottom of the
Function Arguments dialog box.
10. Copy the COUNTIFS function in cell C11 and paste it into the range C12:C14 using the Paste
Formulas command.
11. Click cell D11 on the Summary Report worksheet. This column will be used to sum the
current sales by store size for the region number typed into cell B9. Begin the function by clicking
the Formulas tab on the Ribbon. Click the Math & Trig button and select the SUMIFS function from
the list. Define the arguments in the Function Arguments dialog box as follows:
Sum_range: Click the Collapse Dialog button next to the Sum_range argument, click the Sales
by Store worksheet tab, and highlight the range I3:I26. Press the ENTER key on your keyboard.
Click in the input box for the Sum_range argument and place an absolute reference on the range.
Press the TAB key on your keyboard to advance to the next argument.
Criteria_range1: Click the Collapse Dialog button next to the Criteria_range1 argument, click the
Sales by Store worksheet tab, and highlight the range A3:A26. Press the ENTER key on your
keyboard. Click in the input box for the Criteria_range1argument and place an absolute reference
on the range. Press the TAB key on your keyboard to advance to the next argument.
Criteria1: Type cell B9. Place an absolute reference on this cell location. Press the TAB key on
your keyboard to advance to the next argument.
Criteria_range2: Click the Collapse Dialog button next to the Criteria_range2 argument, click the
Sales by Store worksheet tab, and highlight the range F3:F26. Press the ENTER key on your
keyboard. Click in the input box for the Criteria_range2argument and place an absolute reference
on the range. Press the TAB key on your keyboard to advance to the next argument.
Criteria2: Type cell B11. Complete the function by clicking the OK button at the bottom of the
Function Arguments dialog box.
12. Copy the SUMIFS function in cell D11 and paste it into the range D12:D14 using the Paste
Formulas command.
13. Click cell E11 on the Summary Report worksheet. This column will be used to sum the sales
last year by store size for the region number typed into cell B9. Enter a SUMIFS function into this
3. cell location and define the arguments exactly as stated for step 11. However, define the
Sum_range argument with the range H3:H26. Remember to place an absolute reference on this
range.
14. Copy the SUMIFS function in cell E11 and paste it into the range E12:E14 using the Paste
Formulas command.
15. Enter a formula in cell F11 on the Summary Report worksheet to calculate the percent
change in sales for each store size. Your formula should first subtract the Sales Last Year in cell
E11 from the Sales This Year in cell D11. Then divide this result by the Sales Last Year in cell
E11.
16. Copy the formula in cell F11 and paste it into the range F12:F14 using the Paste Formulas
command.
17. Place a conditional format on the range F11:F14 to show any negative numbers in red. Begin
by highlighting the range F11:F14 on the Summary Report worksheet. Click the Conditional
Formatting button in the Home tab of the Ribbon and select the New Rule option from the drop-
down list. Click the Format only cells that contain option from the New Formatting Rule dialog box.
Change the comparison operator box from between to less than. Click in the input box next to the
comparison operator box and type a 0. Click the Format button and change the text color to red.
Complete the command by clicking the OK button in the Format Cells dialog box and in the new
New Formatting Rule dialog box.
18. Click cell G3 on the Summary Report worksheet. The purpose of this column is to show the
sales growth target for each region. The sales growth targets can be found in the Region Plan
worksheet. An HLOOKUP function will be used to display the sales growth plan for each region.
Begin the function by clicking the Formulas tab of the Ribbon. Then click the Lookup & Reference
button and select the HLOOKUP function from the list. Define the arguments of the function as
follows:
Lookup_value: Type cell A3 in the input box for this argument. Then press the TAB key on your
keyboard to advance to the next argument.
Table_array: Click the Collapse Dialog button next to the Table_array argument, click the
Region Plan worksheet tab, and highlight the range B2:E5. Press the ENTER key on your
keyboard. Click in the input box for the Table_array argument and place an absolute reference on
the range. Press the TAB key on your keyboard to advance to the next argument.
Row_index_num: Type the number 4 and press the TAB key on your keyboard.
Range_lookup: Type the word FALSE. Complete the function by clicking the OK button at the
bottom of the Function Arguments dialog box.
19. Copy and paste the HLOOKUP function in cell G3 by double clicking the Auto Fill Handle.
20. Enter a formula in cell H3 that subtracts the Sales Growth Target in cell G3 from the Change in
Sales in cell F3 (F3G3). Then copy and paste the formula into the range H4:H6.
21. Click cell C9 on the Summary Report worksheet. The purpose of this cell is to display the
name of the region for the number that is typed into cell B9. This will be accomplished by using a
VLOOKUP function. Begin the function by clicking the Formulas tab of the Ribbon, then click the
Lookup & Reference button and select the VLOOKUP function from the list. Define the arguments
of the function as follows:
4. Lookup_value: Type cell B9 in the input box for this argument and press the TAB key on your
keyboard to advance to the next argument.
Table_array: Click the Collapse Dialog button next to the Table_array argument and highlight the
range A3:B6 on the Summary Report worksheet. Press the ENTER key on your keyboard. Press
the TAB key on your keyboard to advance to the next argument.
Col_index_num: Type the number 2 and press the TAB key on your keyboard.
Range_lookup: Type the word FALSE. Complete the function by clicking the OK button at the
bottom of the Function Arguments dialog box.
22. Looking at the Summary Report worksheet, you will notice that the change in sales for the
West region is 4.77%. Type the number 4 in cell B9 to see the change in sales summarized for
each store size in the region. Examine the sales results by store size for each of the other three
regions. Notice that even if a region is showing an increase in sales over last year, it does not
necessarily mean that all stores in that region are performing well.