NEA1 How to record Data for the non exam assessment
1.
There are manyways to record data.
You should use 2-3 in each
investigation
2.
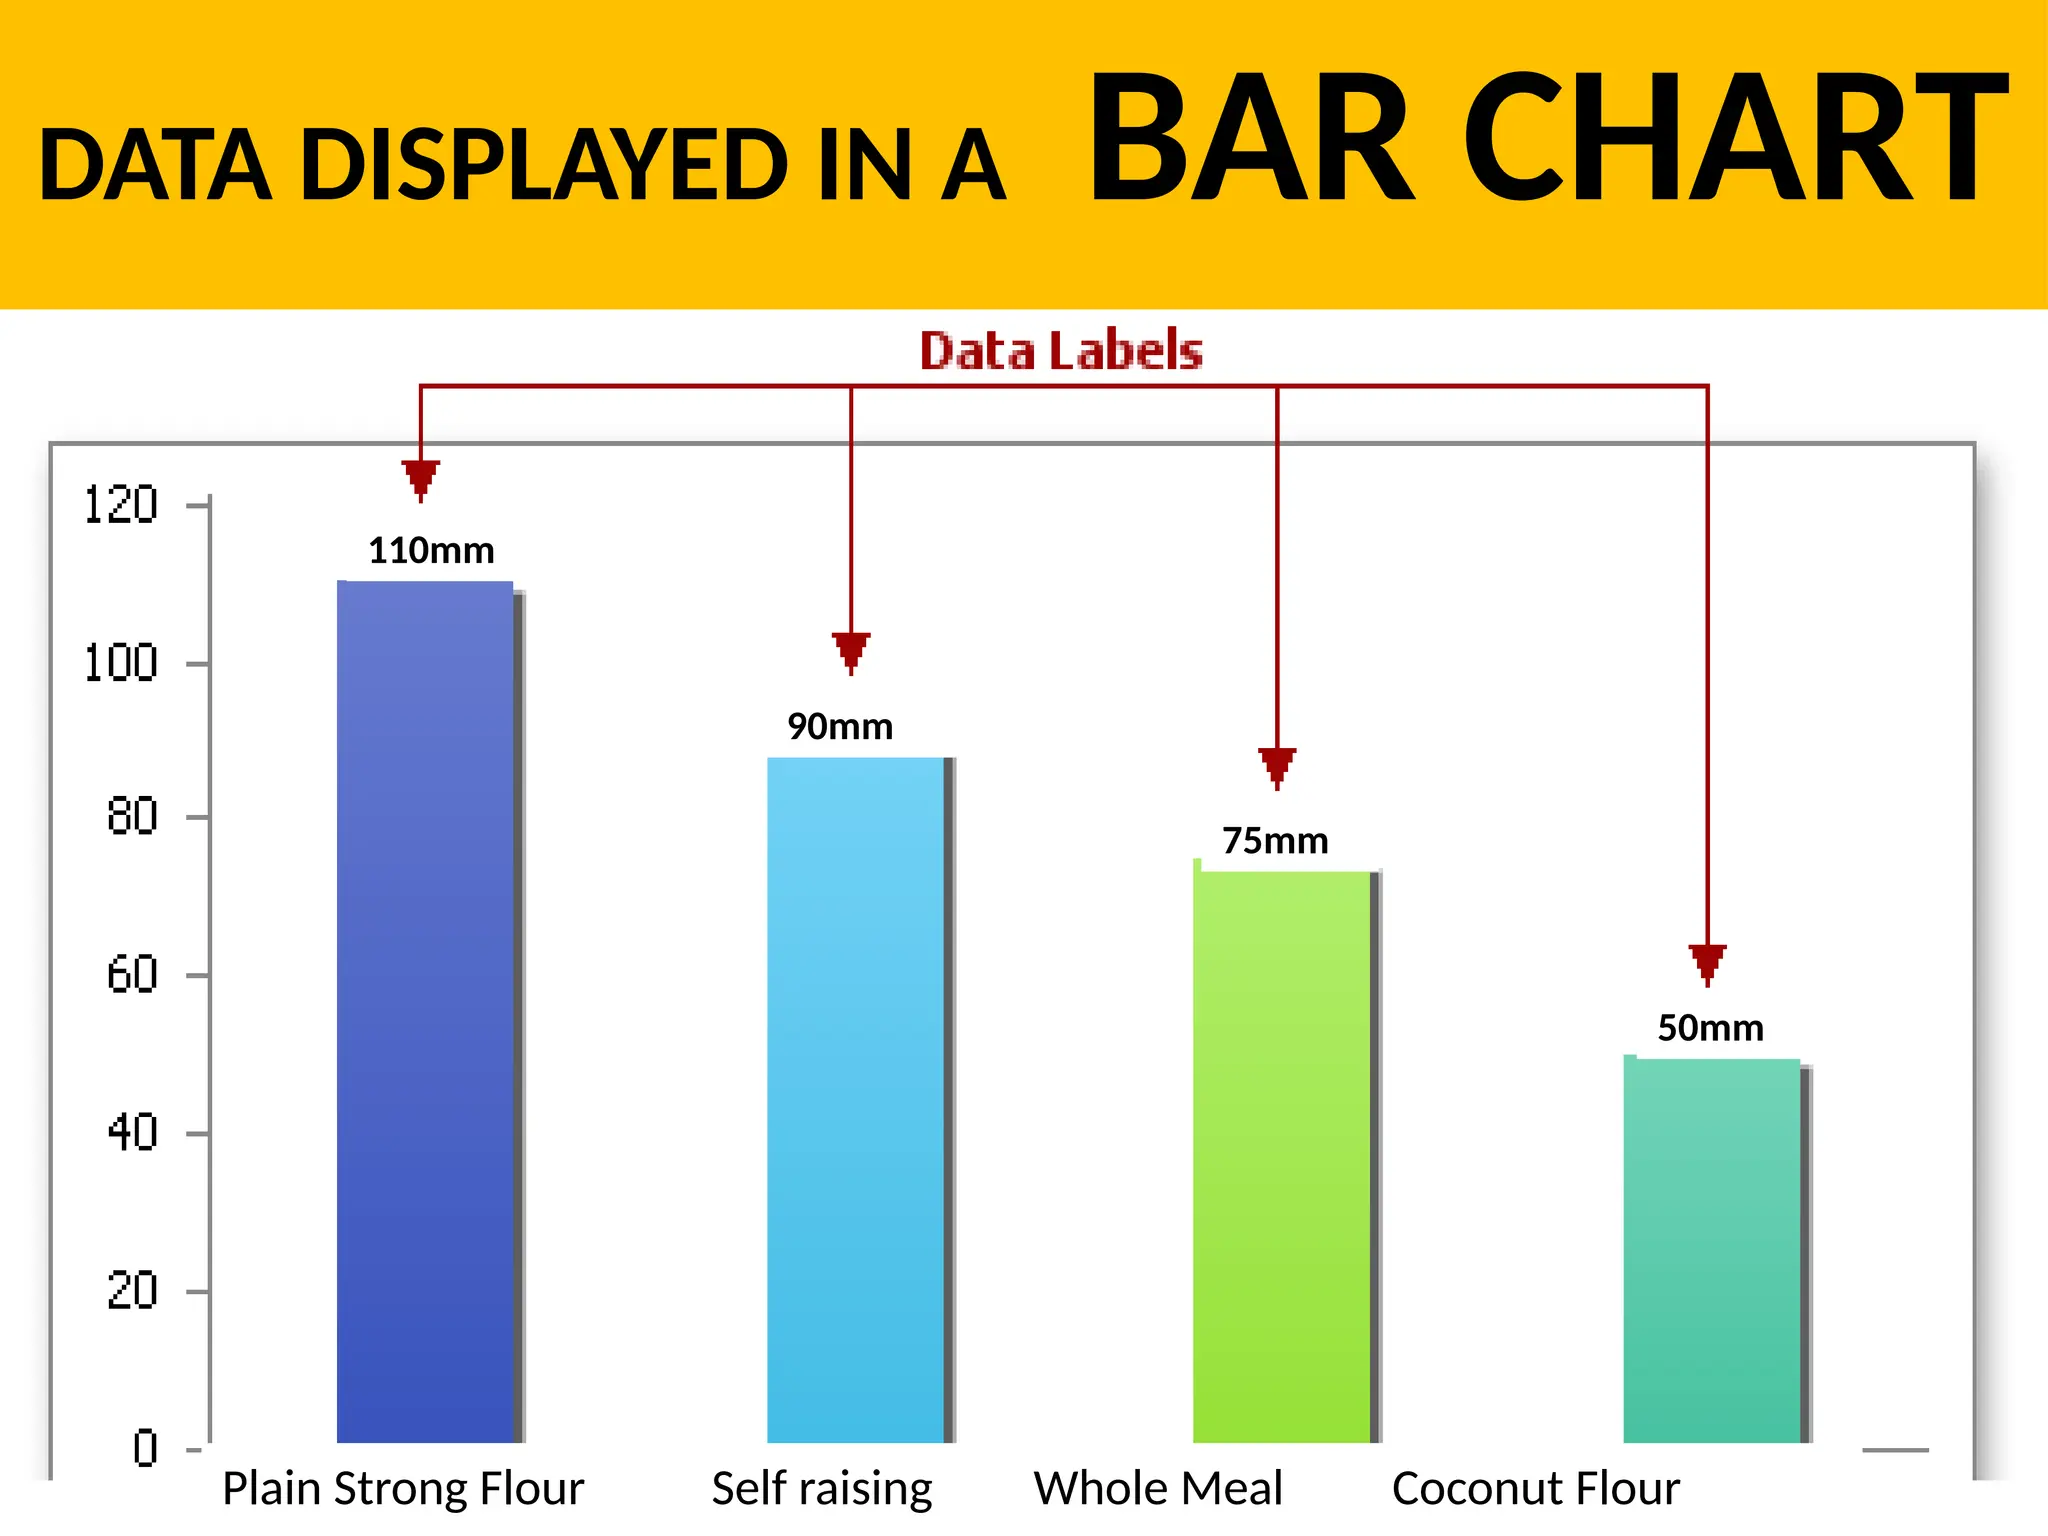
Plain Strong FlourSelf raising Whole Meal Coconut Flour
110mm
90mm
75mm
50mm
DATA DISPLAYED IN A BAR CHART
3.
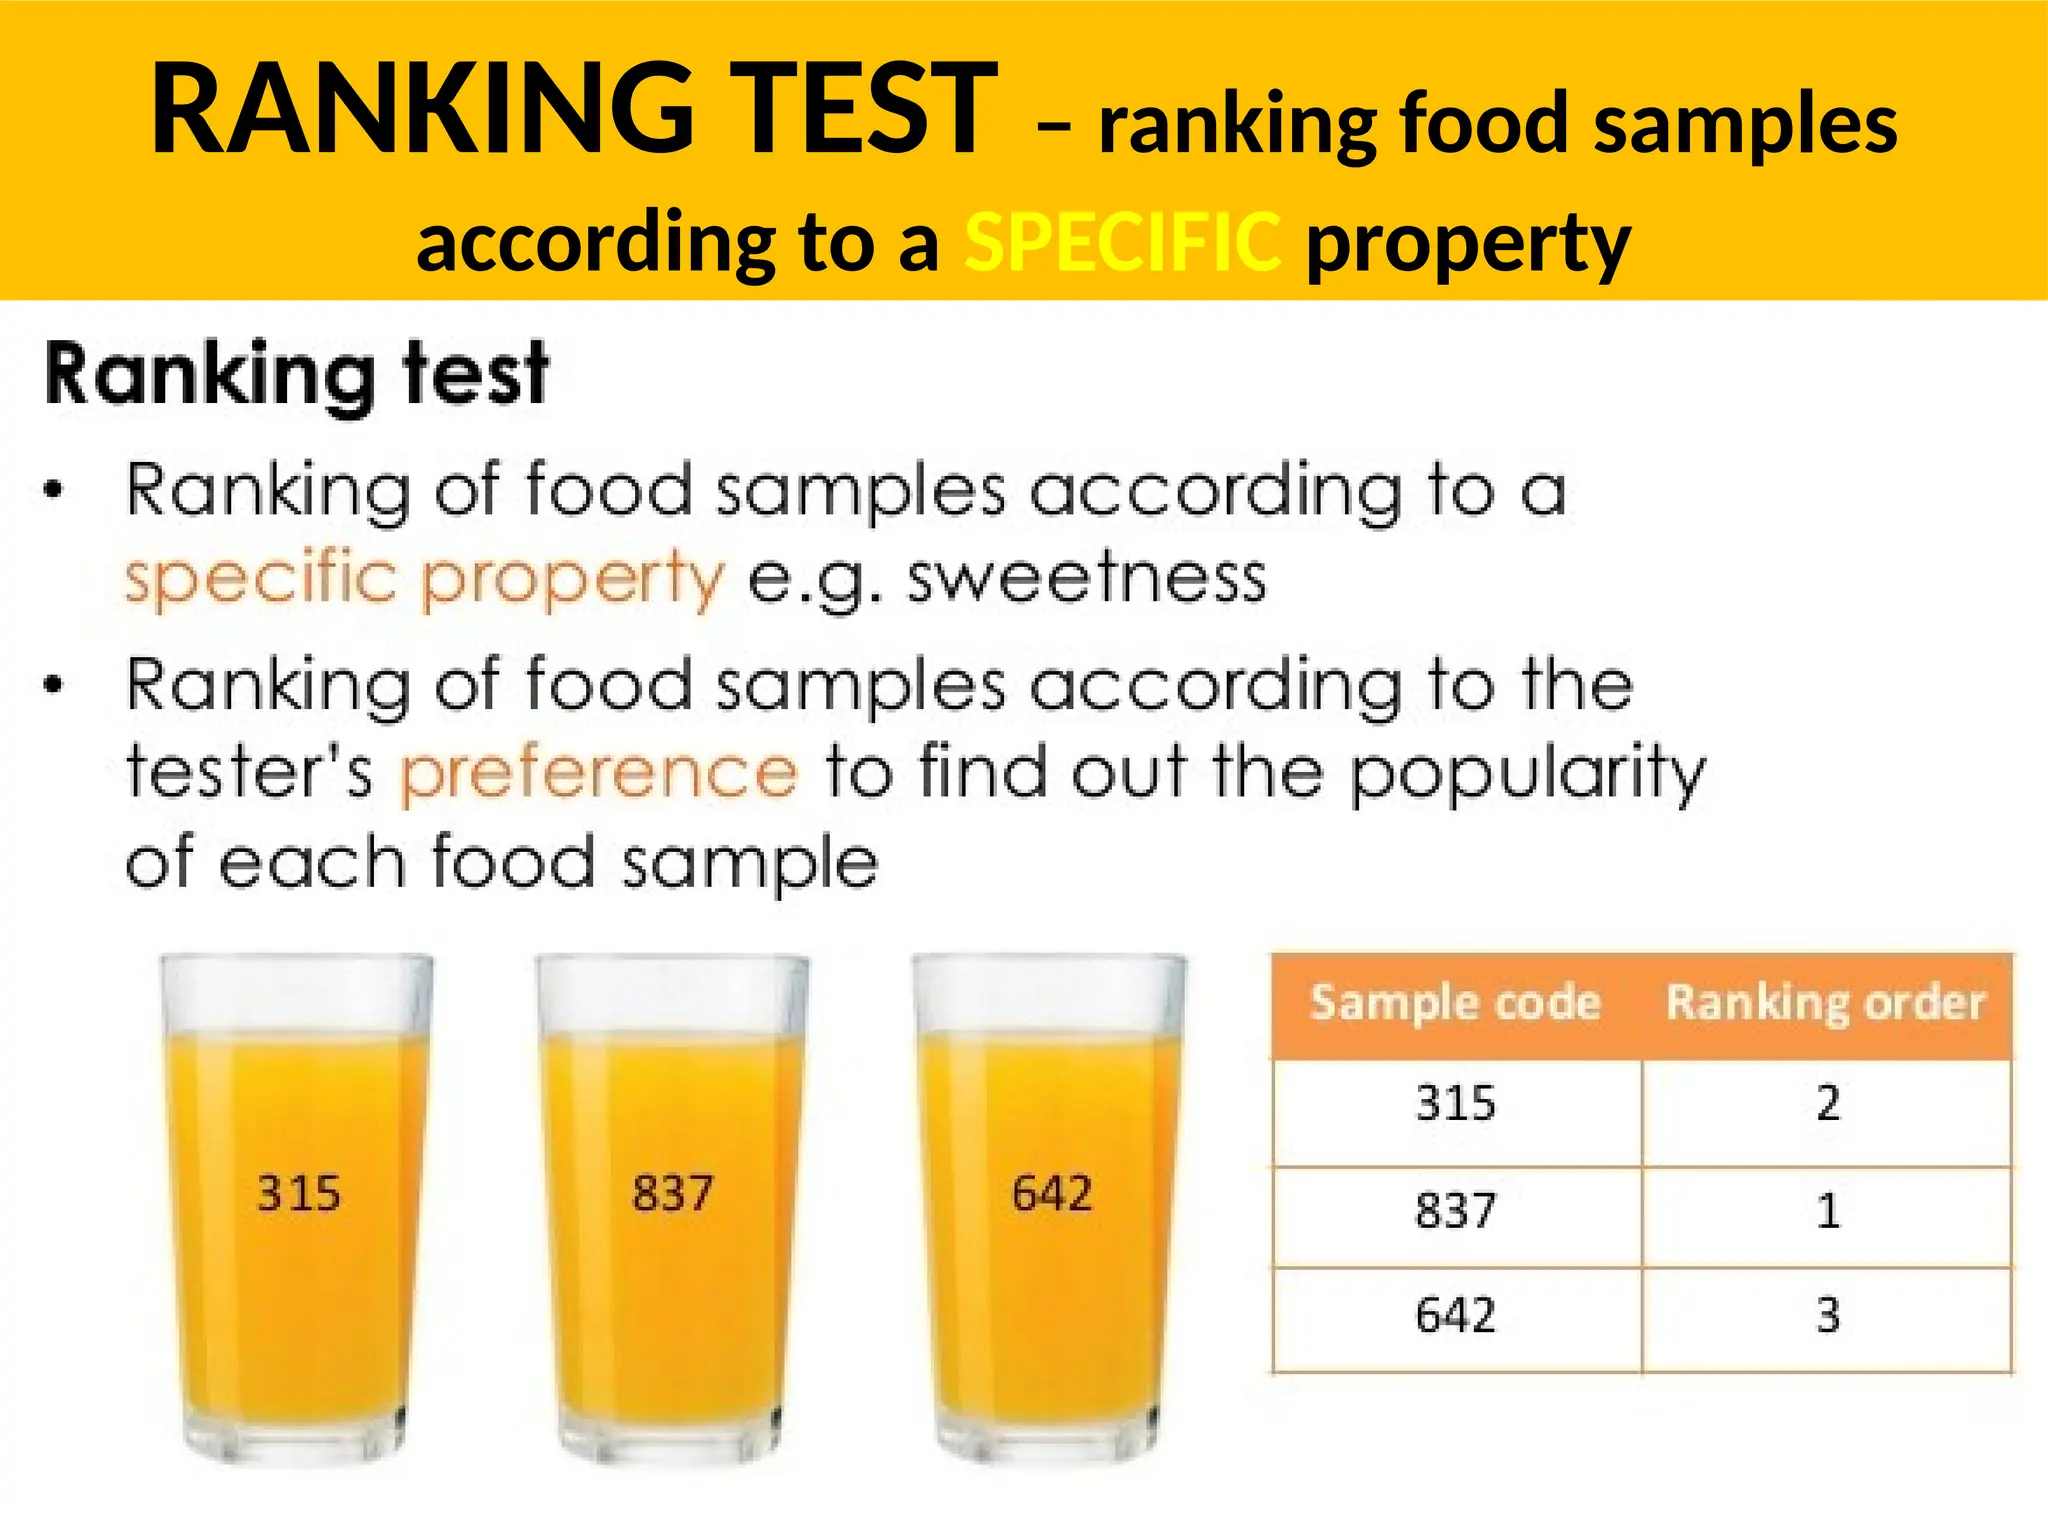
RANKING TEST –ranking food samples
according to a SPECIFIC property
4.
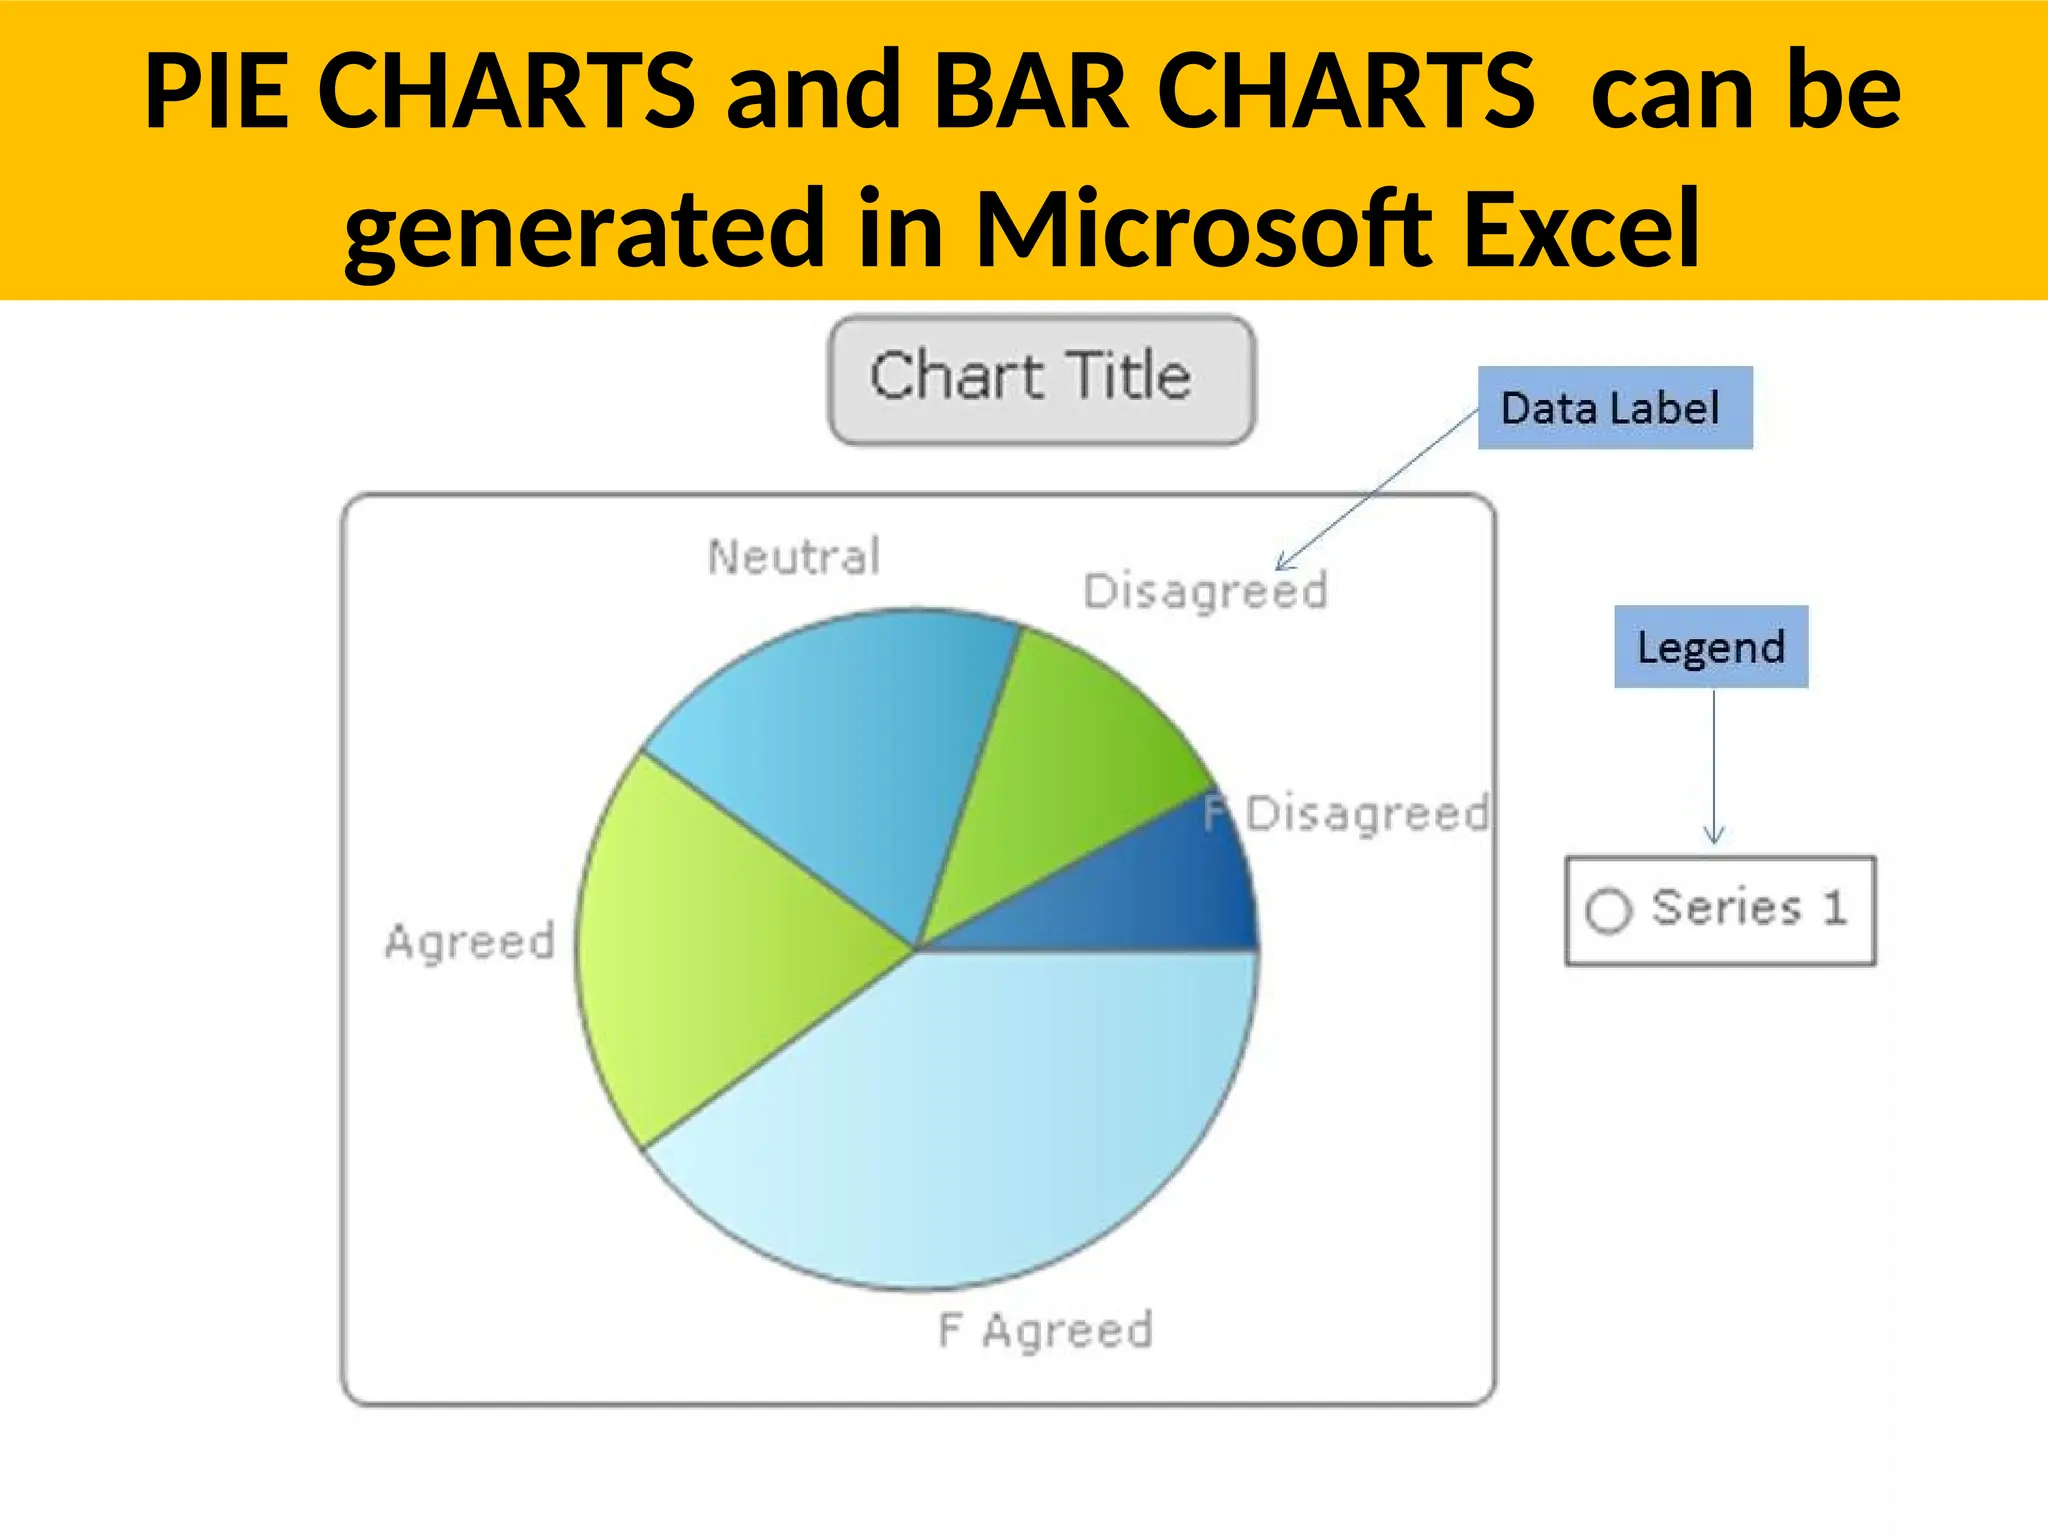
PIE CHARTS andBAR CHARTS can be
generated in Microsoft Excel
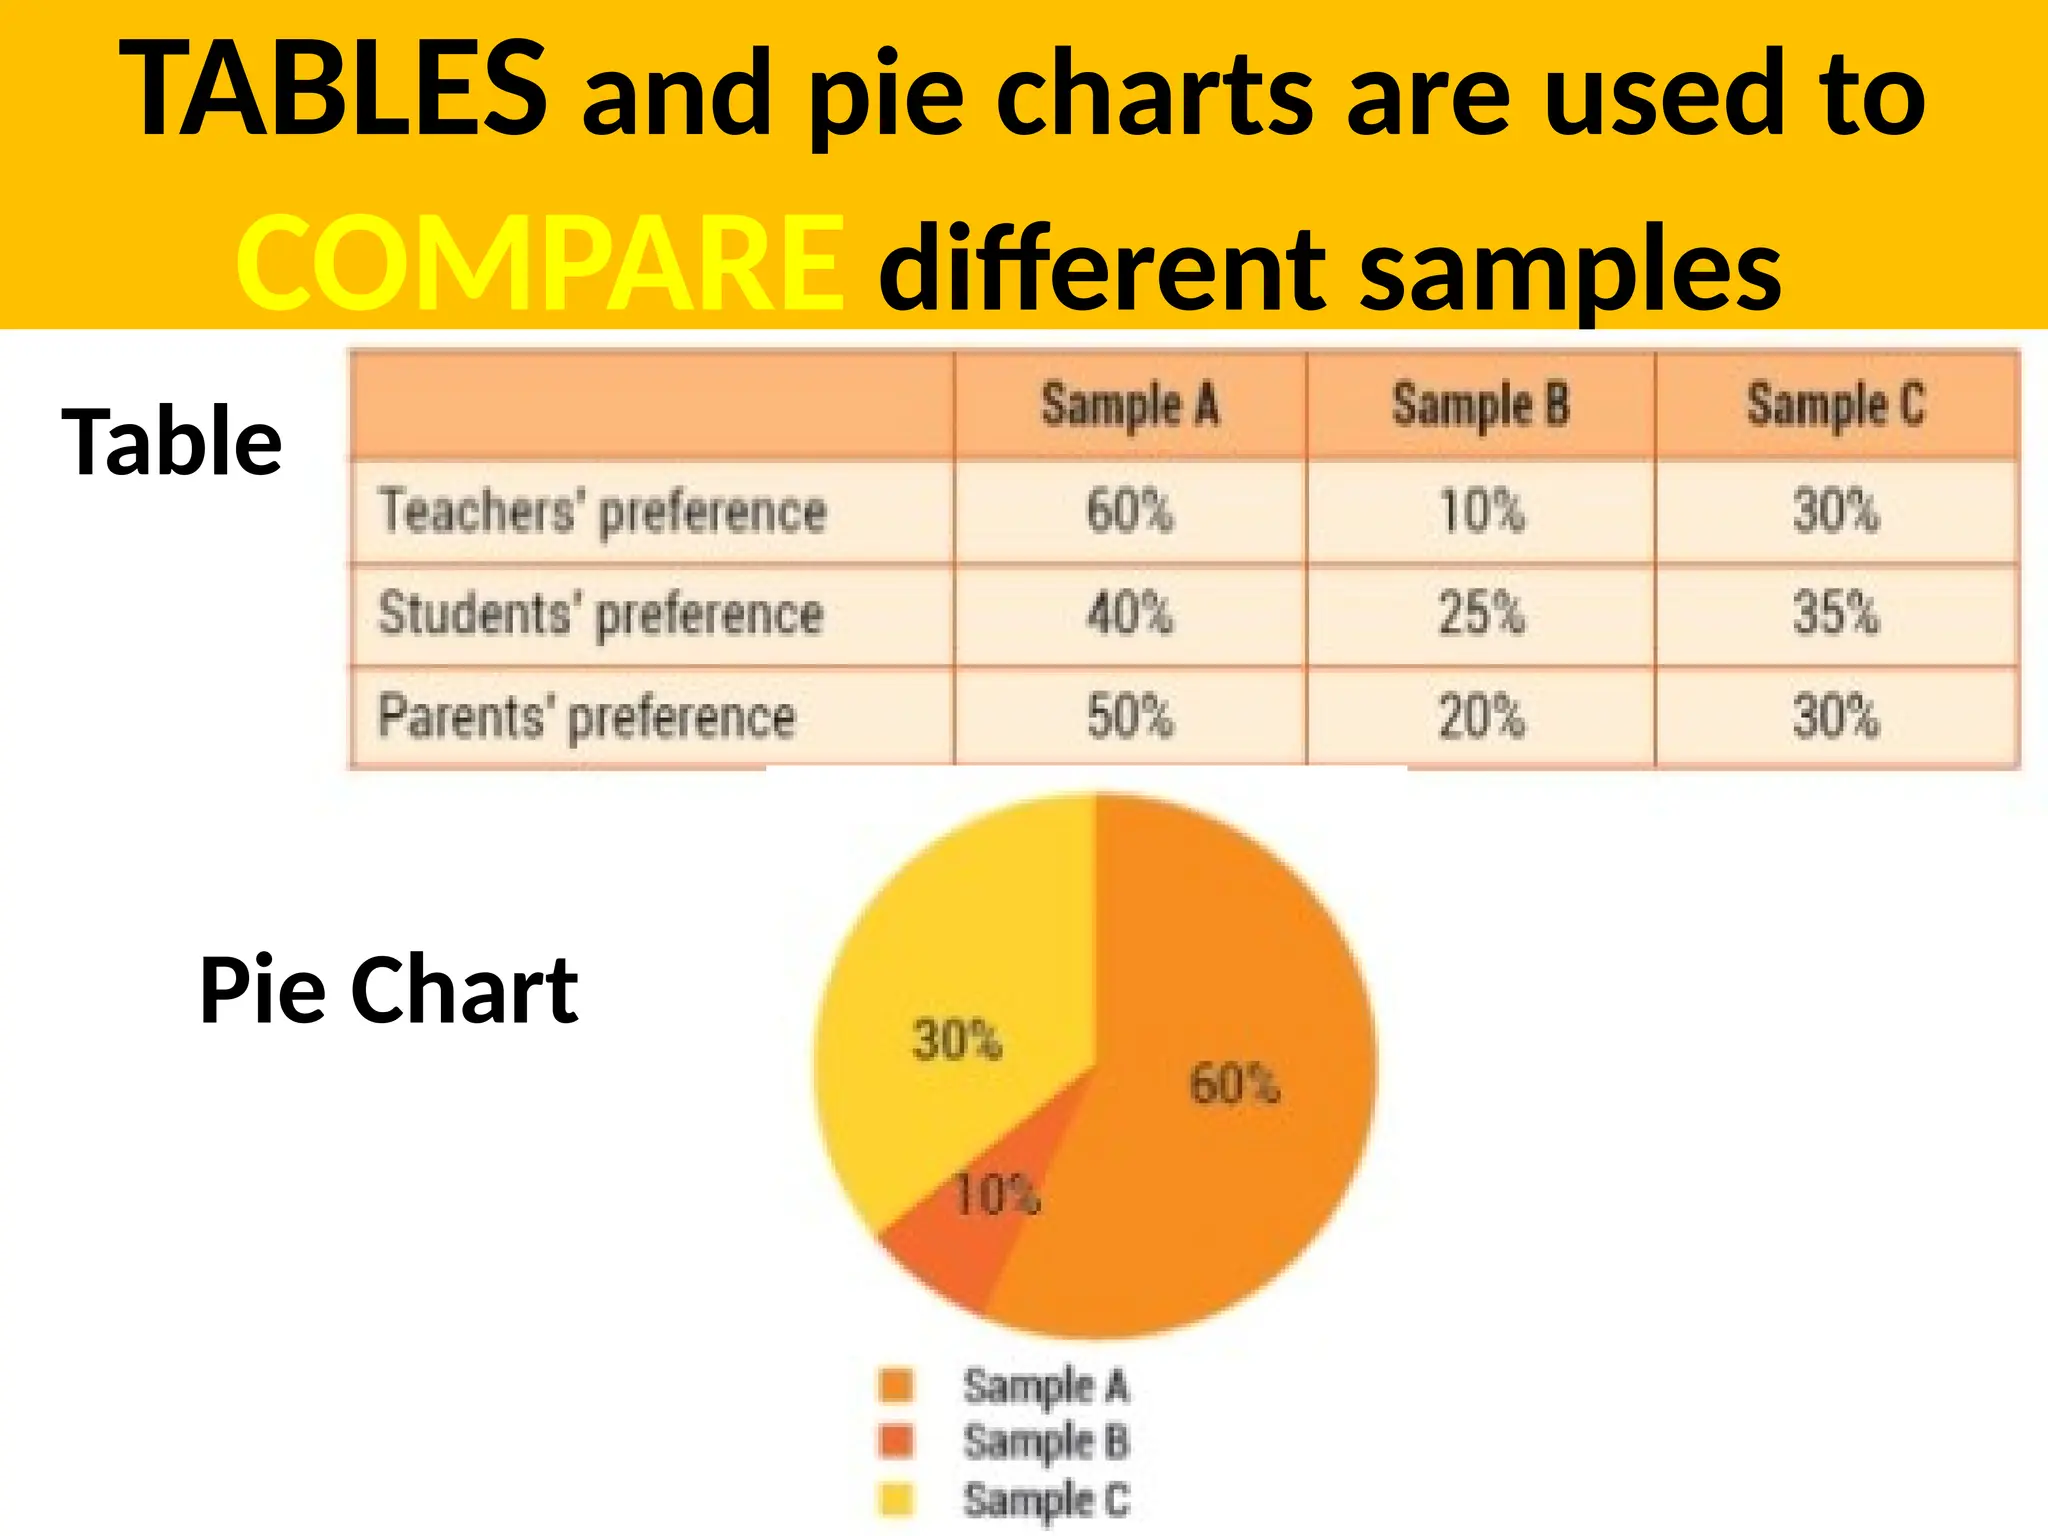
5.
TABLES and piecharts are used to
COMPARE different samples
Table
Pie Chart
6.
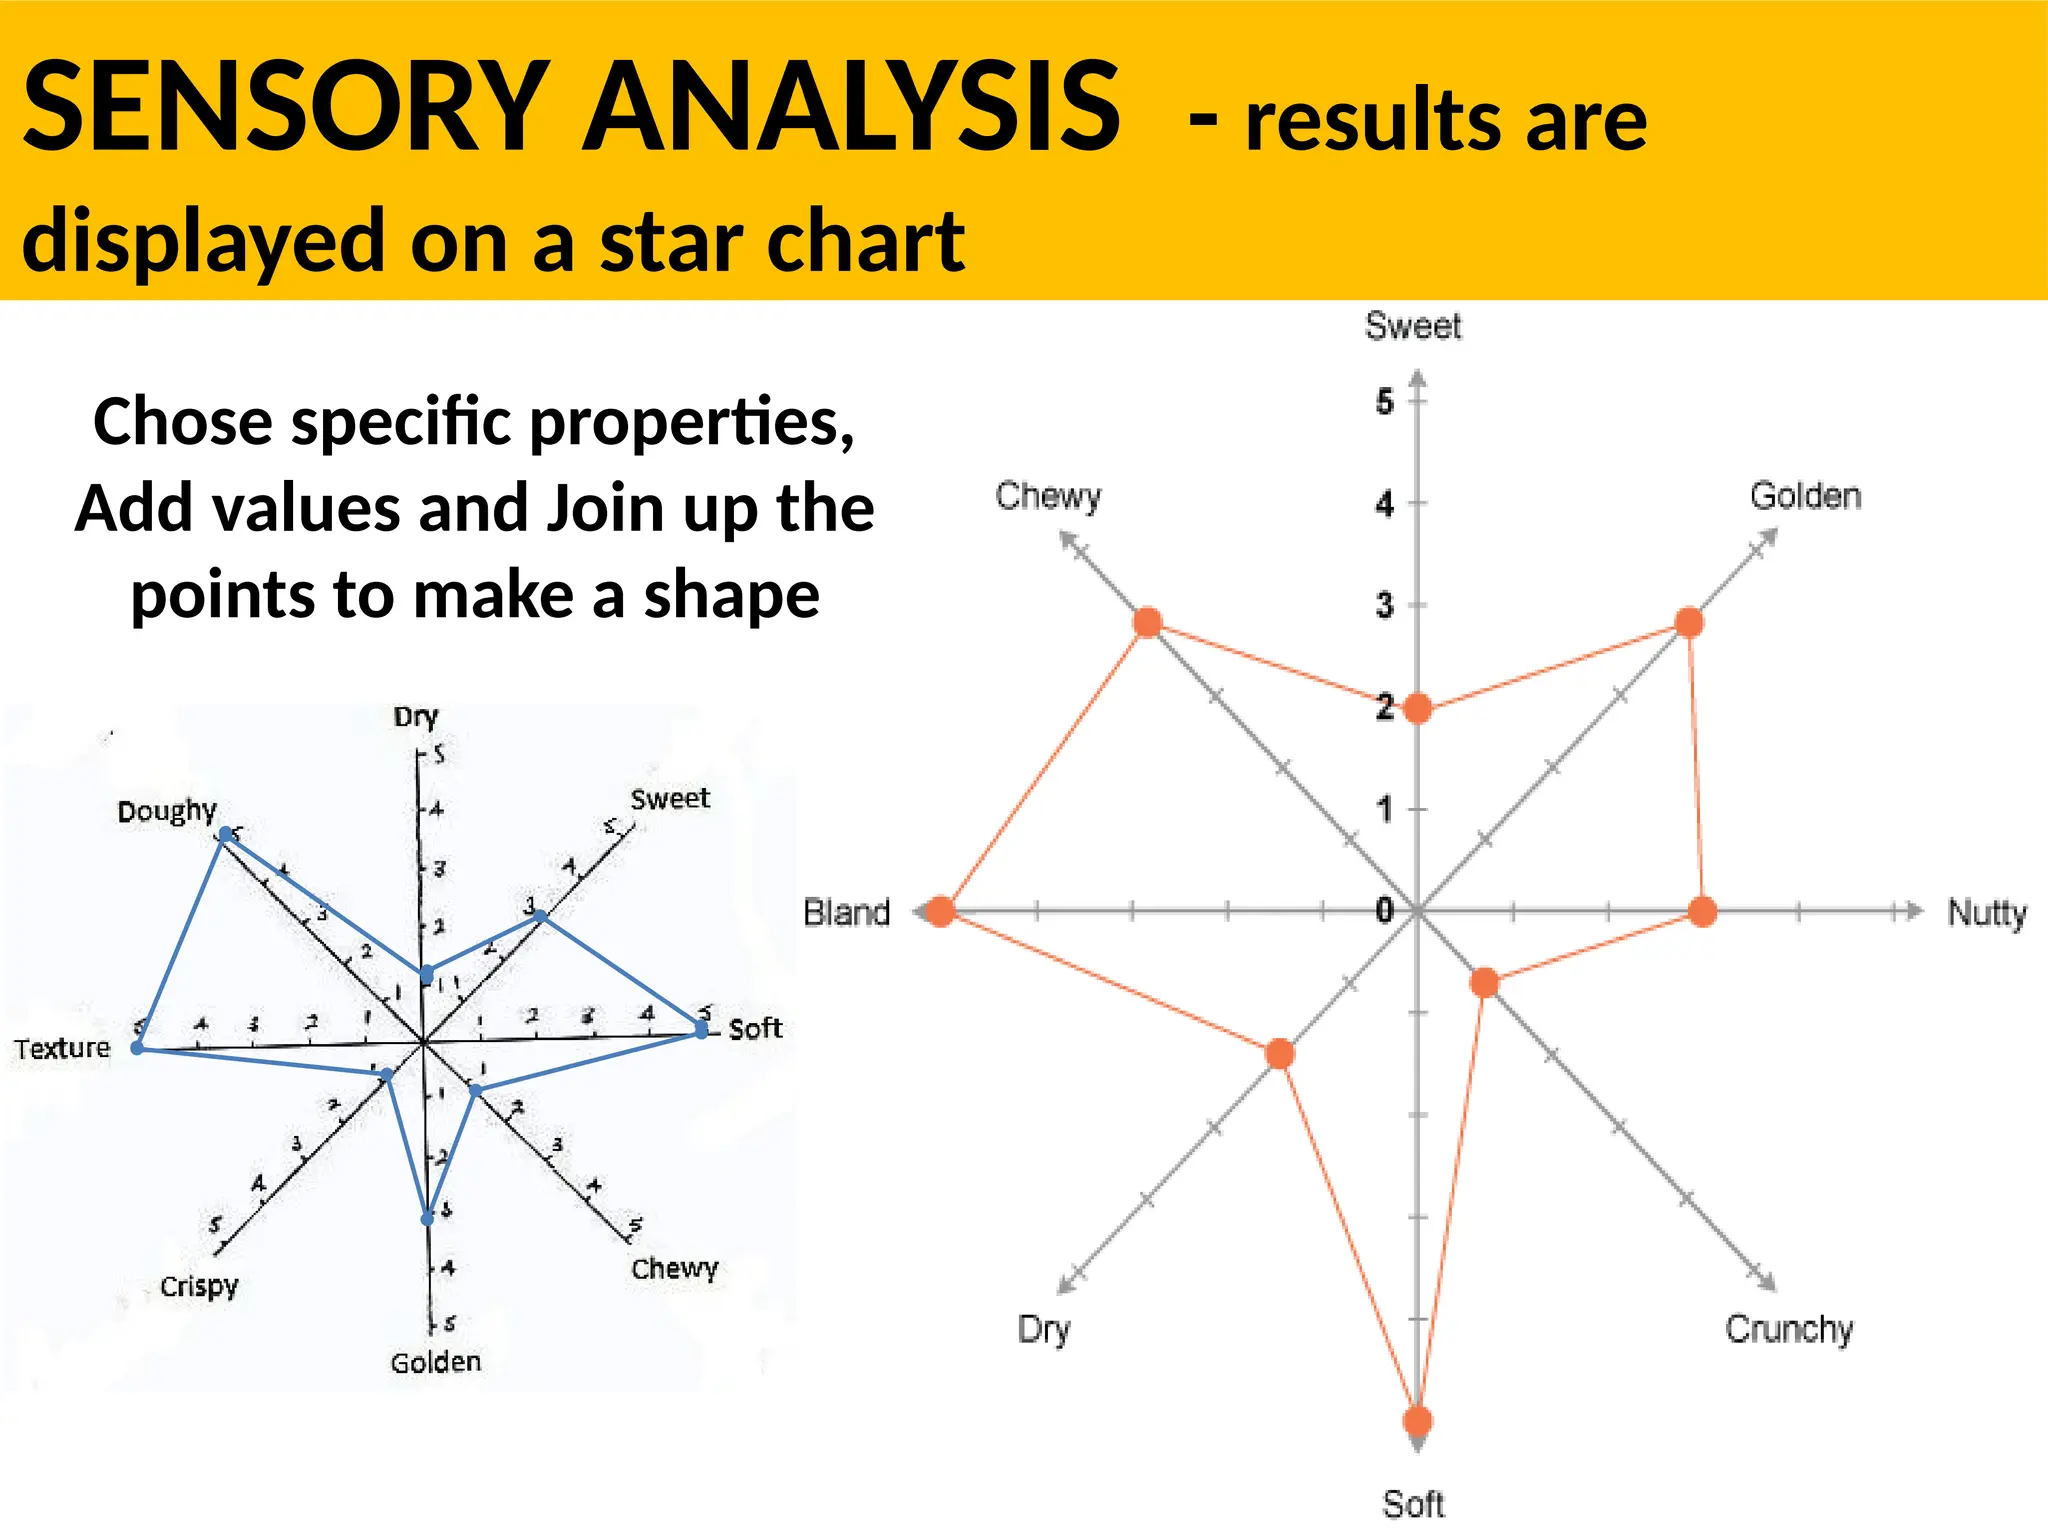
SENSORY ANALYSIS -results are
displayed on a star chart
Chose specific properties,
Add values and Join up the
points to make a shape
7.
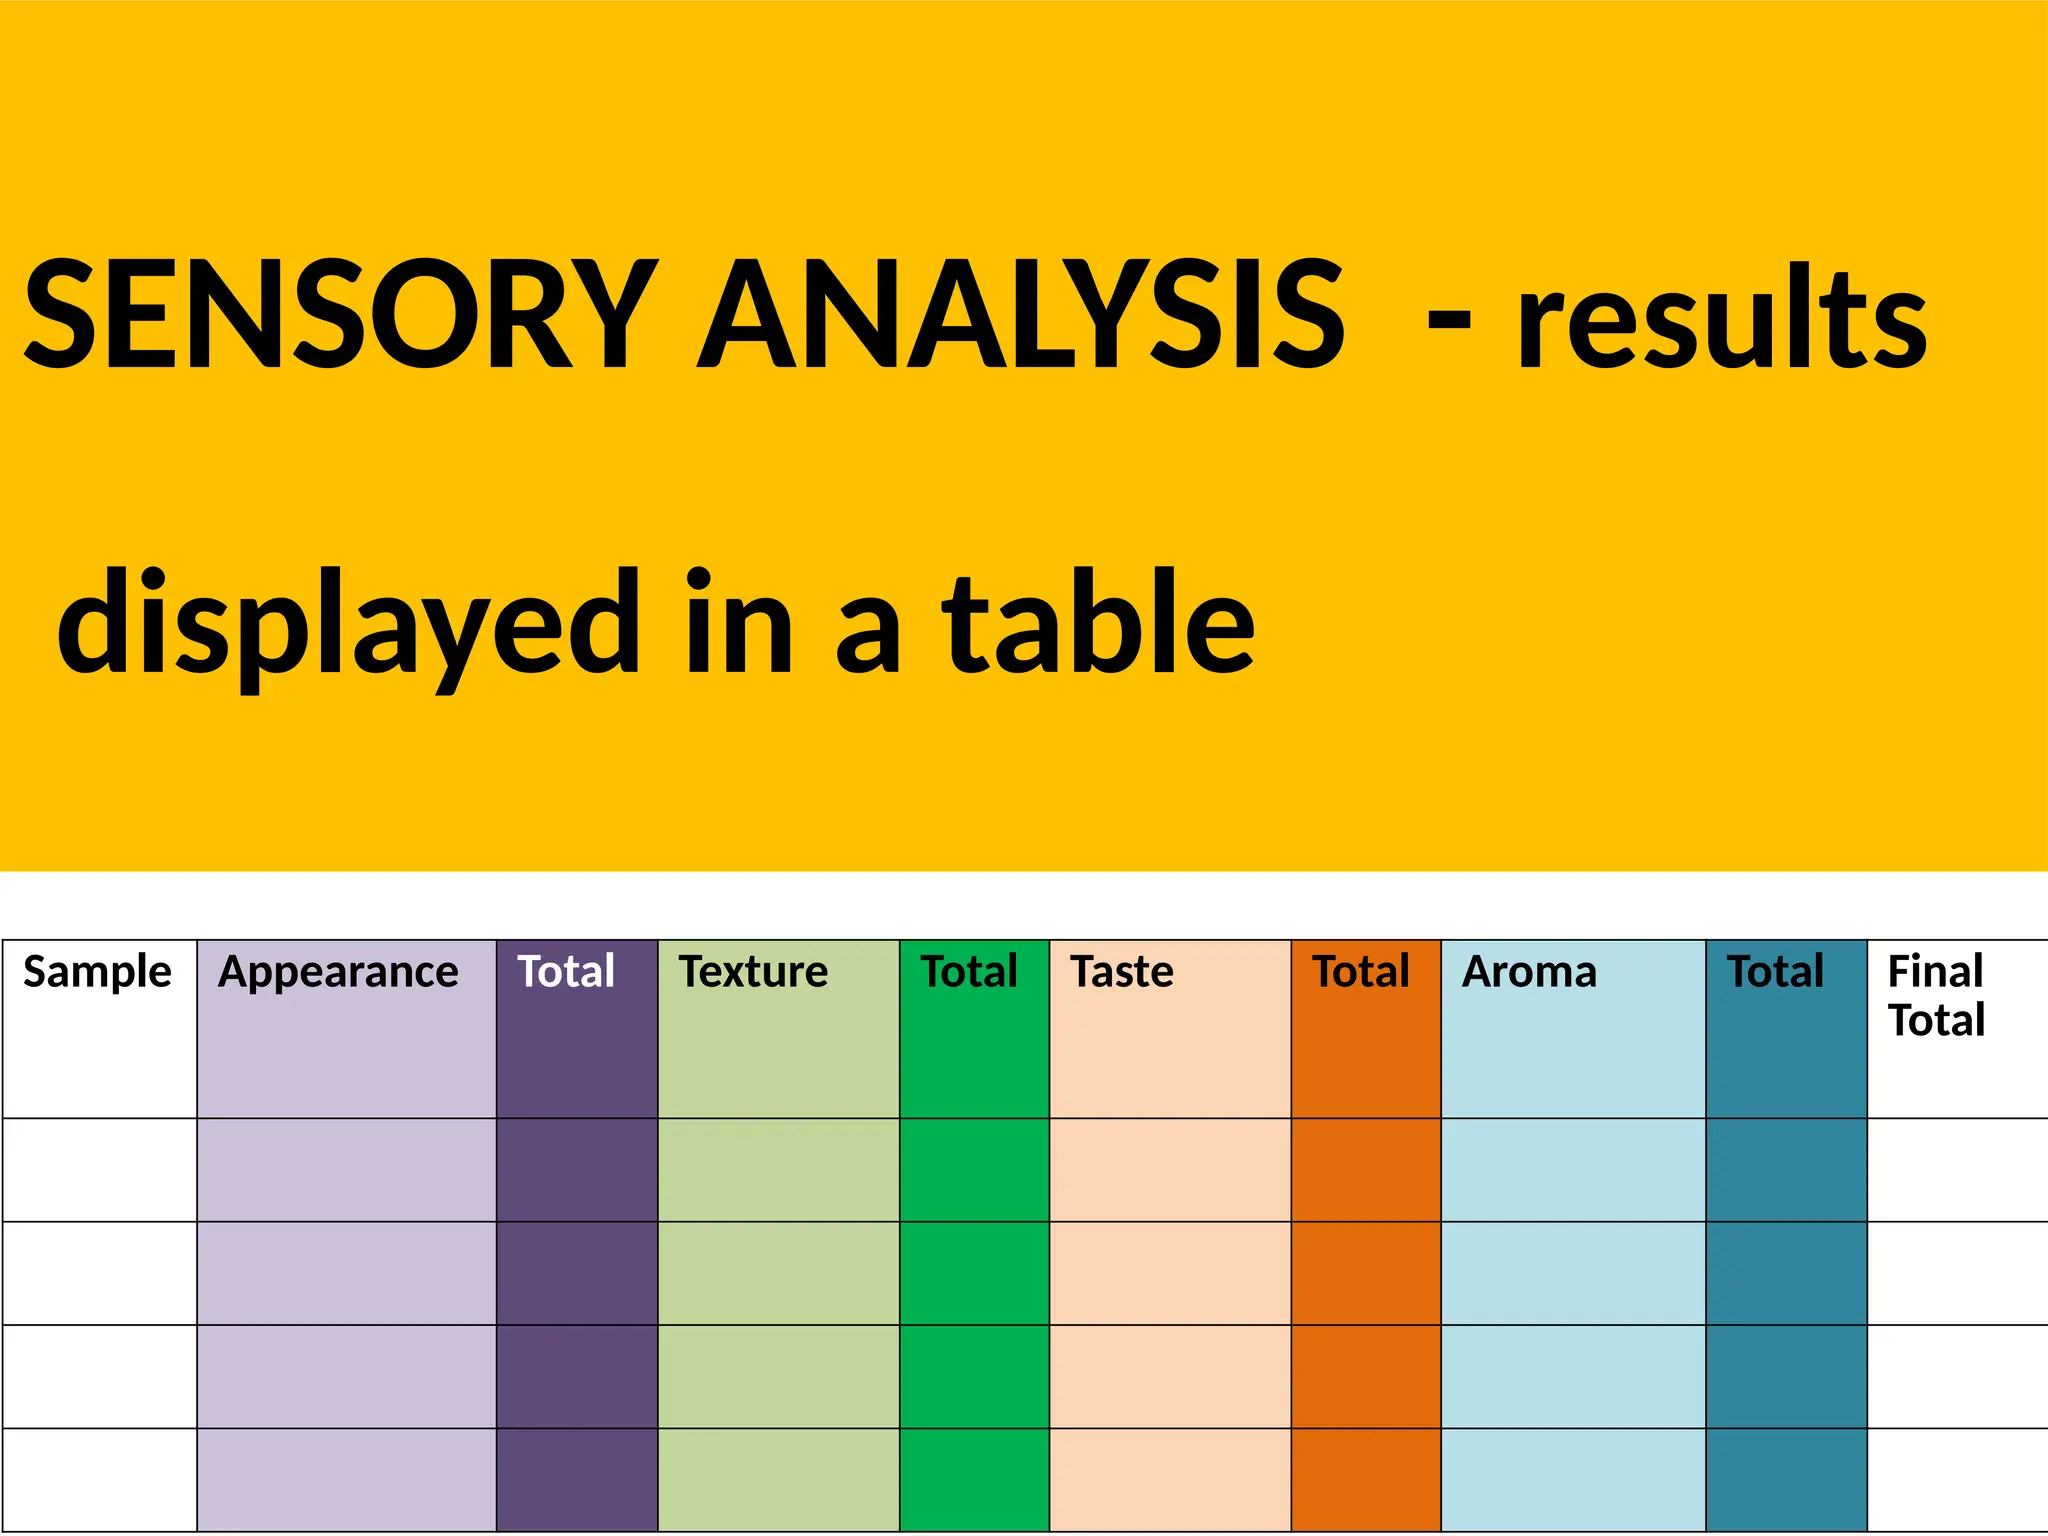
Sample Appearance TotalTexture Total Taste Total Aroma Total Final
Total
SENSORY ANALYSIS - results
displayed in a table
8.
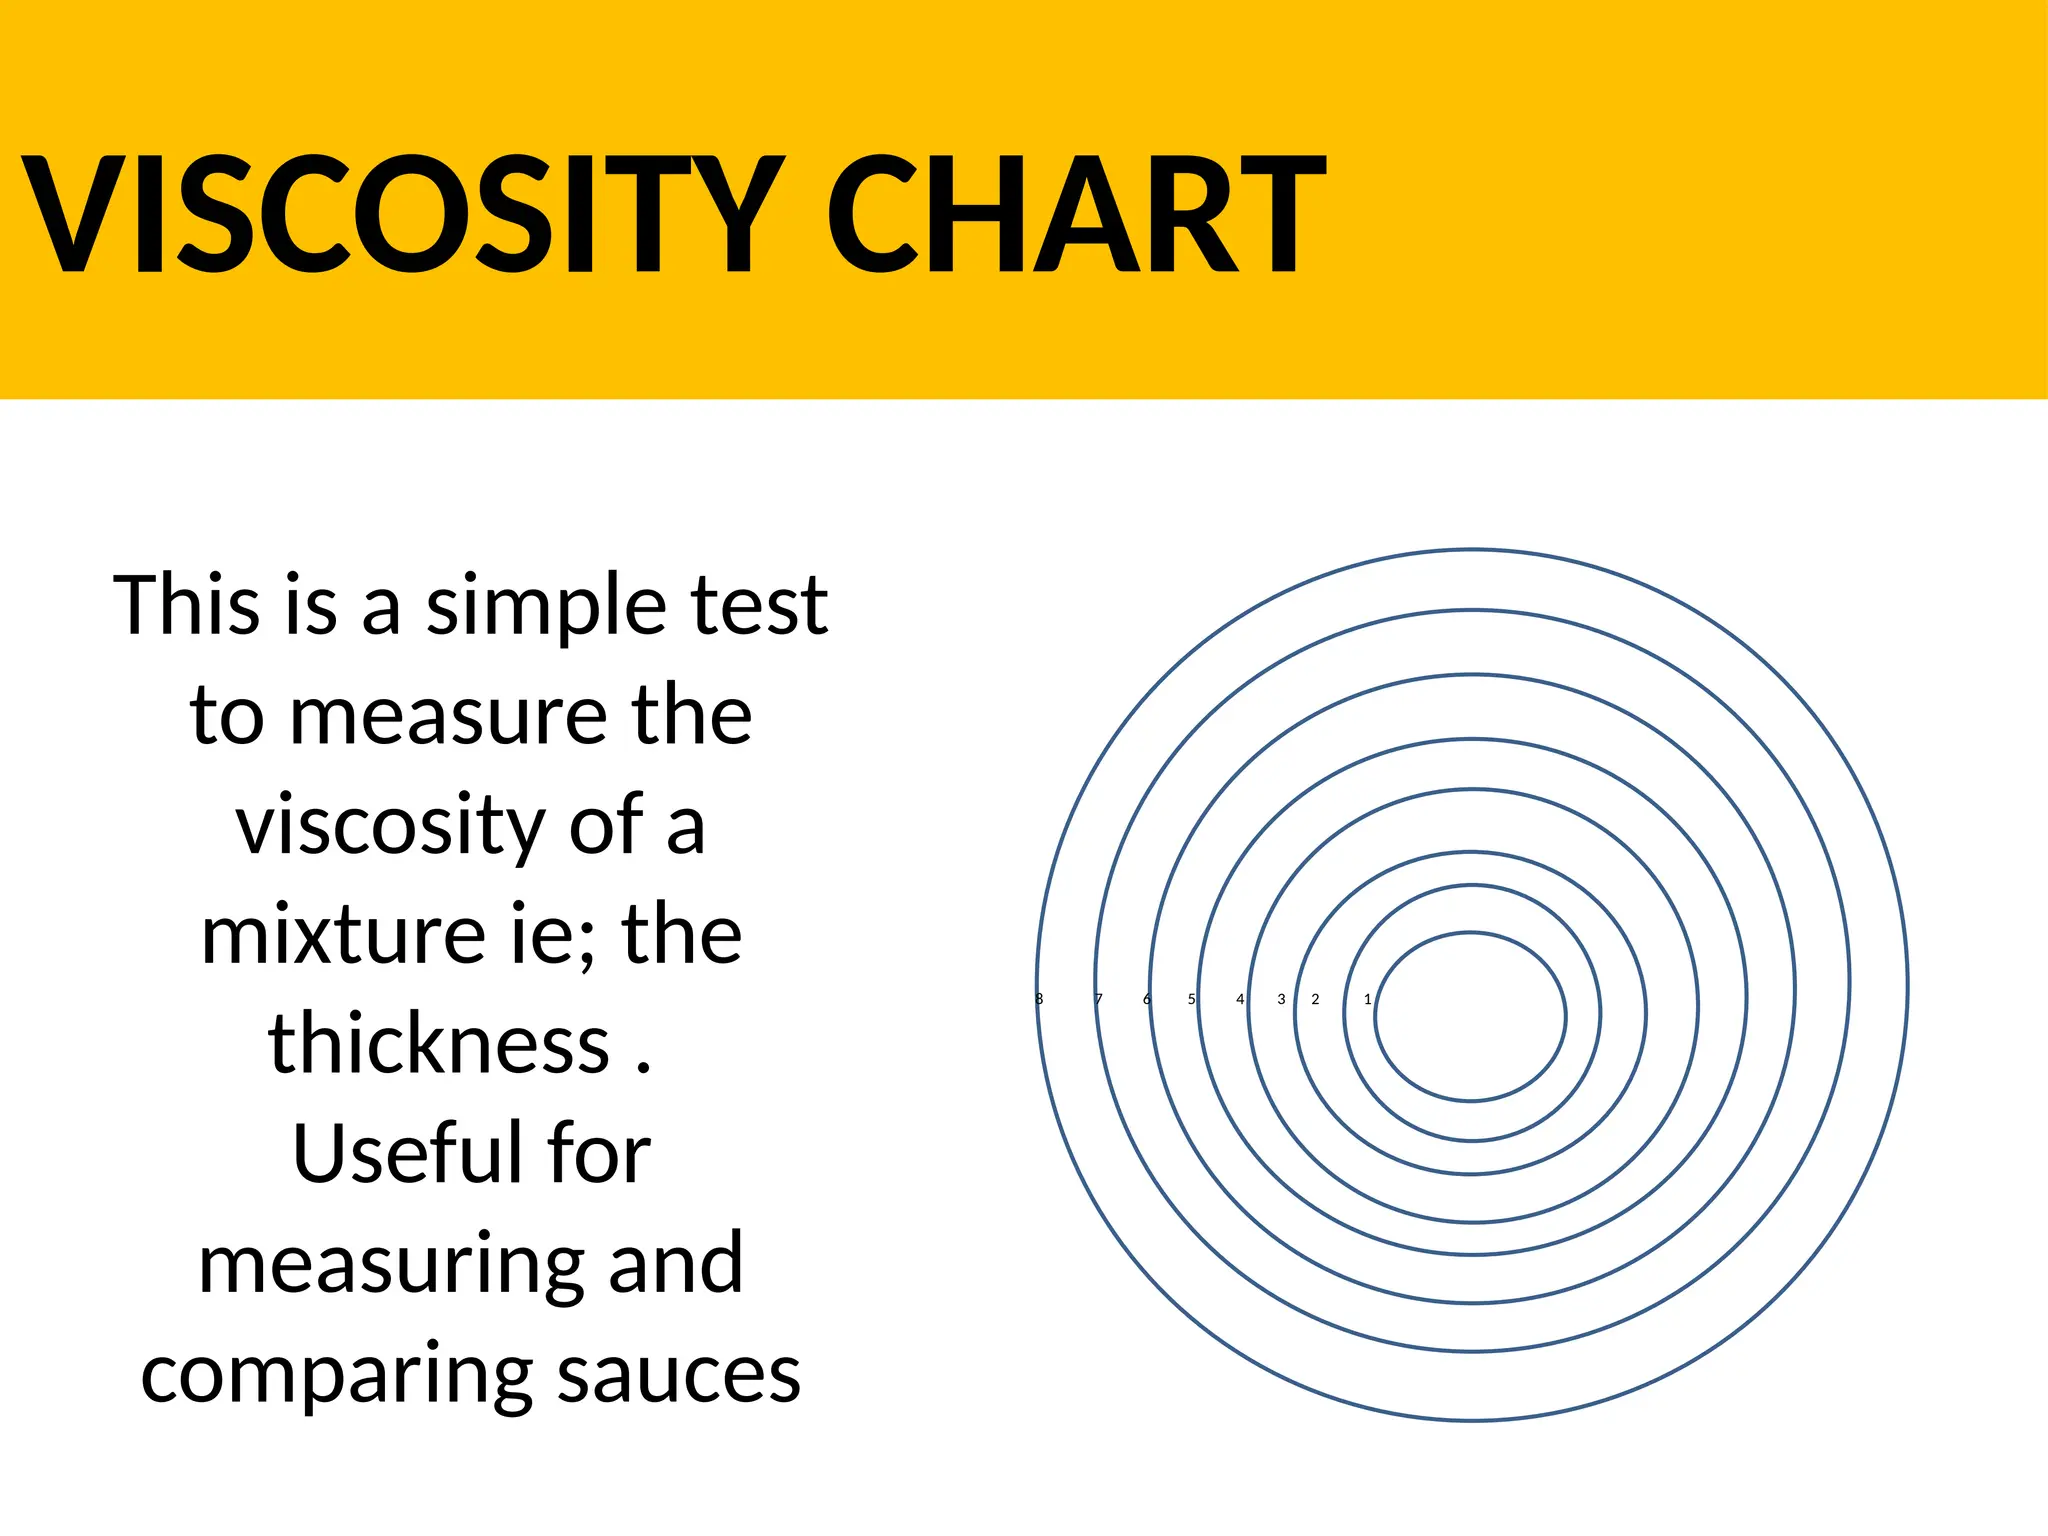
This is asimple test
to measure the
viscosity of a
mixture ie; the
thickness .
Useful for
measuring and
comparing sauces
VISCOSITY CHART
8 7 6 5 4 3 2 1
9.
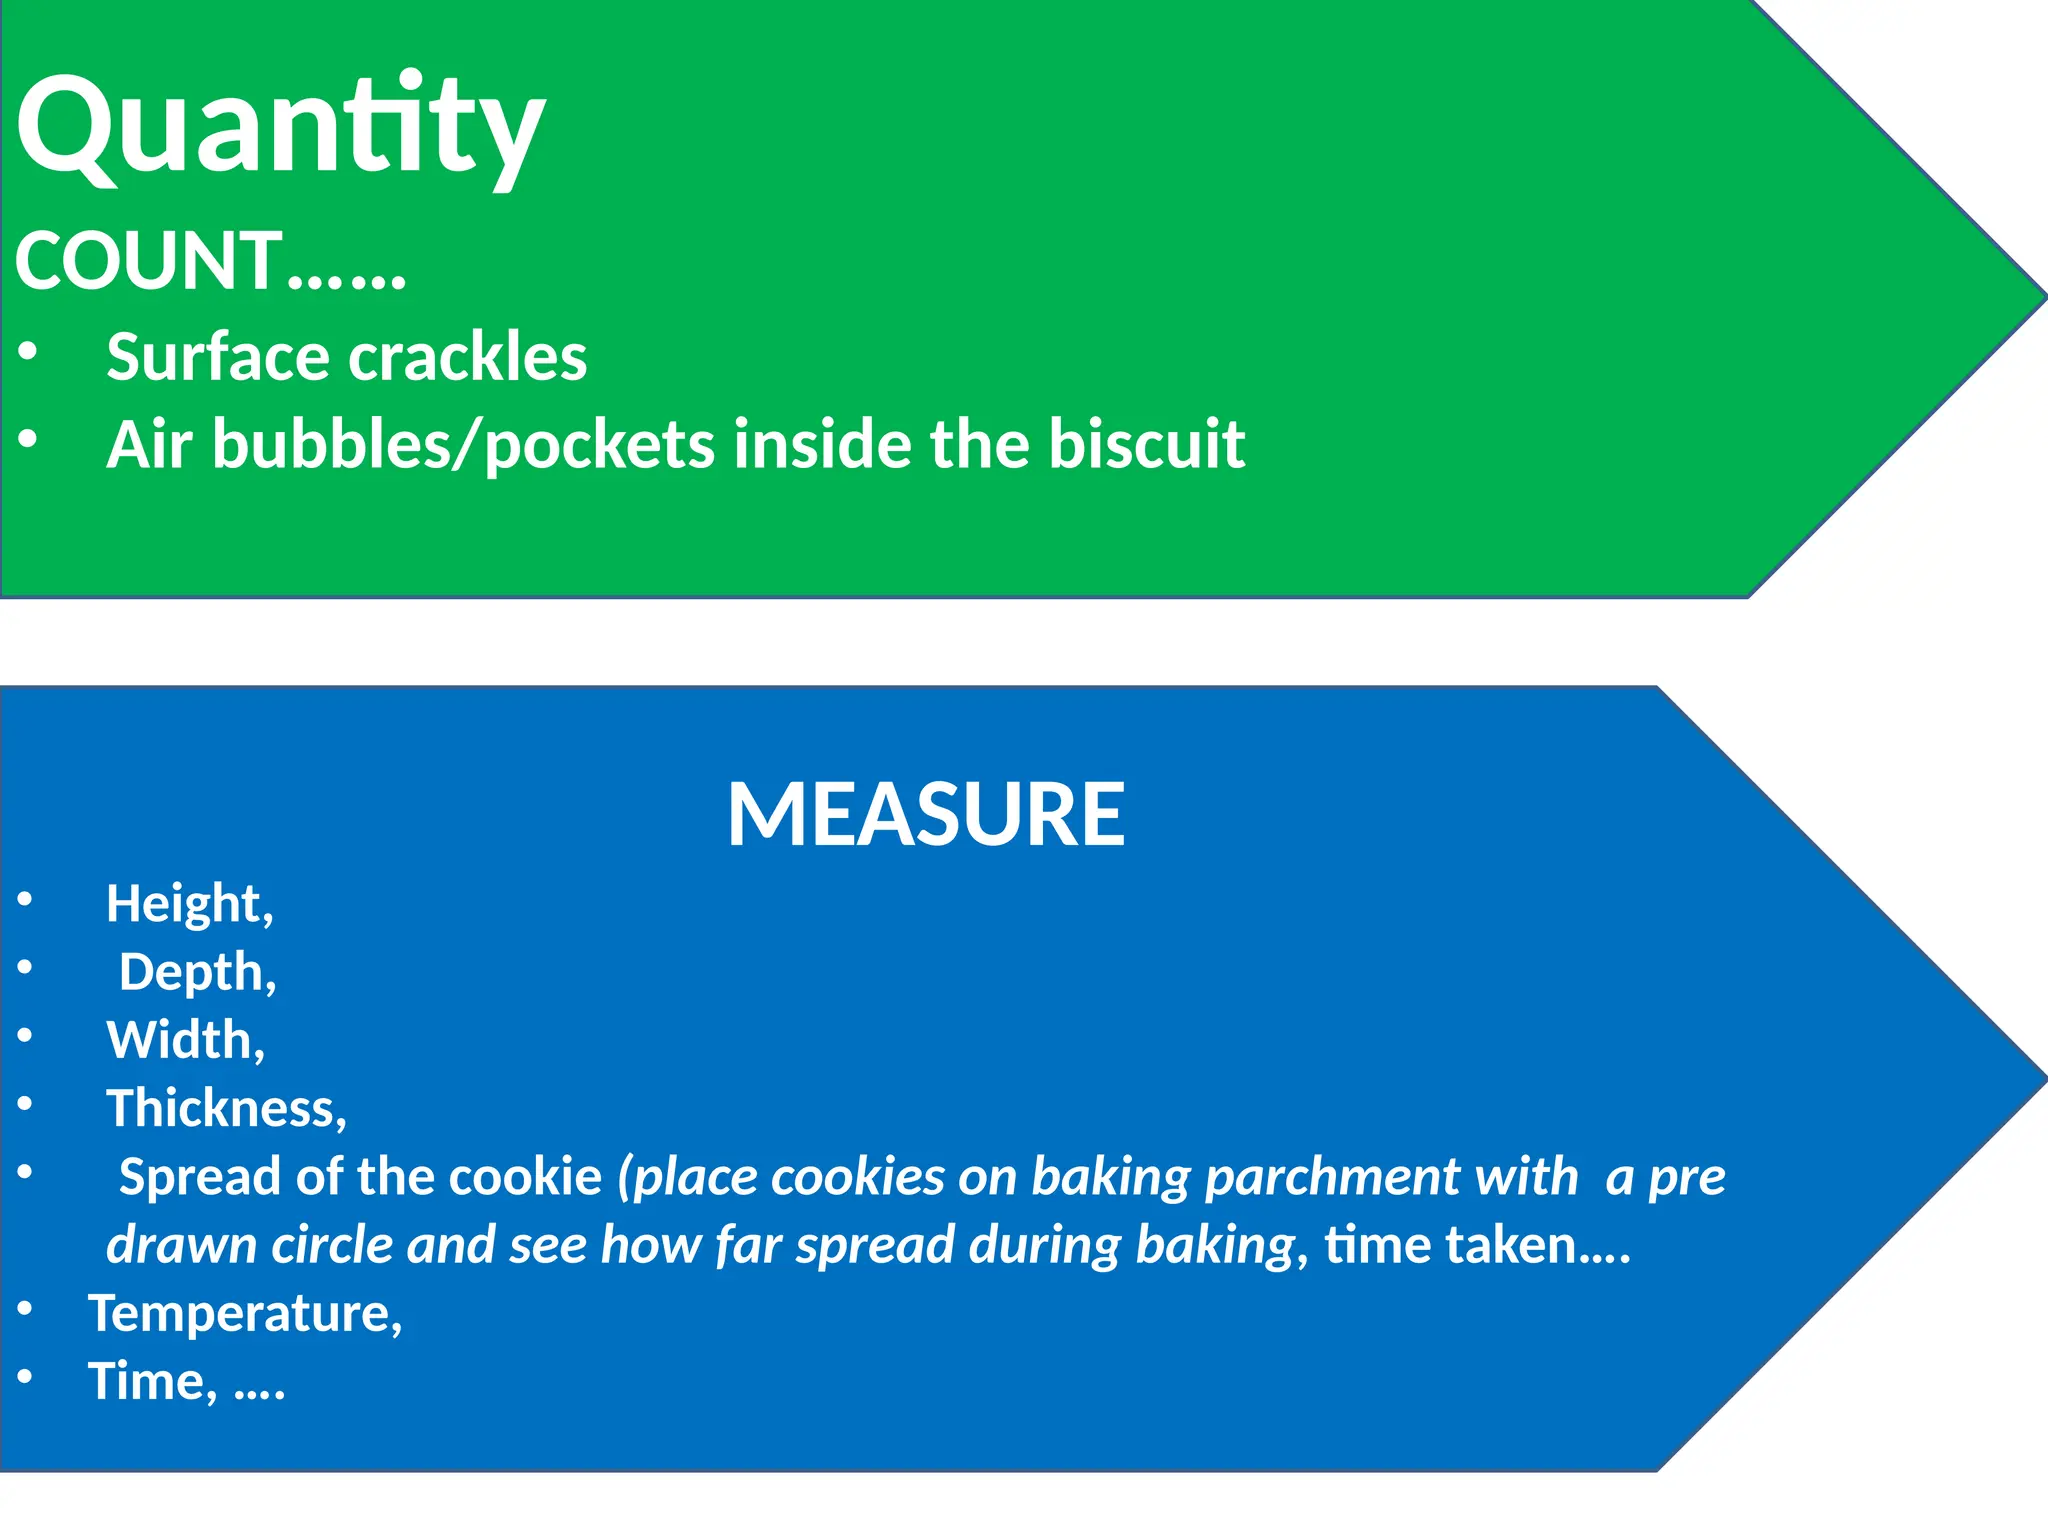
Quantity
COUNT……
• Surface crackles
•Air bubbles/pockets inside the biscuit
MEASURE
• Height,
• Depth,
• Width,
• Thickness,
• Spread of the cookie (place cookies on baking parchment with a pre
drawn circle and see how far spread during baking, time taken….
• Temperature,
• Time, ….


![Sensory evaluation L5 Sensory methods [Read-Only].pptx](https://cdn.slidesharecdn.com/ss_thumbnails/sensoryevaluationl5sensorymethodsread-only-251019064626-3af116a8-thumbnail.jpg?width=640&height=640&fit=bounds)


