This document provides example calculations for chlorine dosage, sodium hypochlorite (NaOCl) solution strength, and chemical feed rate for water disinfection. It includes equations to calculate chlorine dosage based on gallons of NaOCl solution and water produced. Tables are provided to determine NaOCl solution strength based on ounces of 12.5% NaOCl added to water and to calculate chemical feed rate based on desired chlorine residual, water flow rate, and NaOCl solution strength. Examples are included to demonstrate using the equations and tables to calculate values like chlorine dosage, NaOCl solution percentage, and chemical feed pump rate.
The document contains water quality monitoring data from the inlet and outlet of a water treatment system over a period of 20 hours. Parameters measured include pH, temperature, dissolved oxygen, height, time, and others. Inlet BOD was 1678 mg/L and outlet pH ranged from 6.4 to 10.5, generally decreasing throughout the period. Water flow and most parameters indicated the system was performing water treatment over the monitoring period.
The document presents calculations and data from a copper flotation process. It includes equations for the various flotation circuits (rougher, scavenger, cleaner, etc.). Mass balances are provided showing the distribution of copper, silver, and iron throughout the process, from the feed to each cell to the final concentrate. Assays are given for the feed and outputs from each cell, along with calculated flow rates and recoveries.
ASSIGNMNET-2 (10)Project submission with presentation-This.docxrock73
ASSIGNMNET-2 (10)
Project submission with presentation-
This activity is based on group work (3 students per group). Students is responsible to write a report about a given company, business idea or any other course related topics.
STEP 1- GROUPS CREATION:
Students may choose their mates and give a list of the members per group to the faculty member who will create a group wiki using that list. Those who did not choose their group members will be assigned automatically.
Step 2-- project theme
Each group will propose a project theme:
· case study about logistics and supply chain management in a company in Saudi Arabia ( to be precised)
· a new concept or innovation in the field of logistics management.
· The creation of a new project and the presentation of the logistics strategies, plans and practices.
Step 3- information gathering:
All the collected information has to be submitted in the wiki of the group.
The group work has to be continuous by updating the information in wikis that are specially created for the assignment (at least 5 updates per student).
Step 4: report submission week 12.
At the end of the semester, each student will submit the final report to concerned faculty members and present it to class with the help of a PowerPoint presentation with group members.
***************************************
Sheet1AveragesAverages with bad data thrown outStandard Deviation of AveragesStandard Deviation of Corrected DataTrial 1 (oC)Ecell (mV)Trial 2 (oC)Ecell (mV)Trial 3 (oC)Ecell (mV)Temperature (oC)Voltage (mV)Average TemperatureTemperatureVoltage (mV)TemperatureVoltage5.011613.113535.013064.412734.412731.0969655115100.08163334661.0969655115100.081633346610.011919.2137310.014239.713299.713290.4618802154122.09832103680.4618802154122.098321036820.0136621.8137920.9129020.9134520.913450.948.07286136690.948.072861366930.9119030.0131932.1138031.0129631.113501.053565375397.00687260881.484924240543.133513652440.0111840.4141140.1143940.2132340.314250.2081665999177.79857517240.212132034419.798989873249.0141450.6142450.1145949.9143249.914320.818535277223.62907813130.818535277223.629078131360.0136760.0134960.7145060.2138960.213890.404145188453.87330817140.404145188453.8733081714Average1341
Average Temperature (oC) vs Average Voltage (mV)
100.08163334665025122.0983210367775648.07286136688765897.006872608765875177.7985751723941223.62907813126304353.873308171425052100.08163334665025122.0983210367775648.07286136688765897.006872608765875177.7985751723941223.62907813126304353.8733081714250521.09696551146029050.461880215351701040.900000000000000361.05356537528527470.208166599946612240.818535277187245720.404145188432739671.09696551146029050.461880215351701040.900000000000000361.05356537528527470.208166599946612240.818535277187245720.404145188432739674.36666666666666639.733333333333332520.93140.16666666666666449.960.2333333333333271273.3333333333333132913451296.33333333333331322.66666666666671432.3333333333333 ...
EPA Method 200.7, Trace Elements in Water, Solids, and Biosolids by Inductively Coupled Plasma-Atomic Emission Spectrometry, describes the procedure and requirements for multi-element determinations by ICP-AES. This presentation demonstrates the capability of the ICPE-9820, with the ASC-9800 Auto-sampler and the Standard Addition Kit, to produce quick, accurate results that comply with the method.
This document provides errata and corrections to calculations presented in tables and equations in the book "Nutrient Requirements of Beef Cattle: Eighth Revised Edition". It lists multiple chapters where calculations were found to be incorrect and provides revised versions of affected tables and equations. The corrections include fixing proportional calculations, changing numerical coefficients in equations, and updating nutrient requirements tables.
The process involves fermenting a glucose-water solution with E. coli to produce succinic acid. The fermentation broth is then separated through filtration, liquid-liquid extraction with 1-octanol, and crystallization to obtain purified succinic acid crystals and recycled glucose-water solution. The succinic acid can be used to produce various derivatives for applications in industries like food, electronics, and automotive. Preliminary calculations show the process could yield a net profit of $166400 per year.
This document summarizes novel statistical methods for genetic association studies, including those that account for population structure. It describes methods for detecting gene-gene interactions and inferring copy number variations. For interactions, it proposes using graphics processing units to efficiently search large model spaces. For copy number analysis, it presents a hidden Markov model approach to deconvolve tumor profiles from normal cell contamination. Speedups of over 100x were achieved by parallelizing the model training on a GPU.
Water Balance Study is carried out for a Super Thermal Power plant as a part of the M. Tech final
project which is published in the Sustainable Water Resources Management (Springer) Journal (https://
doi.org/10.1007/s40899-020-00487-4).
Effect of Nitrogen, phosphorus, and Potassium on growth and yield of Potato, experiment results on potatoes, cost of cultivation on potatoes, thesis work on potato
The lab report summarizes an experiment conducted to determine the reaction order and rate constant (K) of a reaction at 40°C. Readings of conductivity were recorded over time and used to calculate concentration. The results were plotted as ln(CA/CAo) vs. time and 1/CA vs. time. The ln(CA/CAo) plot was nonlinear, indicating a second-order reaction. The rate constant K was calculated to be 8.268 × 10⁻³ at 40°C. The 1/CA plot was linear, also suggesting a first-order reaction, and the rate constant was calculated from the slope to be 0.177166013.
Volvo EC55B Compact Excavator Service Repair Manual.pdfbin971209zhou
This document provides specifications and information for components of an excavator. It includes:
1) Locations and descriptions of 35 major components of the excavator.
2) Conversion tables for common units of length, area, volume, weight, pressure, torque, power, energy, velocity, and temperature.
3) Specifications for the start switch including maximum current and wire specifications.
4) Specifications for the battery disconnector switch including operating voltage.
5) Tightening torque specifications for screws, nuts, and other components.
Volvo EC55B Compact Excavator Service Repair Manualfujdfjjskrtekme
This document provides service information for an excavator including:
1) Locations of key components on the excavator and descriptions of each.
2) Conversion tables for common measurement units of length, area, volume, weight, pressure, temperature and flow rate.
3) Specifications for the start switch, battery disconnector switch, and standard tightening torques for screws and nuts.
Volvo EC55B Compact Excavator Service Repair Manual.pdffjskemdmmded
This document provides specifications and information for components of an excavator. It includes:
1) Locations and descriptions of 35 major components of the excavator.
2) Conversion tables for common units of length, area, volume, weight, pressure, torque, power, energy, velocity, and temperature.
3) Specifications for the start switch, including maximum current and wire specifications.
4) Specifications for the battery disconnector switch, which has an operating voltage of 6-36V.
5) Standard tightening torques for screws and nuts of various sizes.
Volvo EC55B Compact Excavator Service Repair Manual.pdffujsekmdd9dik
This document provides specifications and information for components of an excavator. It includes:
1) Locations and descriptions of 35 major components of the excavator.
2) Conversion tables for common units of length, area, volume, weight, pressure, torque, power, energy, velocity, and temperature.
3) Specifications for the start switch including maximum current and wire specifications.
4) Specifications for the battery disconnector switch including operating voltage.
5) Tightening torque specifications for screws, nuts, and other components.
Volvo EC55B Compact Excavator Service Repair Manual.pdffujsekmd9idd1
This document provides service information for an excavator including:
1) Locations of major components on the excavator and descriptions of each.
2) Conversion tables for common measurement units of length, area, volume, weight, pressure, temperature, flow rate and other units.
3) Specifications for start switches, battery disconnect switches, and standard tightening torques for fasteners.
Volvo EC55B Compact Excavator Service Repair Manual.pdffujsekddmdmdm
This document provides service information for an excavator including:
1) Locations of key components on the excavator and diagrams labeling each part.
2) Conversion tables for common measurement units of length, area, volume, weight, pressure, temperature, flow rate and other units.
3) Specifications for start switches, battery disconnect switches, and standard tightening torques for different screw sizes.
Volvo EC55B Compact Excavator Service Repair Manual.pdffyhsejkdm8u
This document provides specifications and information for components of an excavator. It includes:
1) Locations and descriptions of 35 major components of the excavator.
2) Conversion tables for common units of length, area, volume, weight, pressure, torque, power, energy, velocity, and temperature.
3) Specifications for the start switch including maximum current and wire specifications.
4) Specifications for the battery disconnector switch including operating voltage.
5) Tightening torques for mounting screws and other components along with standard tightening torques for various screw sizes.
Volvo EC55B Compact Excavator Service Repair Manual.pdfttf99929781
This document provides service information for an excavator including:
1) Locations of key components on the excavator and diagrams labeling each part.
2) Conversion tables for common measurement units of length, area, volume, weight, pressure, temperature, flow rate and other units.
3) Specifications for start switches, battery disconnect switches, and standard tightening torques for bolts and nuts.
Volvo EC55B Compact Excavator Service Repair Manual.pdff8usejkdmdd8i
This document provides specifications and information for components of an excavator. It includes:
1) Locations and descriptions of 35 major components of the excavator.
2) Conversion tables for common units of length, area, volume, weight, pressure, torque, power, energy, velocity, and temperature.
3) Specifications for the start switch including maximum current and wire specifications.
4) Specifications for the battery disconnector switch including operating voltage.
5) Tightening torques for mounting screws and other components along with standard tightening torques for various screw sizes.
This document summarizes different bioconjugation chemistries used to prepare antibody-drug conjugates (ADCs), including lysine-mediated and cysteine-mediated conjugation. For lysine-mediated conjugation of an IgG1 antibody, the average drug-to-antibody ratio was 4.3 with 2.5% unconjugated antibody and 3.9% aggregates. For cysteine-mediated conjugation using a non-cleavable linker-payload, parameters like the stoichiometry of the reducing agent TCEP and linker-payload, reaction pH, antibody concentration, and buffer concentration were evaluated. Higher TCEP amounts increased drug loading but reduced aggregates and unconjugated antibody. Optimal pH was 6
The document summarizes the results of an experiment on leaching lead sulfide (PbS) particles using ferric chloride (FeCl3) as the lixiviant. The experiment involved leaching PbS at different times and temperatures, collecting leachate samples, and analyzing them to determine the amount of lead dissolved using atomic absorption spectroscopy. Graphs and tables show the results of lead concentration, mass of lead leached, and fractional lead dissolution over time for the different experimental conditions.
Evaluation of Variability and Combinability of Fecal Calprotectin (FCP) Resul...Covance
AACC 2019 -- Calprotectin is a calcium-heterodimer protein which is abundant in the cytoplasm of neutrophils. This is a biomarker with good sensitivity and specificity in case of inflammatory Bowel disease (IBD) which is a chronic inflammatory gut. In case of IBD, neutrophils from the inflammatory area release calprotectin, which leads to its increased levels in stool samples. Calprotectin is measured in extracted stools. There are several extraction devices that are commercially available as well a manual weigh-in method, "Gold Standard" method. The homogeneity of stool sample and the neutrophil levels in the sample affect the precision of the results from the same stool sample. Our study compares 2 commercial stool extraction devices with the manual weigh-in method as well as the variability within each extraction method.
This monthly report summarizes Nuttapon Khongdee's work on analyzing heavy metal content, pH, EC, and organic carbon levels in different soil types before planting. Soil samples were tested for pH, EC, and organic carbon using calibrated instruments and standard procedures. Results are displayed in tables showing mean and standard deviation values for each soil type and treatment. The report also discusses initial work on characterizing citral oil nanoemulsions, including how formulation components like HLB value, homogenization speed, and oil/surfactant ratio influence particle size and stability over time. Future work is planned to analyze the nanoemulsions' antibacterial and antifungal activities.
This document appears to be a final report for a project in a petroleum engineering course. It includes an introduction outlining the problem of determining the most profitable production plan for a reservoir given its characteristics. It then describes using the Tarner method to calculate initial hydrocarbons in place, primary production calculations including determining flow units and cumulative production over time, and waterflooding calculations. Tables show the results of the Tarner method calculations and production calculations. Maps and economic analysis are also mentioned but not described in detail.
Use PyCharm for remote debugging of WSL on a Windo cf5c162d672e4e58b4dde5d797...shadow0702a
This document serves as a comprehensive step-by-step guide on how to effectively use PyCharm for remote debugging of the Windows Subsystem for Linux (WSL) on a local Windows machine. It meticulously outlines several critical steps in the process, starting with the crucial task of enabling permissions, followed by the installation and configuration of WSL.
The guide then proceeds to explain how to set up the SSH service within the WSL environment, an integral part of the process. Alongside this, it also provides detailed instructions on how to modify the inbound rules of the Windows firewall to facilitate the process, ensuring that there are no connectivity issues that could potentially hinder the debugging process.
The document further emphasizes on the importance of checking the connection between the Windows and WSL environments, providing instructions on how to ensure that the connection is optimal and ready for remote debugging.
It also offers an in-depth guide on how to configure the WSL interpreter and files within the PyCharm environment. This is essential for ensuring that the debugging process is set up correctly and that the program can be run effectively within the WSL terminal.
Additionally, the document provides guidance on how to set up breakpoints for debugging, a fundamental aspect of the debugging process which allows the developer to stop the execution of their code at certain points and inspect their program at those stages.
Finally, the document concludes by providing a link to a reference blog. This blog offers additional information and guidance on configuring the remote Python interpreter in PyCharm, providing the reader with a well-rounded understanding of the process.
Advanced control scheme of doubly fed induction generator for wind turbine us...IJECEIAES
This paper describes a speed control device for generating electrical energy on an electricity network based on the doubly fed induction generator (DFIG) used for wind power conversion systems. At first, a double-fed induction generator model was constructed. A control law is formulated to govern the flow of energy between the stator of a DFIG and the energy network using three types of controllers: proportional integral (PI), sliding mode controller (SMC) and second order sliding mode controller (SOSMC). Their different results in terms of power reference tracking, reaction to unexpected speed fluctuations, sensitivity to perturbations, and resilience against machine parameter alterations are compared. MATLAB/Simulink was used to conduct the simulations for the preceding study. Multiple simulations have shown very satisfying results, and the investigations demonstrate the efficacy and power-enhancing capabilities of the suggested control system.
Software Engineering and Project Management - Introduction, Modeling Concepts...Prakhyath Rai
Introduction, Modeling Concepts and Class Modeling: What is Object orientation? What is OO development? OO Themes; Evidence for usefulness of OO development; OO modeling history. Modeling
as Design technique: Modeling, abstraction, The Three models. Class Modeling: Object and Class Concept, Link and associations concepts, Generalization and Inheritance, A sample class model, Navigation of class models, and UML diagrams
Building the Analysis Models: Requirement Analysis, Analysis Model Approaches, Data modeling Concepts, Object Oriented Analysis, Scenario-Based Modeling, Flow-Oriented Modeling, class Based Modeling, Creating a Behavioral Model.
artificial intelligence and data science contents.pptxGauravCar
What is artificial intelligence? Artificial intelligence is the ability of a computer or computer-controlled robot to perform tasks that are commonly associated with the intellectual processes characteristic of humans, such as the ability to reason.
› ...
Artificial intelligence (AI) | Definitio
Applications of artificial Intelligence in Mechanical Engineering.pdfAtif Razi
Historically, mechanical engineering has relied heavily on human expertise and empirical methods to solve complex problems. With the introduction of computer-aided design (CAD) and finite element analysis (FEA), the field took its first steps towards digitization. These tools allowed engineers to simulate and analyze mechanical systems with greater accuracy and efficiency. However, the sheer volume of data generated by modern engineering systems and the increasing complexity of these systems have necessitated more advanced analytical tools, paving the way for AI.
AI offers the capability to process vast amounts of data, identify patterns, and make predictions with a level of speed and accuracy unattainable by traditional methods. This has profound implications for mechanical engineering, enabling more efficient design processes, predictive maintenance strategies, and optimized manufacturing operations. AI-driven tools can learn from historical data, adapt to new information, and continuously improve their performance, making them invaluable in tackling the multifaceted challenges of modern mechanical engineering.
Electric vehicle and photovoltaic advanced roles in enhancing the financial p...IJECEIAES
Climate change's impact on the planet forced the United Nations and governments to promote green energies and electric transportation. The deployments of photovoltaic (PV) and electric vehicle (EV) systems gained stronger momentum due to their numerous advantages over fossil fuel types. The advantages go beyond sustainability to reach financial support and stability. The work in this paper introduces the hybrid system between PV and EV to support industrial and commercial plants. This paper covers the theoretical framework of the proposed hybrid system including the required equation to complete the cost analysis when PV and EV are present. In addition, the proposed design diagram which sets the priorities and requirements of the system is presented. The proposed approach allows setup to advance their power stability, especially during power outages. The presented information supports researchers and plant owners to complete the necessary analysis while promoting the deployment of clean energy. The result of a case study that represents a dairy milk farmer supports the theoretical works and highlights its advanced benefits to existing plants. The short return on investment of the proposed approach supports the paper's novelty approach for the sustainable electrical system. In addition, the proposed system allows for an isolated power setup without the need for a transmission line which enhances the safety of the electrical network
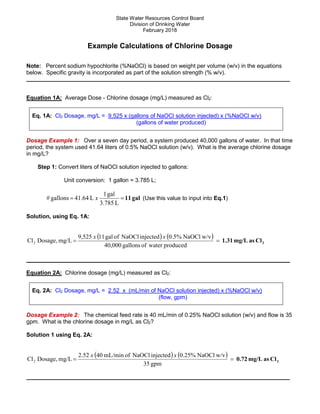
1. State Water Resources Control Board
Division of Drinking Water
February 2018
Example Calculations of Chlorine Dosage
Note: Percent sodium hypochlorite (%NaOCl) is based on weight per volume (w/v) in the equations
below. Specific gravity is incorporated as part of the solution strength (% w/v).
Equation 1A: Average Dose - Chlorine dosage (mg/L) measured as Cl2:
Eq. 1A: Cl2 Dosage, mg/L = 9,525 x (gallons of NaOCl solution injected) x (%NaOCl w/v)
(gallons of water produced)
Dosage Example 1: Over a seven day period, a system produced 40,000 gallons of water. In that time
period, the system used 41.64 liters of 0.5% NaOCl solution (w/v). What is the average chlorine dosage
in mg/L?
Step 1: Convert liters of NaOCl solution injected to gallons:
Unit conversion: 1 gallon = 3.785 L;
gal
11
L
3.785
gal
1
L
41.64
gallons
# =
= x (Use this value to input into Eq.1)
Solution, using Eq. 1A:
( ) ( )
2
Cl
as
mg/L
1.31
produced
water
of
gallons
40,000
w/v
NaOCl
0.5%
injected
NaOCl
of
gal
11
,525
9
mg/L
Dosage,
Cl2 =
=
x
x
Equation 2A: Chlorine dosage (mg/L) measured as Cl2:
Eq. 2A: Cl2 Dosage, mg/L = 2.52 x (mL/min of NaOCl solution injected) x (%NaOCl w/v)
(flow, gpm)
Dosage Example 2: The chemical feed rate is 40 mL/min of 0.25% NaOCl solution (w/v) and flow is 35
gpm. What is the chlorine dosage in mg/L as Cl2?
Solution 1 using Eq. 2A:
( ) ( )
2
Cl
as
mg/L
0.72
gpm
35
w/v
NaOCl
0.25%
injected
NaOCl
of
mL/min
40
.52
2
mg/L
Dosage,
Cl2 =
=
x
x
2. State Water Resources Control Board
Division of Drinking Water
Example Calculations of NaOCl Solution Strength (% w/v)
Note: The equations for sodium hypochlorite solution strength preparation are based on mixing 12.5%
NaOCl (w/w) to 10 gallons of water.
Equations 1B & 2B: Volume (ounces) of 12.5% NaOCl added to 10 gallons of water for target solution
strength (valid between 0.047 to 3.5% NaOCl, w/v):
Eq. 1B (Valid between 0.047 to 1% NaOCl solution strength, w/v):
Ounces of 12.5% NaOCl added per 10 gallons of water = 6.2715 x (%NaOCl)2
+ 85.108 x (%NaOCl)
Eq. 2B (Valid between 1 to 3.5% NaOCl solution strength. w/v):
Ounces of 12.5% NaOCl
added per 10 gallon of water = 9.2551 x (%NaOCl)2
+ 77.091 x (%NaOCl) + 5.6136
%Solution Strength Preparation Example 1: How many ounces of 12.5% NaOCl added to 10 gallons
of water are required to make a 0.5% NaOCl solution (w/v)?
Solution, using Equation 1B:
( )
water)
of
gal
10
to
added
NaOCl
12.5%
of
amount
volume
the
is
(This
NaOCl)
(0.5%
x
85.108
NaOCl
0.5%
x
6.2715
NaOCl
12.5%
of
Ounces
2
oz
44
=
+
=
Table 1 on the following page list the NaOCl solution strengths from 0.047 to 3.5% (w/v) based on the
volume of 12.5% NaOCl added to 10 gallons of water.
For example, if 20 oz. (2.5 cups) of 12.5% NaOCl (w/w) with a specific gravity (SG) of 1.2 is added to 10
gallons of water, the percent strength (w/v) is 0.2307% (table).
To determine the amount of liquid chlorine (12.5%) added to 25 gallons of water, multiply the results for a
10 gallon solution by 2.5 (2.5 x 20 oz. = 50 oz.).
4. State Water Resources Control Board
Division of Drinking Water
Example Calculations of NaOCl Feed Rate (mL/min)
Equation 1C: Chemical feed rate calculation:
Eq. 1C:
Feed Pump, mL/min = (Cl2 dosage, mg/L) x (Flow, gpm) x 0.3785
% NaOCl solution (w/v)
Feed Pump Rate Example 1: Water flow is 35 gpm and chlorine solution strength is 0.7% NaOCl (w/v).
What is the chemical feed rate (mL/min) needed to achieve a chlorine residual of 1.3 mg/L as Cl2?
Solution, using Equation 1C:
mL/min
25
NaOCl
0.7%
0.3785
gpm
35
mg/L
1.3
(mL/min)
Pump
Feed =
=
x
x
Feed Pump Rate Example 2: Water flow is 40 gpm and chlorine solution strength is 0.2307% NaOCl
(w/v). Using the table below, what is the chemical feed rate (mL/min) needed to achieve a chlorine
residual of 1.5 mg/L as Cl2?
Solution, using Table 2:
From Table 2, go to the column that has 0.2307% NaOCl. Move down the column until you intercept the
far left row that has 40 gpm.
The feed rate is 68.9 mL/min at 40 gpm for a target dosage of 1 mg/L as Cl2. Since we want to target a
chlorine residual of 1.5 mg/L, multiply the feed rate by 1.5 (68.9 mL/min x 1.5) and the required feed rate
is 103 mL/min.
Note: If flow exceeds the table value (i.e., 80 gpm), then lookup the chemical feed rate for 40 gpm and
double the results.
Unit conversions:
Using the results (103 mL/min) from Example 2, convert the units to L/hr, L/day, gal/hr and gal/day.
hr
gal
1.63
hr
L
6.18
L
3.785
gal
1
hr
L
6.18
hr
gal
#
;
mL
1,000
L
1
hr
1
min
60
min
mL
103
hr
L
# =
=
=
= x
x
x
day
gal
day
L
8
1 9
3
L
3.785
gal
1
day
L
148
day
gal
#
;
4
day
1
hr
24
hr
L
6.18
day
L
# =
=
=
= x
x
5. State Water Resources Control Board
Division of Drinking Water
Note: The ounces (oz) below the % strength in each column is the number of ounces of 12.5% NaOCl
(w/w) mixed with 10 gallons of water to produce the solution strength (% w/v).
Table 2:
Chemical Feed Rate (mL/min) for a Target Dose of 1 mg/L as Cl2
Flow Based on %NaOCl Solution Strength (w/v)
gpm 0.04705%
4 oz
0.09309%
8 oz
0.13928%
12 oz
0.1854%
16 oz
0.2307%
20 oz
0.2761%
24 oz
0.3213%
28 oz
0.3658%
32 oz
0.4100%
36 oz
0.45471%
40 oz
0.4985%
44 oz
10 84.5 42.7 28.5 21.4 17.2 14.4 12.4 10.9 9.7 8.7 8.0
15 126.7 64.0 42.8 32.2 25.8 21.6 18.6 16.3 14.5 13.1 12.0
20 168.9 85.4 57.1 42.9 34.5 28.8 24.7 21.7 19.4 17.5 16.0
25 211.2 106.7 71.3 53.6 43.1 36.0 30.9 27.2 24.2 21.9 19.9
30 253.4 128.1 85.6 64.3 51.7 43.2 37.1 32.6 29.1 26.2 23.9
35 295.6 149.4 99.9 75.0 60.3 50.4 43.3 38.0 33.9 30.6 27.9
40 337.9 170.7 114.1 85.8 68.9 57.6 49.5 43.5 38.8 35.0 31.9
45 380.1 192.1 128.4 96.5 77.5 64.8 55.7 48.9 43.6 39.3 35.9
50 422.3 213.4 142.7 107.2 86.1 72.0 61.8 54.3 48.5 43.7 39.9
55 464.6 234.8 156.9 117.9 94.8 79.2 68.0 59.7 53.3 48.1 43.8
60 506.8 256.1 171.2 128.6 103.4 86.4 74.2 65.2 58.2 52.4 47.8
Chemical Feed Rate (mL/min) for a Target Dose of 1 mg/L as Cl2
Flow Based on %NaOCl Solution Strength (w/v)
gpm 0.54177%
48 oz
0.6498%
58 oz
0.7777%
70 oz
0.9027%
82 oz
1.024%
94 oz
1.147%
106 oz
1.261%
118 oz
1.384%
130 oz
1.499%
142 oz
1.613%
154 oz
1.719%
166 oz
10 7.3 6.1 5.1 4.4 3.9 3.5 3.2 2.9 2.7 2.5 2.3
15 11.0 9.2 7.7 6.6 5.8 5.2 4.7 4.3 4.0 3.7 3.5
20 14.7 12.2 10.2 8.8 7.8 6.9 6.3 5.7 5.3 4.9 4.6
25 18.3 15.3 12.8 11.0 9.7 8.7 7.9 7.2 6.6 6.2 5.8
30 22.0 18.4 15.3 13.2 11.7 10.4 9.5 8.6 8.0 7.4 6.9
35 25.7 21.4 17.9 15.4 13.6 12.1 11.0 10.1 9.3 8.6 8.1
40 29.3 24.5 20.4 17.6 15.5 13.9 12.6 11.5 10.6 9.9 9.2
45 33.0 27.5 23.0 19.8 17.5 15.6 14.2 12.9 11.9 11.1 10.4
50 36.7 30.6 25.6 22.0 19.4 17.3 15.8 14.4 13.3 12.3 11.6
55 40.3 33.6 28.1 24.2 21.4 19.1 17.3 15.8 14.6 13.6 12.7
60 44.0 36.7 30.7 26.4 23.3 20.8 18.9 17.2 15.9 14.8 13.9
Chemical Feed Rate (mL/min) for a Target Dose of 1 mg/L as Cl2
Flow Based on %NaOCl Solution Strength (w/v)
gpm 1.833%
178 oz
1.939%
190 oz
2.064%
204 oz
2.215%
222 oz
2.363%
240 oz
2.533%
260 oz
2.704%
282 oz
2.899%
306 oz
3.071%
330 oz
3.254%
354 oz
3.462%
384 oz
10 2.2 2.1 1.9 1.8 1.7 1.6 1.5 1.4 1.3 1.2 1.2
15 3.3 3.1 2.9 2.7 2.5 2.4 2.2 2.1 2.0 1.8 1.7
20 4.3 4.1 3.9 3.6 3.4 3.1 2.9 2.7 2.6 2.4 2.3
25 5.4 5.1 4.8 4.5 4.2 3.9 3.7 3.4 3.2 3.1 2.9
30 6.5 6.2 5.8 5.4 5.1 4.7 4.4 4.1 3.9 3.7 3.4
35 7.6 7.2 6.7 6.3 5.9 5.5 5.2 4.8 4.5 4.3 4.0
40 8.7 8.2 7.7 7.2 6.7 6.3 5.9 5.5 5.2 4.9 4.6
45 9.8 9.2 8.7 8.1 7.6 7.1 6.6 6.2 5.8 5.5 5.2
50 10.8 10.3 9.6 9.0 8.4 7.8 7.3 6.9 6.5 6.1 5.7
55 11.9 11.3 10.6 9.9 9.2 8.6 8.1 7.5 7.1 6.7 6.3
60 13.0 12.3 11.6 10.8 10.1 9.4 8.8 8.2 7.8 7.3 6.9