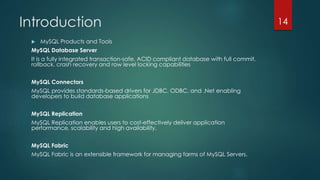
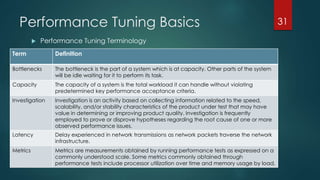
This document outlines topics covered in a MySQL Performance Tuning course. The introduction section provides an overview of MySQL, its products and tools, services and support, documentation, and certification. The performance tuning basics section discusses key concepts like measuring performance, identifying areas to tune like hardware, MySQL configuration, schema/queries, and application architecture. It emphasizes the importance of measurement to identify bottlenecks. The remaining sections cover specific tools and techniques for tuning different aspects of MySQL.


![Performance Tuning Basics
Areas to tune -> MySQL Configuration
MySQL allows a DBA or developer to modify parameters including the
maximum number of client connections, the size of the query cache, the
execution style of different logs, index memory cache size, the network
protocol used for client-server communications, and dozens of others. This
is done by editing the “my.cnf” configuration file, as in this example:
[mysqld]
performance_schema
performance_schema_events_waits_history_size=20
performance_schema_events_waits_history_long_size=15000
log_slow_queries = slow_query.log
long_query_time = 1
log_queries_not_using_indexes = 1
28](https://image.slidesharecdn.com/mysqlperformancetuningcourse-141010050826-conversion-gate01/85/My-sql-performance-tuning-course-28-320.jpg)


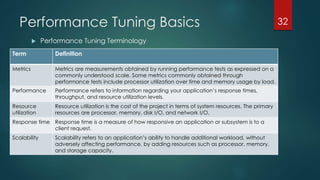


![Performance Tuning Basics
Tuning steps – Step 5 – Queries
The IN clause in MySLQ is very fast!
Select ... Where idx IN(1,23,345,456) - Much faster than a join
Don’t wrap your indexes in expressions in Where
Select ... Where func(idx) = 20 [index ignored]
Select .. Where idx = otherfunc(20) [may use index]
Best practice : Keep index alone on left side of condition
Avoid % at the start of LIKE on an index
Select ... Where idx LIKE(‘ABC%’) can use index
Select ... Where idx LIKE(‘%XYZ’) must do full table scan
Use union all when appropriate, default is union distinct!
Understand left/right joins and use only when needed.
47](https://image.slidesharecdn.com/mysqlperformancetuningcourse-141010050826-conversion-gate01/85/My-sql-performance-tuning-course-47-320.jpg)


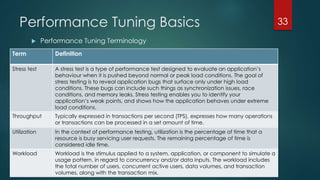
![MySQL Query Performance
Finding Problematic Queries
Database performance is affected by many factors. One of them is the query
optimizer. To be sure the query optimizer is not introducing noise to well functioning
queries we must analyse slow queries, if any. Watch the Slow query log first, as stated
previously in the course. By default, the slow query log is disabled. To specify the
initial slow query log state explicitly, use
mysqld --slow_query_log[={0|1}]
With no argument or an argument of 1, --slow_query_log enables the log. With
an argument of 0, this option disables the log.
One of best tools to accomplish query analysis execution is pt-query-digest from
Percona. It’s a third party tool that relies on logs, processlist, and tcpdump.
You also need the log to include all the queries, not just those that take more than N
seconds. The reason is that some queries are individually quick, and would not be
logged if you set the long_query_time configuration variable to 1 or more seconds.
You want that threshold to be 0 seconds while you’re collecting logs.
151](https://image.slidesharecdn.com/mysqlperformancetuningcourse-141010050826-conversion-gate01/85/My-sql-performance-tuning-course-151-320.jpg)


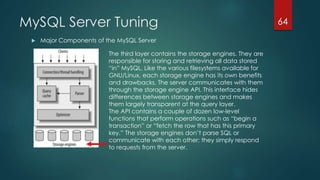
![MySQL Query Performance
Locate and Correct Problematic Queries
Baseline. Always establish the current baseline of MySQL performance before any changes are made.
Otherwise it is really only a guess afterwards whether the changes improved MySQL performance. The
easiest way to baseline MySQL performance is with mysqlreport.
Assess Baseline. The report that mysqlreport writes can contain a lot of information, but for our purpose
here there are only three things we need to look at. It is not necessary to understand the nature of these
values at this point, but they give us an idea how well or not MySQL is really running.
Log Slow Queries and Wait. By default MySQL does not log slow queries and the slow query time is 10
seconds. This needs to be changed by adding these lines under the [msyqld] section in /etc/my.cnf:
log-slow-queries
long_query_time = 1
Restart MySQL and wait at least a full day. This will cause MySQL to log all queries which take longer than 1 second to
execute.
Isolate Top 10 Slow Queries. The easiest way to isolate the top 10 slowest queries in the slow queries log is
to use mysqlsla. Run mysqlsla on your slow queries log and save the output to a file. For example:
"mysqlsla --log-type slow /var/lib/mysql/slow_queries.log > ~/top_10_slow_queries".
That command will create a file in your home directory called top_10_slow_queries.
Post-fix Proof. Presuming that your MySQL expert was able to fix the top slow queries, the final step is to
actually prove this is the case and not just coincidence. Restart MySQL and wait as long as MySQL had
ran in the first step (at least a day ideally). Then baseline MySQL performance again with mysqlreport.
Compare the first report with this second report, specifically the three values we looked at in step two
(Read ratio, Slow, and Waited).
155](https://image.slidesharecdn.com/mysqlperformancetuningcourse-141010050826-conversion-gate01/85/My-sql-performance-tuning-course-155-320.jpg)


![Performance Tuning Extras
Operating Systems Configurations
Linux
whatever the distribution chosen, the configuration is based on the file my.cnf. Most of the cases,
you should not touch this file. By default, it will have the following entries:
[mysqld]
datadir=/var/lib/mysql
socket=/var/lib/mysql/mysql.sock
[mysql.server]
user=mysql
basedir=/var/lib
[safe_mysqld]
err-log=/var/log/mysqld.log
pid-file=/var/run/mysqld/mysqld.pid
161](https://image.slidesharecdn.com/mysqlperformancetuningcourse-141010050826-conversion-gate01/85/My-sql-performance-tuning-course-161-320.jpg)

![Performance Tuning Extras
Logging
Logging parameters are located under [mysqld] section in /etc/my.cnf configuration file. A
typical schema should be the following:
[mysqld]
log-bin=/var/log/mysql-bin.log
log=/var/log/mysql.log
log-error=/var/log/mysql-error.log
log-slow-queries=/var/log/mysql-slowquery.log
163](https://image.slidesharecdn.com/mysqlperformancetuningcourse-141010050826-conversion-gate01/85/My-sql-performance-tuning-course-163-320.jpg)
![Performance Tuning Extras
Logging
Error Log
Error Log goes to syslog due to /etc/mysql/conf.d/mysqld_safe_syslog.cnf, which contains the following:
[mysqld_safe]
syslog
General Query Log
To enable General Query Log, uncomment (or add) the relevant lines
general_log_file = /var/log/mysql/mysql.log
general_log = 1
Slow Query Log
To enable Slow Query Log, uncomment (or add) the relevant lines
log_slow_queries = /var/log/mysql/mysql-slow.log
long_query_time = 2
log-queries-not-using-indexes
Restart MySQL server after changes
This method requires a server restart.
$ Service mysql restart
164](https://image.slidesharecdn.com/mysqlperformancetuningcourse-141010050826-conversion-gate01/85/My-sql-performance-tuning-course-164-320.jpg)


![Lab 1: MySQL Environment
First MySQL server configuration. Find and edit the main
configuration file called “my,cnf” and enter these values, then
restart MySQL
[mysqld]
performance_schema
performance_schema_events_waits_history_size=20
performance_schema_events_waits_history_long_size=15000
log_slow_queries = slow_query.log
long_query_time = 1
log_queries_not_using_indexes = 1
$ service mysql restart
177](https://image.slidesharecdn.com/mysqlperformancetuningcourse-141010050826-conversion-gate01/85/My-sql-performance-tuning-course-177-320.jpg)


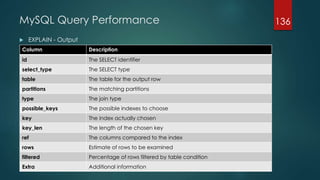
![Lab 4: Performance_schema queries
Once enabled, try to use the performance_schema monitoring database
$ vi /etc/my.cnf
[mysqld]
performance_schema=on
mysql> USE performance_schema;
mysql> SELECT TABLE_NAME FROM INFORMATION_SCHEMA.TABLES WHERE TABLE_SCHEMA =
'performance_schema';
mysql> SHOW TABLES FROM performance_schema;
mysql> SHOW CREATE TABLE setup_timersG
mysql> UPDATE setup_instruments SET ENABLED = 'YES', TIMED = 'YES';
mysql> UPDATE setup_consumers SET ENABLED = 'YES';
mysql> SELECT * FROM events_waits_currentG
194](https://image.slidesharecdn.com/mysqlperformancetuningcourse-141010050826-conversion-gate01/85/My-sql-performance-tuning-course-194-320.jpg)