This document provides information about State Bank of India - Mutual Fund (SBI MF). It discusses the company profile, key personnel, risk management team, and products offered by SBI MF. Some key points:
- SBI MF is one of the largest mutual funds in India with over 4.6 million investors and assets under management of over Rs. 51,461 crores across 36 schemes.
- It is a joint venture between State Bank of India and Société General Asset Management.
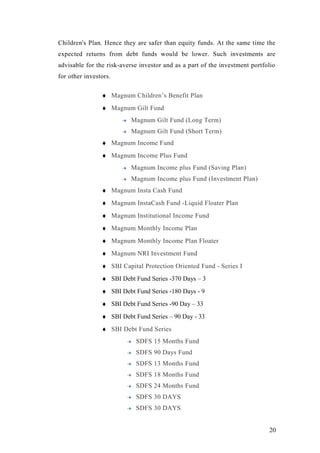
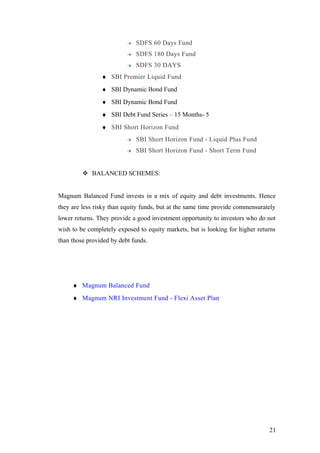
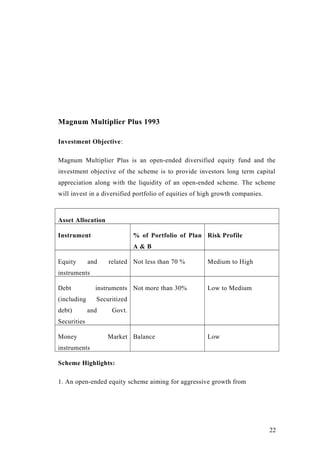
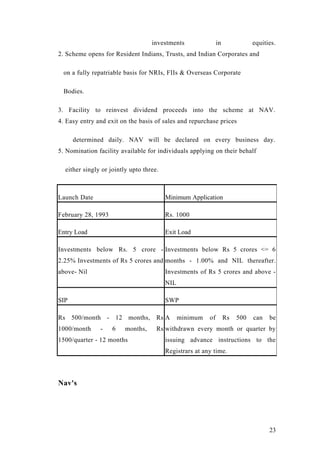
- SBI MF offers various equity, debt, liquid and other schemes and has a track record of over 20 years of consistent performance.
- The risk management team is headed by a