Download as PDF, PPTX


![Stroke Volume of all Groups in the NGS Project
30
x10 25
Volume [mm3]
20
15
10
5
0
Stroke Volume
Control 13,38
PTZ before Stroke 15,69
PTZ after Stroke 17,86
ES after Stroke 18,16
Sham 5,49](https://image.slidesharecdn.com/popawagner-130417064728-phpapp02/75/Multi-stage-multimodal-Approaches-for-regenerative-stroke-therapies-46-2048.jpg)


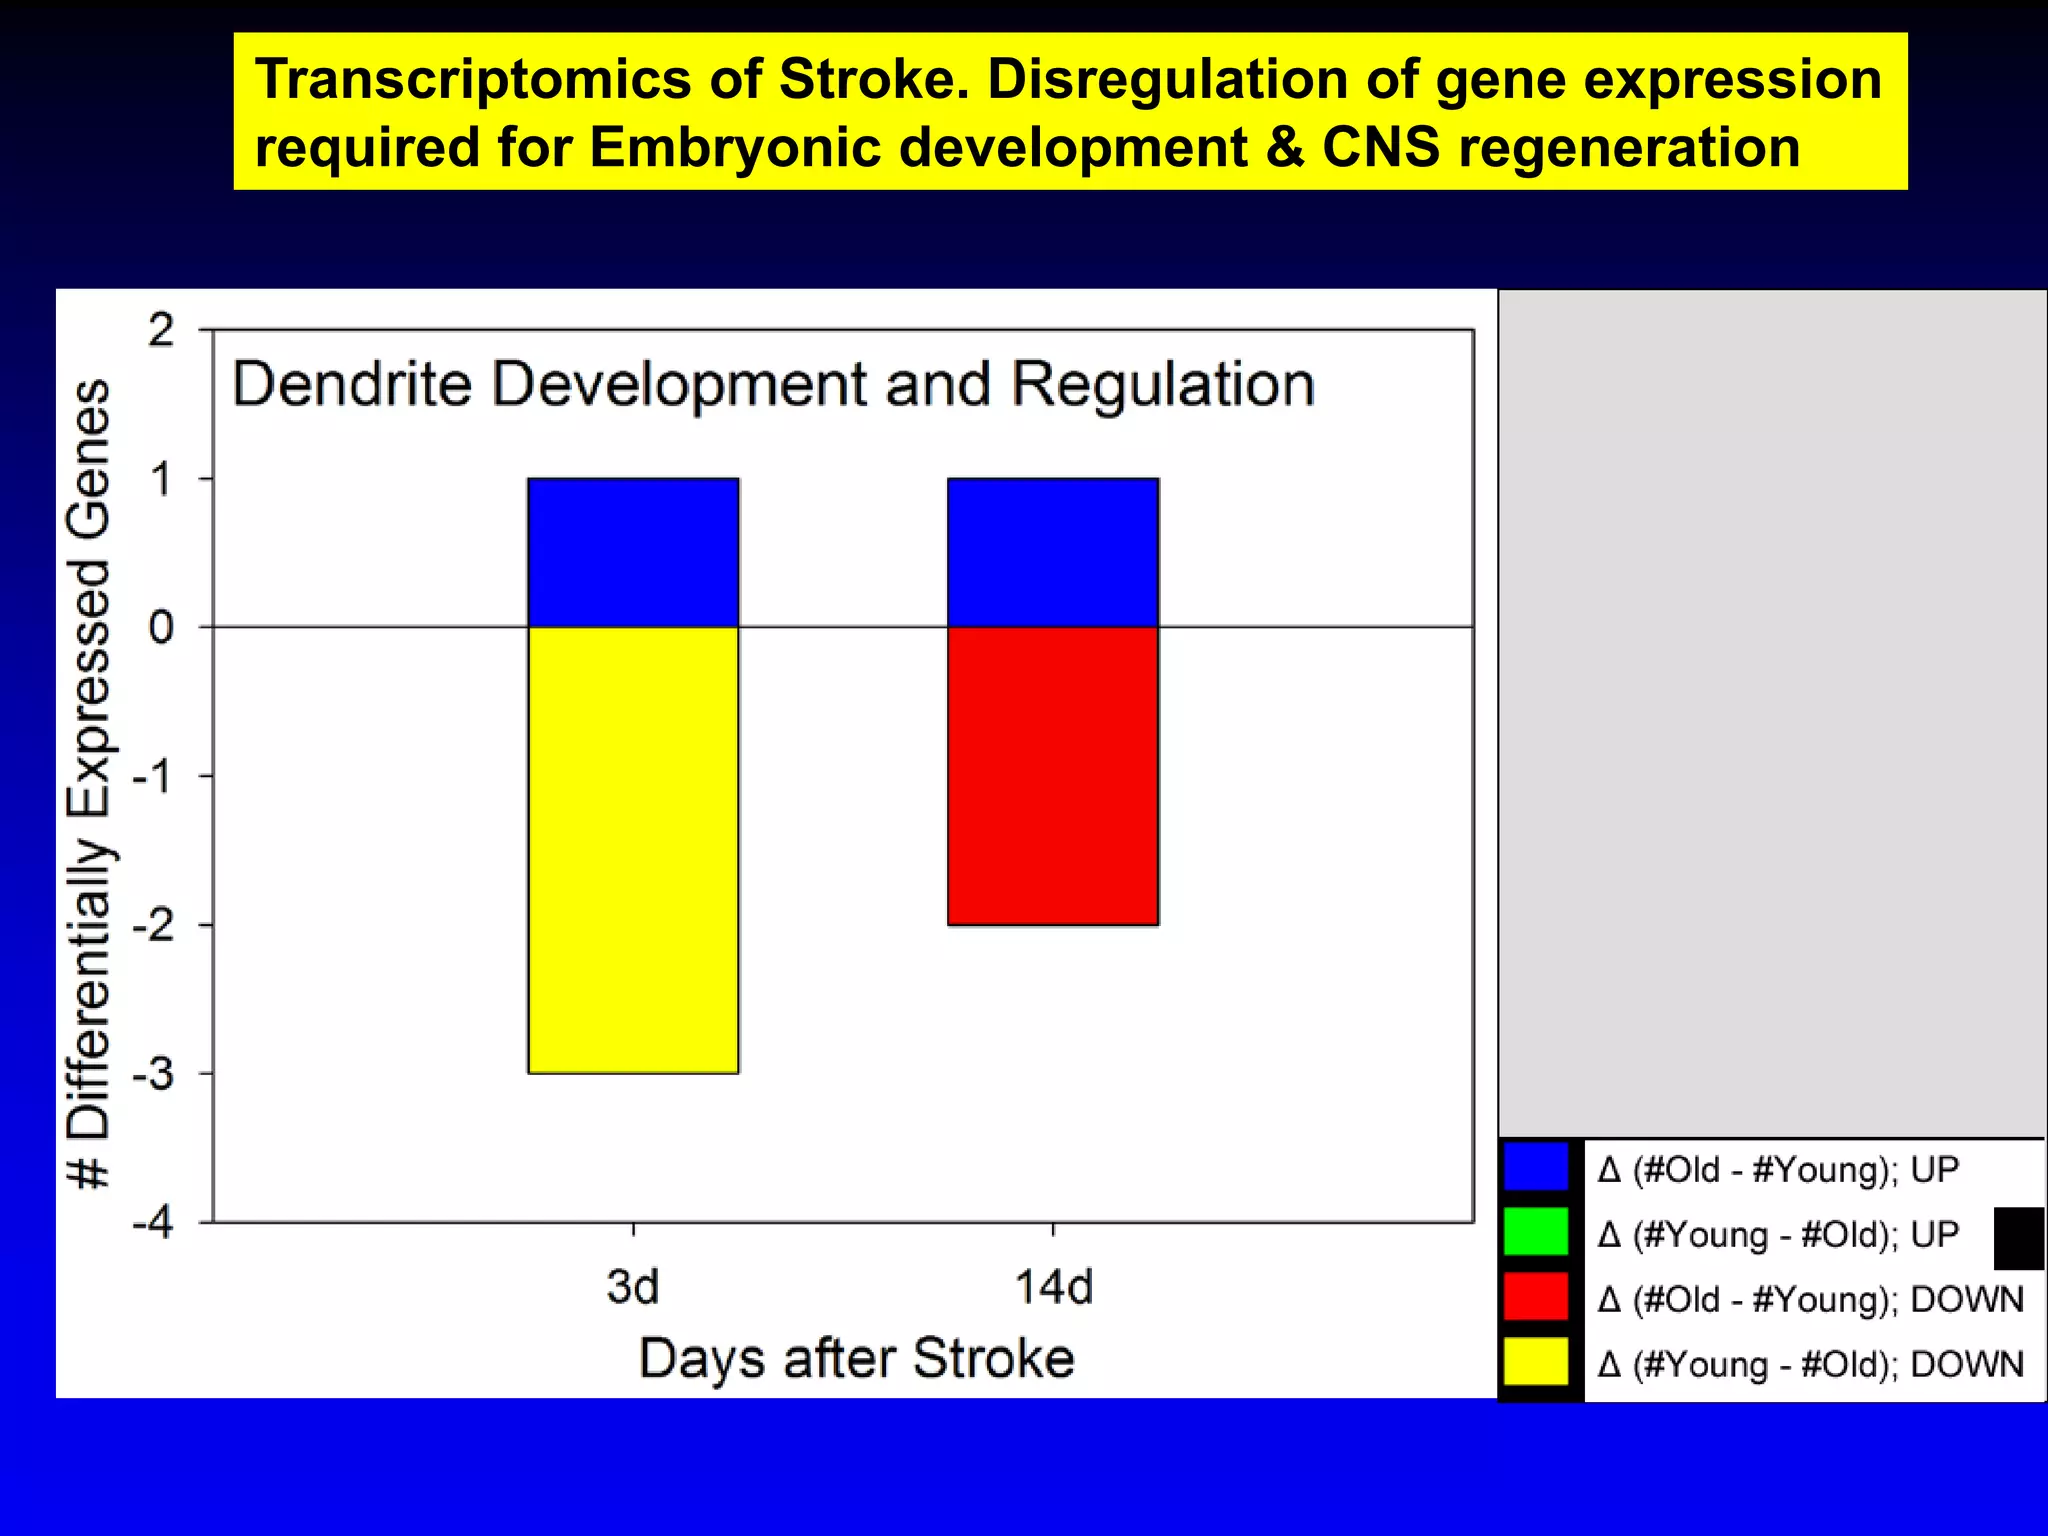
The document discusses the challenges and strategies in stroke rehabilitation, particularly highlighting the importance of studying aged animal models to understand the age-dependent responses to stroke. It outlines findings from various studies on gene expression changes, treatment approaches including G-CSF and stem cell therapies, and the potential role of hypothermia in stroke recovery. The conclusion emphasizes the need for multimodal treatment strategies that address the complexity of stroke pathology and aging effects on neurogenesis and recovery.


![Prof aw tar [compatibility mode]](https://cdn.slidesharecdn.com/ss_thumbnails/profawtarcompatibilitymode-110726213602-phpapp02-thumbnail.jpg?width=640&height=640&fit=bounds)


