Download to read offline


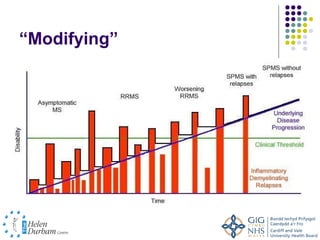

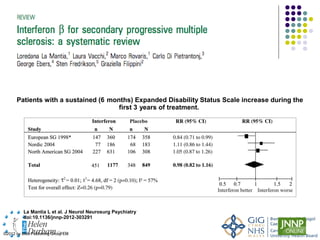
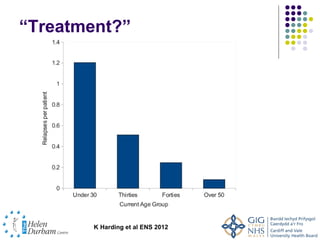


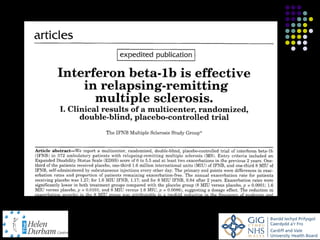


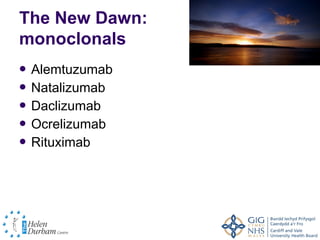


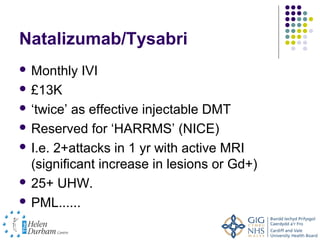
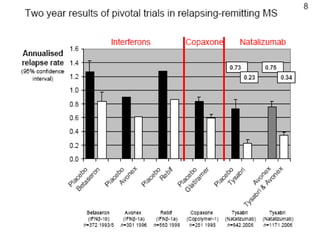


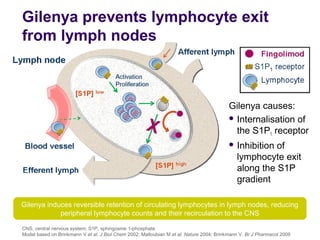


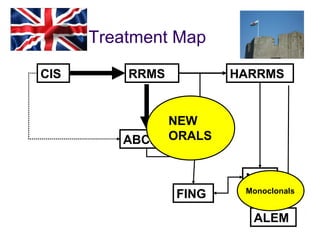


Disease modifying treatments for multiple sclerosis have evolved significantly over time. Early treatments focused on interferon-beta, which showed moderate effectiveness in reducing relapses and disability progression. Newer monoclonal antibody treatments such as natalizumab provided greater reductions in disease activity but also carried increased safety risks. The latest oral therapies including fingolimod, teriflunomide, dimethyl fumarate, and laquinimod provide over 50% reductions in relapse rates compared to earlier treatments with generally improved safety profiles. Ongoing research continues to evaluate new mechanisms of action to more effectively treat multiple sclerosis.


