Download as PDF, PPTX


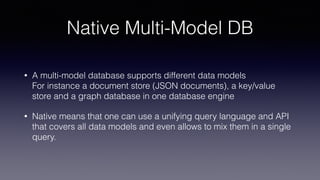
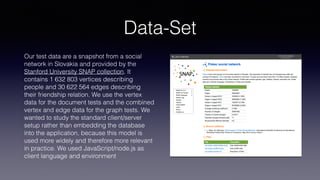

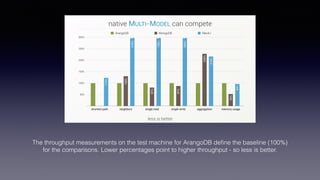


The document presents a performance comparison of native multi-model databases: ArangoDB, MongoDB, and Neo4j, using a dataset from a Slovakian social network. It outlines the test setup, including data characteristics, use cases like single reads/writes and aggregations, and benchmark criteria, emphasizing that ArangoDB serves as the baseline for performance metrics. It encourages readers to conduct their own benchmarks rather than solely trusting the presented results.


![7.__Developing_a_Research_Proposal[1].pptx](https://cdn.slidesharecdn.com/ss_thumbnails/7-260131073037-df92dd7d-thumbnail.jpg?width=640&height=640&fit=bounds)


