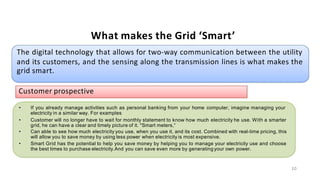
The document discusses key elements and technologies that make the electricity grid "smart". It describes advanced metering infrastructure (AMI) including its components like smart meters, neighborhood area networks, meter data management systems, and how they enable two-way communication between utilities and customers. It also discusses distribution automation and how it allows remote monitoring and control of distribution systems and devices. Finally, it provides an overview of SCADA systems and their role in energy management.

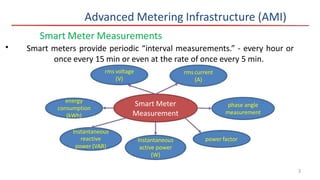
![Advanced Metering Infrastructure (AMI)
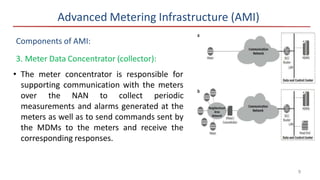
• AMI refers network infrastructure connecting smart meters, Meter Data Management System (MDMS)
and elements supporting communication between the smart meters and the MDMS. [1]
AMI
Utility DCCs
MDMS
Consumer
Smart
Meters
Communications
DCC: Data and Control Center
MDMS : Meter Data Management System
• AMR (Automated Meter Reading) systems allow meters to be read by utility personnel over wireless
links.
• It helps in reducing the cost associated with meter reading and also supports in billing process.
2](https://image.slidesharecdn.com/mudil-230713051824-24bdc115/85/MuDiL-ppt-3-320.jpg)
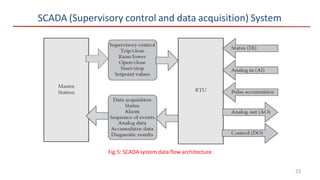
![SCADA (Supervisory control and data acquisition) System [2]
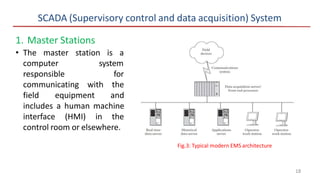
• SCADA refers to a system or a combination of systems that collects data
from various sensors at a plant or in other remote locations and then sends
these data to a central computer system, which then manages and controls
the data and remotely controls devices in the field.
• Components are:
• Master station --- at an energy control center (ECC)
• RTUs (Remote Terminal Units) --- at the power plants, transmission
and distribution substations,
distribution feeder equipment, etc.
• Communications system.
17](https://image.slidesharecdn.com/mudil-230713051824-24bdc115/85/MuDiL-ppt-12-320.jpg)