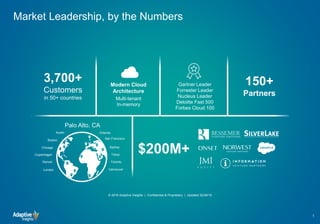
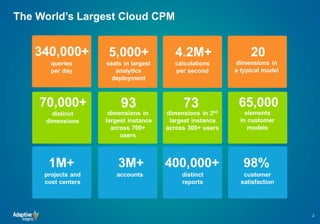
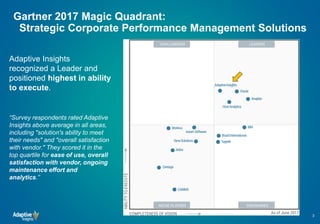
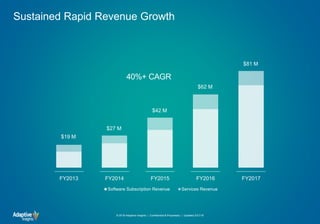
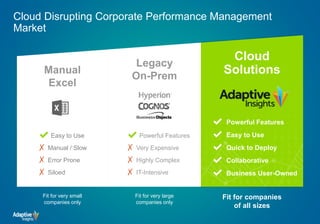
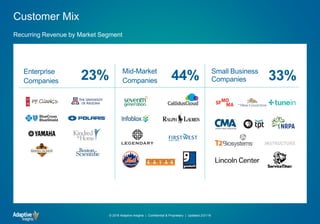
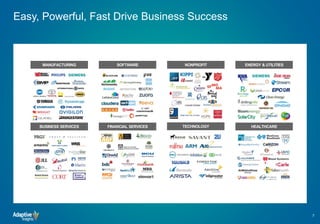
APPLYING TECHNOLOGY. DELIVERING BUSINESS CHANGE.MS IT Solutions
Adaptive Insights
Business Planning Cloud
June 2018
3,700+
Customers
in 50+ countries
Modern Cloud
Architecture
Multi-tenant
In-memory
150+
Partners
Gartner Leader
Forrester Leader
Nucleus Leader
Deloitte Fast 500
Forbes Cloud 100
Market Leadership, by the Numbers
1
Boston
Chicago
Palo Alto, CA
Sydney
London
Tokyo
Toronto
Copenhagen
Austin
Denver
Orlando
Vancouver
$200M+
San Francisco
© 2018 Adaptive Insights | Confidential & Proprietary | Updated 02/28/18
The World’s Largest Cloud CPM
2
Gartner 2017 Magic Quadrant:
Strategic Corporate Performance Management Solutions
3
Adaptive Insights
recognized a Leader and
positioned highest in ability
to execute.
“Survey respondents rated Adaptive
Insights above average in all areas,
including "solution's ability to meet
their needs" and "overall satisfaction
with vendor." They scored it in the
top quartile for ease of use, overall
satisfaction with vendor, ongoing
maintenance effort and
analytics.”
Sustained Rapid Revenue Growth
$19 M
$27 M
$42 M
$62 M
$81 M
FY2013 FY2014 FY2015 FY2016 FY2017
Software Subscription Revenue Services Revenue
40%+ CAGR
© 2018 Adaptive Insights | Confidential & Proprietary | Updated 2/21/18
✔ Powerful Features
✔ Easy to Use
✔ Quick to Deploy
✔ Collaborative
✔ Business User-Owned
Cloud
Solutions
Cloud Disrupting Corporate Performance Management
Market
✔ Powerful Features
✗ Very Expensive
✗ Highly Complex
✗ IT-Intensive
✔ Easy to Use
✗ Manual / Slow
✗ Error Prone
✗ Siloed
Manual
Excel
Legacy
On-Prem
Fit for companies
of all sizes
Fit for very small
companies only
Fit for very large
companies only
Customer Mix
© 2018 Adaptive Insights | Confidential & Proprietary | Updated 2/21/18
Recurring Revenue by Market Segment
Enterprise
Companies 23% Mid-Market
Companies 44% Small Business
Companies 33%
Easy, Powerful, Fast Drive Business Success
7
HEALTHCARE
MANUFACTURING
BUSINESS SERVICES
NONPROFITSOFTWARE ENERGY & UTILITIES
TECHNOLOGY
© 2018 Adaptive Insights | Confidential & Proprietary | Updated 04/13/18
FINANCIAL SERVICES
An active planning solution needs to be:
Model anything,
analyze everything
Model fast and
adapt quickly
Plan as a team
Integrated planning
& analytics
Rated #1 usability by all
industry analysts*
Adaptive Insights’ difference
Top ranked in time-to-
value and modeling
usability**
Easy
Powerful
and
Fast
and
© 2018 Adaptive Insights | Confidential & Proprietary | Updated 02/28/18 8
Business Planning Cloud Enables the Entire Process
Intuitive, Flexible &
Scalable Modeling
and Scenario Planning
Model
Financial & Operational
KPIs and Dashboards
Monitor
Operations, Management,
Board, Gov't Disclosures
Report
Variance Analysis, Ad Hoc
Analysis, Drill Anywhere
Analyze
9
© 2018 Adaptive Insights | Confidential & Proprietary | Updated 02/28/18
Adaptive Insights Business Planning Cloud
10
© 2018 Adaptive Insights | Confidential & Proprietary | Updated 02/28/18
Modeling, Reporting & Analytics Engine
Data Integration Framework
User Interaction: Sheets, Dashboards & Reports, Collaboration
Adaptive Insights
for Finance
Planning & Analysis • Consolidation
Functional
Planning
Workforce • Operational • Project
Adaptive Insights
for Sales
Quota & Capacity • Territory
Active Planning Process
12
Collaborative
Involves people closest to
customers and operations
Continuous
Ongoing, not annual
Comprehensive
Financial & operating plans and
analytics
© 2018 Adaptive Insights | Confidential & Proprietary | Updated 02/28/18
Journey: Static to Active Planning
© 2018 Adaptive Insights | Confidential & Proprietary | Updated 2/21/18
Business Planning
Partnership
Scenario Analysis
Active Planning
Operational Drivers
and Data
Engagement
Forecasting
Optimized Planning
Reporting
Budgeting
Participation
Modernized Planning
COMPREHENSIVE
COLLABORATIVE
CONTINUOUS
COMPREHENSIVE
COLLABORATIVE
CONTINUOUS
Many Paths to Active Planning
© 2018 Adaptive Insights | Confidential & Proprietary | Updated 2/21/18
Expense
Personnel
Planning
BS/CF
Financial
Reporting
Financial
Metrics & KPIs
Rolling
Forecasts
Executive
Dashboard
Profitability
Analysis
Sales
Forecasting
Driver-based
Models
Cross-functional
Planning
Segment Analysis
M&A Analysis
Operational
Metrics
Enterprise
Metrics & KPIs
Revenue
Planning
Zero-based
Budgeting
P&L
Financial Data
Integration
Operational
Planning
Financial
Consolidation
Capital
Planning
Scenario
Analysis
Modernized Planning Optimized Planning
Active Planning
15
PhasedImplementation Approach
Phase 1:
High Level
Financial
Planning
~4 weeks
Phase 2:
Detailed Financial
Planning
~6 weeks
Phase 3:
Operational
Planning
~4-6 weeks
Phase 1.A:
Financial
Consolidation
~3 weeks
Implementation approach can be tailored in line with customer’s journey
towards Active Planning.
1) Progressively add capabilities (e.g. Expense, Personnel Planning,
Rolling Forecast, Dashboard).
2) Start from Finance, progressively layer in more detail as follows:
16
Deployment Packages(1/2)
Scope
Considerations
Stage 1 – High Level
Financial Planning
Stage 2 – Detailed
Financial Planning
Stage 3 – Operational
Planning
Stage 1.A – Financial
Consolidation
Number of Models • 1 x P&L Manual Input
Model
• 1 x B/S Manual Input
Model
• 1 x Cash Flow Input
Model
• 1 x Currency Translation
Model
• 1 x OPEX planning Model
• 1 x HR Model
• 1 x CAPEX Model
• 1 x Revenue Model
• 1 x COGS Model
• 1 x Legal Consolidation
Number of Drivers • GL level • 15~ • 10~ • GL Level
Implementation
Timeline
• 4 weeks • 6 weeks • 4-6 weeks~ • 3 weeks
Number of Input
Forms
• 5 • 10 • 10 • 2
Number of Reports • 5 ( 1 Report equivalent to
1 excel sheet)
• 10 ( 1 Report equivalent to 1
excel sheet)
• 10 ( 1 Report
equivalent to 1 excel
sheet)
• 10
Number of Discovery
Dashboards
• 5 objects ( 1 object
equivalent to 1 chart)
• N / A • N / A • N / A
Planning Granularity • Chart of accounts (COA)
for P&L and B/S
• Indirect cash flow
accounts
• OPEX planned at Driver
Level
• HR cost planned by job type
• CAPEX planned by asset
class
• Based on 1 line of
Business
• Entity Code
• Group CoA
• Trading Partner /
Intercompany
Our pre-packaged solution offers the following proposed scope with pre-defined comprehensive Planning &
Consolidation functionalities:
18
Activities
Month 1 Month 2 Month 3 Month 4 Month 5
Wk1 Wk2 Wk3 Wk4 Wk5 Wk6 Wk7 Wk8 Wk9 Wk10 Wk11 Wk12 Wk13 Wk14 Wk15 Wk16 Wk17 Wk18 Wk19
Kick off &
Stakeholder
Onboarding
Design &
Prototyping
Developme
nt, Batch
Testing &
Break Fix
Handover
System Go-Live
by Stages
Timeline
Below timeline outlines our proposed phased implementation plan.
Iterative
Authorization
& Clean Up
Stage 1
High Level Financial
Planning
Key User
Estimated Time
Commitment
• 40-60% during Design ( 2-3 days a week)
• 30-40% during Development (1.5-2 days a week)
• As required for training
Stage 2
Detailed Financial
Planning
Stage 3
Operational
Planning
1 week Design &
Scope Confirmation
6 weeks
development
Authorization
& Clean Up
4-6 weeks
development
Authorization
& Clean Up
2 weeks
development
Stage 1.A
Financial
Consolidation
1 week
dev
Authorization
& Clean Up
19
ClientValueRealization
Stage 2 + 3 – Detailed
Financial Planning
& Operational Planning
• Driver based planning- increasing
depth to planned information in Phase 1
• Ability to perform what-if simulation of
Costs based on Key Value Drivers
• Increased Data Granularity Analytics
• Full automation of P&L accounts for
planning
• Streamline bottom-up and top-down
key financial and operational planning
processes using single application
Stage 1 – High Level
Financial Planning
• Financial Data visibility &
transparency
• Single system to capture all data,
eliminating data duplication and multiple
stand alone data SILO
• Real time aggregation and calculation of
data with ZERO errors
• Comparative & Variance Analysis based
on harmonized data standards
• Automation of currency translation
• Dynamic and formatted financial
statements
• CFO Cockpit Dashboards
Stage 1.A - Financial
Consolidation
• Integrated platform to automate
tedious steps within the financial
consolidation and reporting
process
• Perform Real Time
Consolidation based on Actual,
Forecast or Budget Data
• Standardize the consolidation of
the Group’s financial position
and results
• Audit trail capability for ease of
data traceability
• Accelerate financial closing
time from weeks to days
With packaged deployment, our goal is to allow client’s to generate “greatest value in shortest time”
possible. Below are some of the benefits our clients can expect at completion of each stage of an EPM
technology implementation…
MS IT Solutions Pte. Ltd. is an associate of Moore Stephens International Limited, a leading accounting and consulting
association with member firms in principal cities throughout the world.
About Moore Stephens globally
Since Moore Stephens London was founded a century ago, Moore Stephens International Limited has grown to be one
of the largest international accounting and consulting groups worldwide. Today the network comprises 657 offices in
106 countries throughout the world, incorporating 27,613 people and with fees of more than US$2.660 billion. You can
be confident that we have the resources and capabilities to meet your needs.
© 2017 Moore Stephens IT Solutions Pte. Ltd.

MSIT Adaptive Insights Brochure 2018

  • 1.
    APPLYING TECHNOLOGY. DELIVERINGBUSINESS CHANGE.MS IT Solutions Adaptive Insights Business Planning Cloud June 2018
  • 2.
    3,700+ Customers in 50+ countries ModernCloud Architecture Multi-tenant In-memory 150+ Partners Gartner Leader Forrester Leader Nucleus Leader Deloitte Fast 500 Forbes Cloud 100 Market Leadership, by the Numbers 1 Boston Chicago Palo Alto, CA Sydney London Tokyo Toronto Copenhagen Austin Denver Orlando Vancouver $200M+ San Francisco © 2018 Adaptive Insights | Confidential & Proprietary | Updated 02/28/18
  • 3.
  • 4.
    Gartner 2017 MagicQuadrant: Strategic Corporate Performance Management Solutions 3 Adaptive Insights recognized a Leader and positioned highest in ability to execute. “Survey respondents rated Adaptive Insights above average in all areas, including "solution's ability to meet their needs" and "overall satisfaction with vendor." They scored it in the top quartile for ease of use, overall satisfaction with vendor, ongoing maintenance effort and analytics.”
  • 5.
    Sustained Rapid RevenueGrowth $19 M $27 M $42 M $62 M $81 M FY2013 FY2014 FY2015 FY2016 FY2017 Software Subscription Revenue Services Revenue 40%+ CAGR © 2018 Adaptive Insights | Confidential & Proprietary | Updated 2/21/18
  • 6.
    ✔ Powerful Features ✔Easy to Use ✔ Quick to Deploy ✔ Collaborative ✔ Business User-Owned Cloud Solutions Cloud Disrupting Corporate Performance Management Market ✔ Powerful Features ✗ Very Expensive ✗ Highly Complex ✗ IT-Intensive ✔ Easy to Use ✗ Manual / Slow ✗ Error Prone ✗ Siloed Manual Excel Legacy On-Prem Fit for companies of all sizes Fit for very small companies only Fit for very large companies only
  • 7.
    Customer Mix © 2018Adaptive Insights | Confidential & Proprietary | Updated 2/21/18 Recurring Revenue by Market Segment Enterprise Companies 23% Mid-Market Companies 44% Small Business Companies 33%
  • 8.
    Easy, Powerful, FastDrive Business Success 7 HEALTHCARE MANUFACTURING BUSINESS SERVICES NONPROFITSOFTWARE ENERGY & UTILITIES TECHNOLOGY © 2018 Adaptive Insights | Confidential & Proprietary | Updated 04/13/18 FINANCIAL SERVICES
  • 9.
    An active planningsolution needs to be: Model anything, analyze everything Model fast and adapt quickly Plan as a team Integrated planning & analytics Rated #1 usability by all industry analysts* Adaptive Insights’ difference Top ranked in time-to- value and modeling usability** Easy Powerful and Fast and © 2018 Adaptive Insights | Confidential & Proprietary | Updated 02/28/18 8
  • 10.
    Business Planning CloudEnables the Entire Process Intuitive, Flexible & Scalable Modeling and Scenario Planning Model Financial & Operational KPIs and Dashboards Monitor Operations, Management, Board, Gov't Disclosures Report Variance Analysis, Ad Hoc Analysis, Drill Anywhere Analyze 9 © 2018 Adaptive Insights | Confidential & Proprietary | Updated 02/28/18
  • 11.
    Adaptive Insights BusinessPlanning Cloud 10 © 2018 Adaptive Insights | Confidential & Proprietary | Updated 02/28/18 Modeling, Reporting & Analytics Engine Data Integration Framework User Interaction: Sheets, Dashboards & Reports, Collaboration Adaptive Insights for Finance Planning & Analysis • Consolidation Functional Planning Workforce • Operational • Project Adaptive Insights for Sales Quota & Capacity • Territory
  • 12.
    Active Planning Process 12 Collaborative Involvespeople closest to customers and operations Continuous Ongoing, not annual Comprehensive Financial & operating plans and analytics © 2018 Adaptive Insights | Confidential & Proprietary | Updated 02/28/18
  • 13.
    Journey: Static toActive Planning © 2018 Adaptive Insights | Confidential & Proprietary | Updated 2/21/18 Business Planning Partnership Scenario Analysis Active Planning Operational Drivers and Data Engagement Forecasting Optimized Planning Reporting Budgeting Participation Modernized Planning COMPREHENSIVE COLLABORATIVE CONTINUOUS COMPREHENSIVE COLLABORATIVE CONTINUOUS
  • 14.
    Many Paths toActive Planning © 2018 Adaptive Insights | Confidential & Proprietary | Updated 2/21/18 Expense Personnel Planning BS/CF Financial Reporting Financial Metrics & KPIs Rolling Forecasts Executive Dashboard Profitability Analysis Sales Forecasting Driver-based Models Cross-functional Planning Segment Analysis M&A Analysis Operational Metrics Enterprise Metrics & KPIs Revenue Planning Zero-based Budgeting P&L Financial Data Integration Operational Planning Financial Consolidation Capital Planning Scenario Analysis Modernized Planning Optimized Planning Active Planning
  • 15.
    15 PhasedImplementation Approach Phase 1: HighLevel Financial Planning ~4 weeks Phase 2: Detailed Financial Planning ~6 weeks Phase 3: Operational Planning ~4-6 weeks Phase 1.A: Financial Consolidation ~3 weeks Implementation approach can be tailored in line with customer’s journey towards Active Planning. 1) Progressively add capabilities (e.g. Expense, Personnel Planning, Rolling Forecast, Dashboard). 2) Start from Finance, progressively layer in more detail as follows:
  • 16.
    16 Deployment Packages(1/2) Scope Considerations Stage 1– High Level Financial Planning Stage 2 – Detailed Financial Planning Stage 3 – Operational Planning Stage 1.A – Financial Consolidation Number of Models • 1 x P&L Manual Input Model • 1 x B/S Manual Input Model • 1 x Cash Flow Input Model • 1 x Currency Translation Model • 1 x OPEX planning Model • 1 x HR Model • 1 x CAPEX Model • 1 x Revenue Model • 1 x COGS Model • 1 x Legal Consolidation Number of Drivers • GL level • 15~ • 10~ • GL Level Implementation Timeline • 4 weeks • 6 weeks • 4-6 weeks~ • 3 weeks Number of Input Forms • 5 • 10 • 10 • 2 Number of Reports • 5 ( 1 Report equivalent to 1 excel sheet) • 10 ( 1 Report equivalent to 1 excel sheet) • 10 ( 1 Report equivalent to 1 excel sheet) • 10 Number of Discovery Dashboards • 5 objects ( 1 object equivalent to 1 chart) • N / A • N / A • N / A Planning Granularity • Chart of accounts (COA) for P&L and B/S • Indirect cash flow accounts • OPEX planned at Driver Level • HR cost planned by job type • CAPEX planned by asset class • Based on 1 line of Business • Entity Code • Group CoA • Trading Partner / Intercompany Our pre-packaged solution offers the following proposed scope with pre-defined comprehensive Planning & Consolidation functionalities:
  • 17.
    18 Activities Month 1 Month2 Month 3 Month 4 Month 5 Wk1 Wk2 Wk3 Wk4 Wk5 Wk6 Wk7 Wk8 Wk9 Wk10 Wk11 Wk12 Wk13 Wk14 Wk15 Wk16 Wk17 Wk18 Wk19 Kick off & Stakeholder Onboarding Design & Prototyping Developme nt, Batch Testing & Break Fix Handover System Go-Live by Stages Timeline Below timeline outlines our proposed phased implementation plan. Iterative Authorization & Clean Up Stage 1 High Level Financial Planning Key User Estimated Time Commitment • 40-60% during Design ( 2-3 days a week) • 30-40% during Development (1.5-2 days a week) • As required for training Stage 2 Detailed Financial Planning Stage 3 Operational Planning 1 week Design & Scope Confirmation 6 weeks development Authorization & Clean Up 4-6 weeks development Authorization & Clean Up 2 weeks development Stage 1.A Financial Consolidation 1 week dev Authorization & Clean Up
  • 18.
    19 ClientValueRealization Stage 2 +3 – Detailed Financial Planning & Operational Planning • Driver based planning- increasing depth to planned information in Phase 1 • Ability to perform what-if simulation of Costs based on Key Value Drivers • Increased Data Granularity Analytics • Full automation of P&L accounts for planning • Streamline bottom-up and top-down key financial and operational planning processes using single application Stage 1 – High Level Financial Planning • Financial Data visibility & transparency • Single system to capture all data, eliminating data duplication and multiple stand alone data SILO • Real time aggregation and calculation of data with ZERO errors • Comparative & Variance Analysis based on harmonized data standards • Automation of currency translation • Dynamic and formatted financial statements • CFO Cockpit Dashboards Stage 1.A - Financial Consolidation • Integrated platform to automate tedious steps within the financial consolidation and reporting process • Perform Real Time Consolidation based on Actual, Forecast or Budget Data • Standardize the consolidation of the Group’s financial position and results • Audit trail capability for ease of data traceability • Accelerate financial closing time from weeks to days With packaged deployment, our goal is to allow client’s to generate “greatest value in shortest time” possible. Below are some of the benefits our clients can expect at completion of each stage of an EPM technology implementation…
  • 19.
    MS IT SolutionsPte. Ltd. is an associate of Moore Stephens International Limited, a leading accounting and consulting association with member firms in principal cities throughout the world. About Moore Stephens globally Since Moore Stephens London was founded a century ago, Moore Stephens International Limited has grown to be one of the largest international accounting and consulting groups worldwide. Today the network comprises 657 offices in 106 countries throughout the world, incorporating 27,613 people and with fees of more than US$2.660 billion. You can be confident that we have the resources and capabilities to meet your needs. © 2017 Moore Stephens IT Solutions Pte. Ltd.