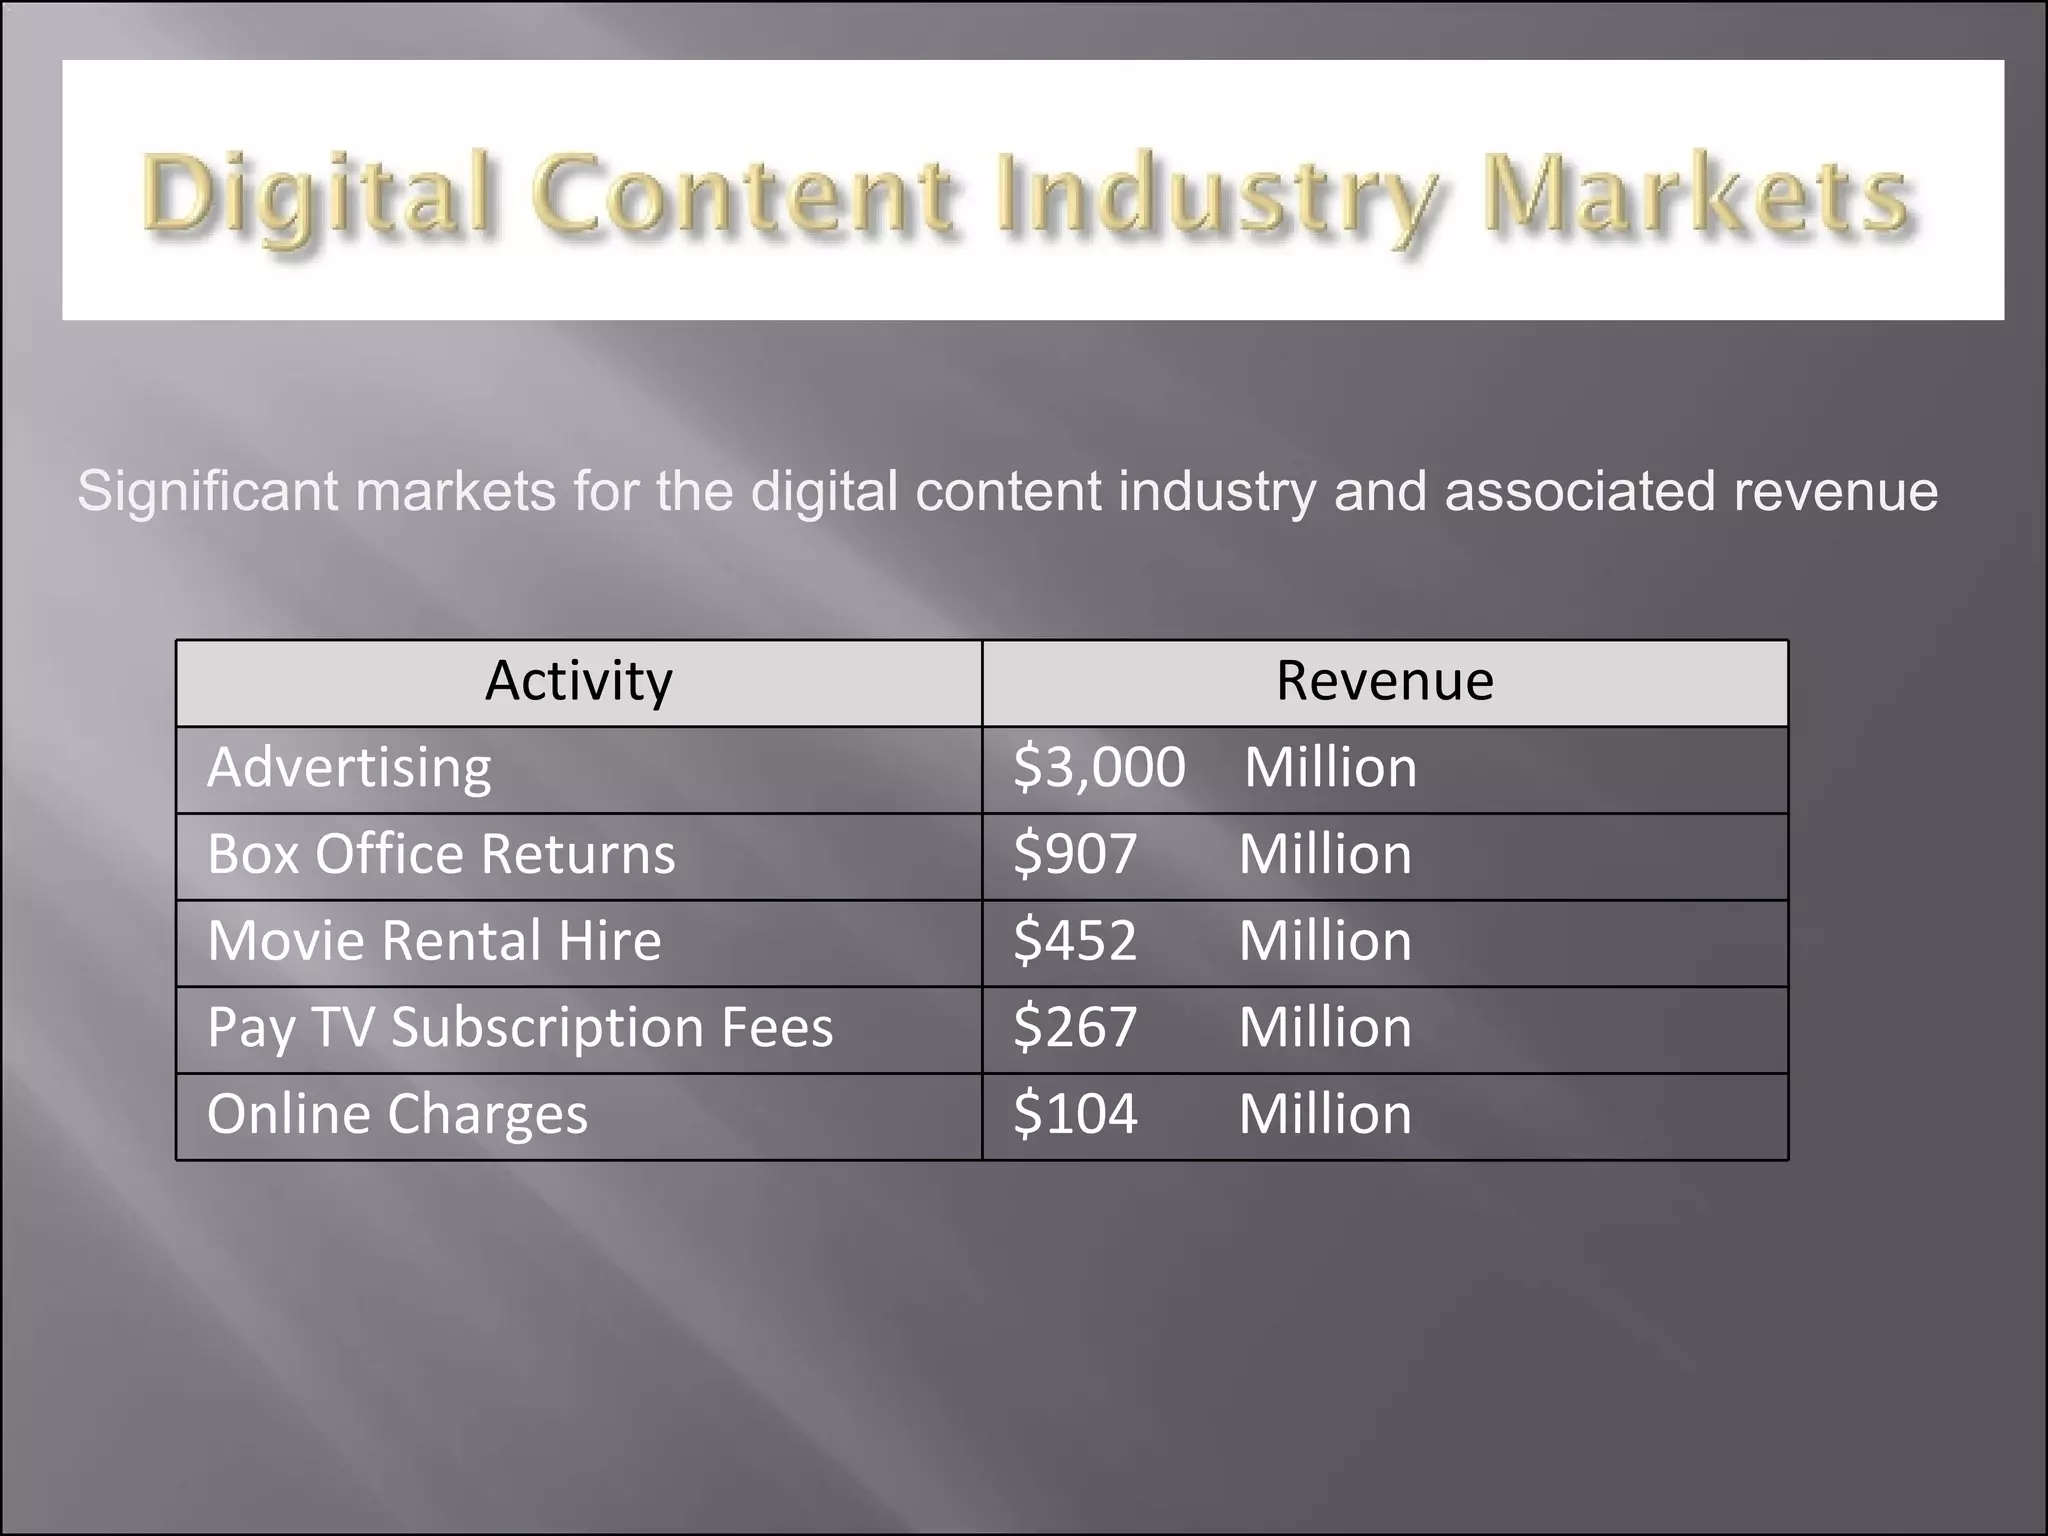
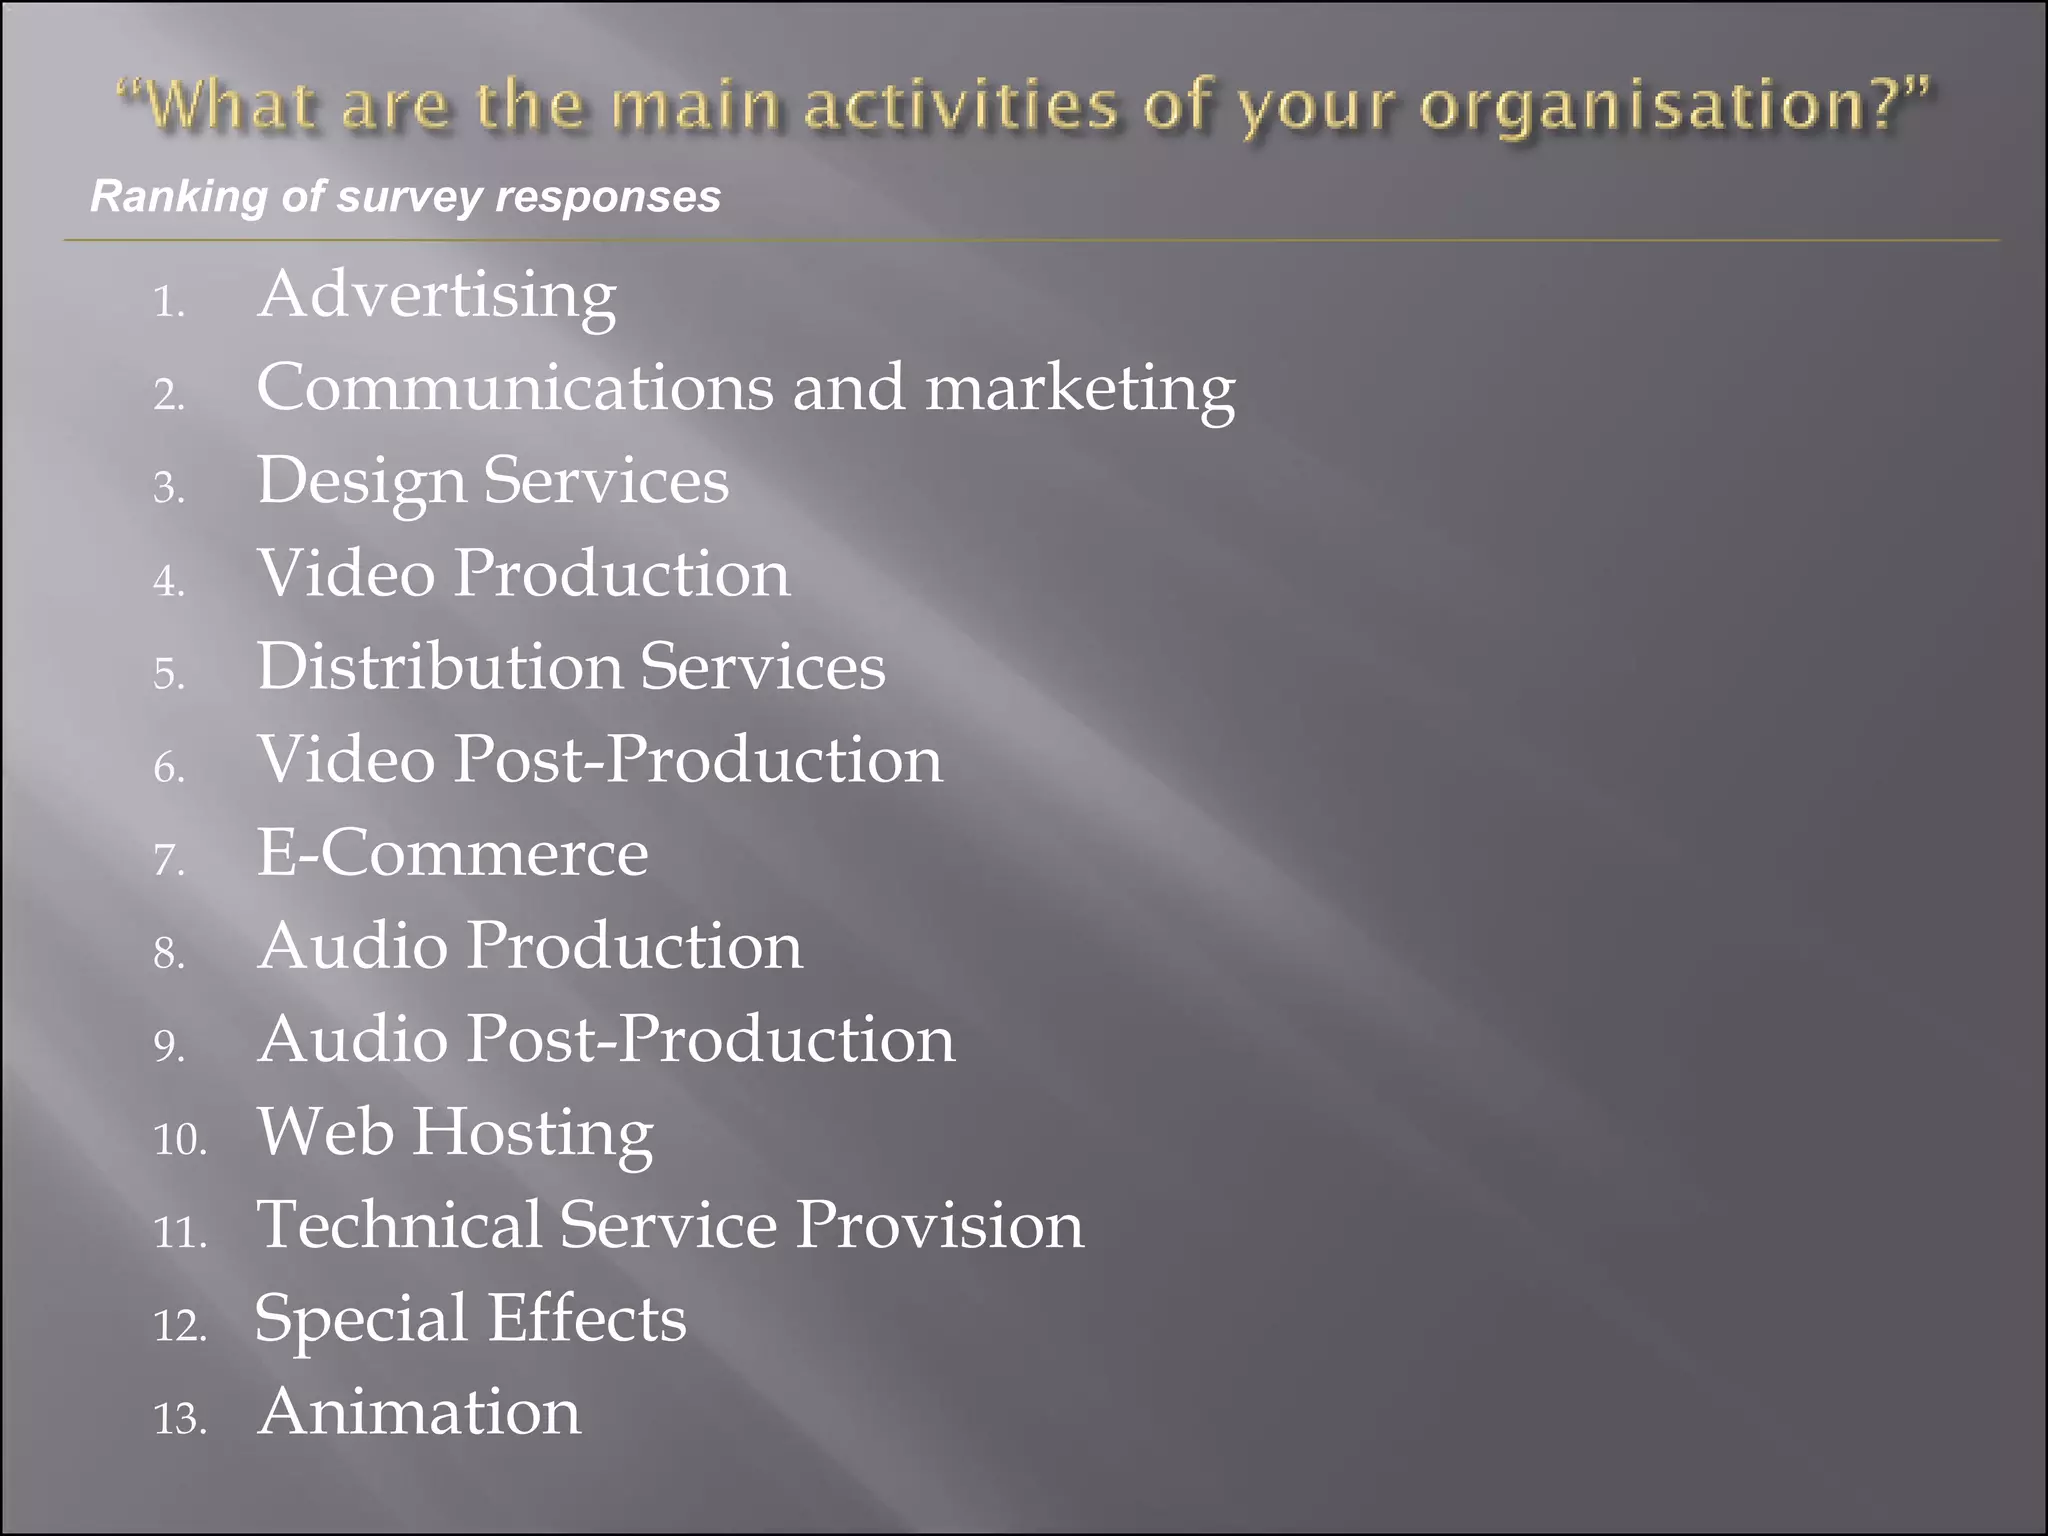
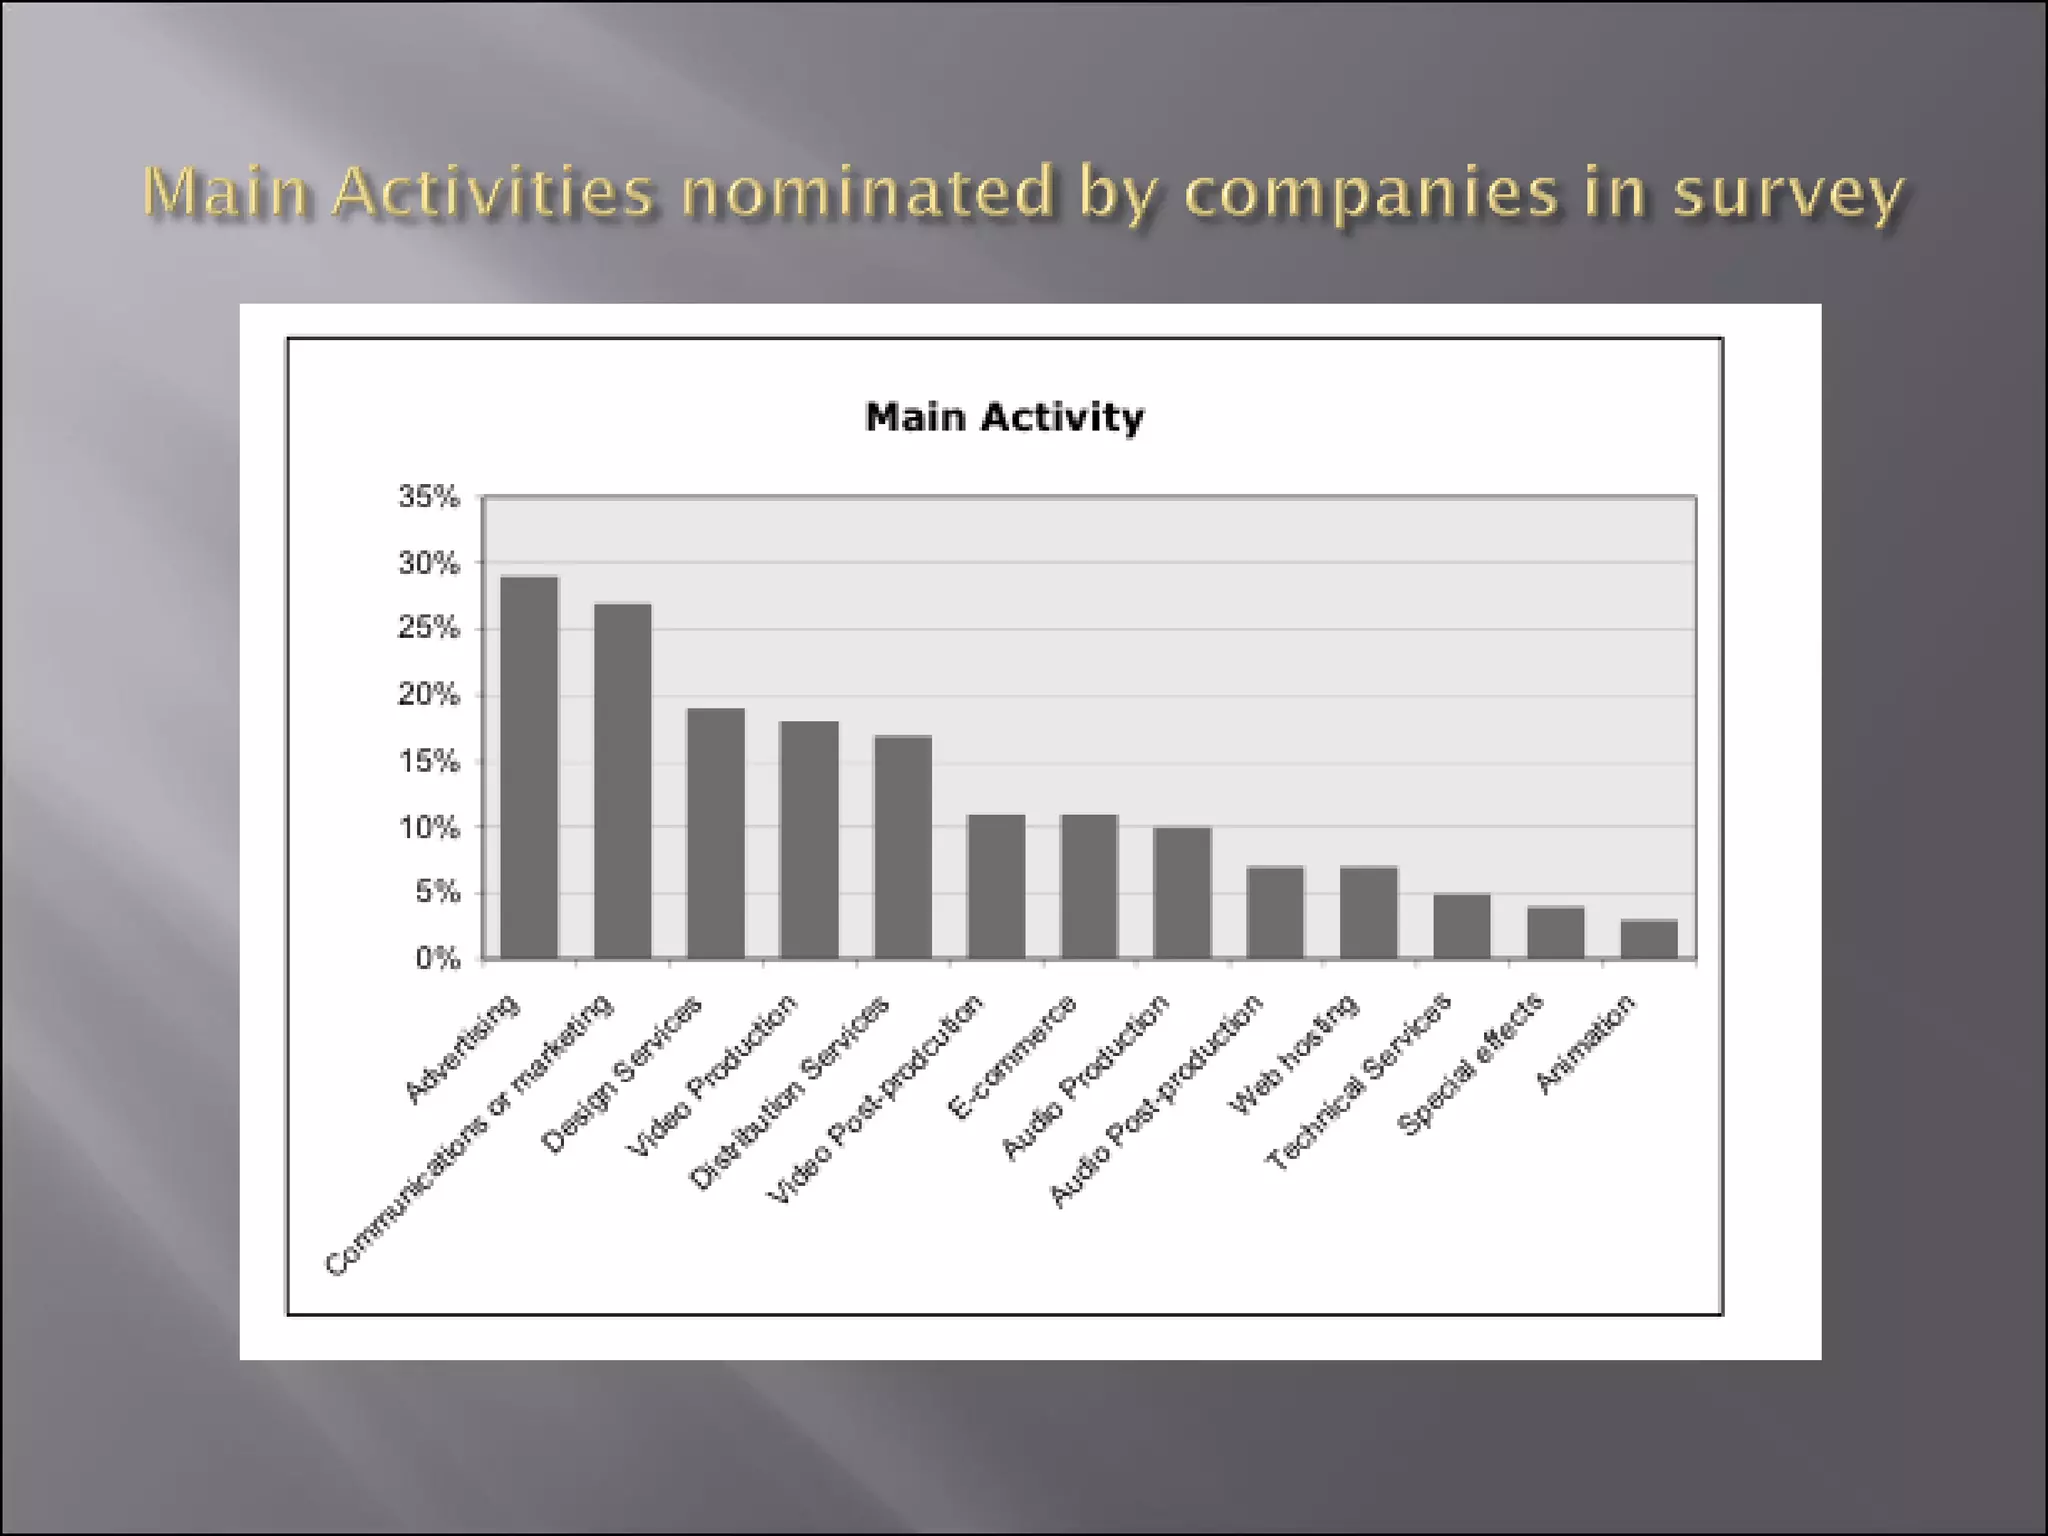
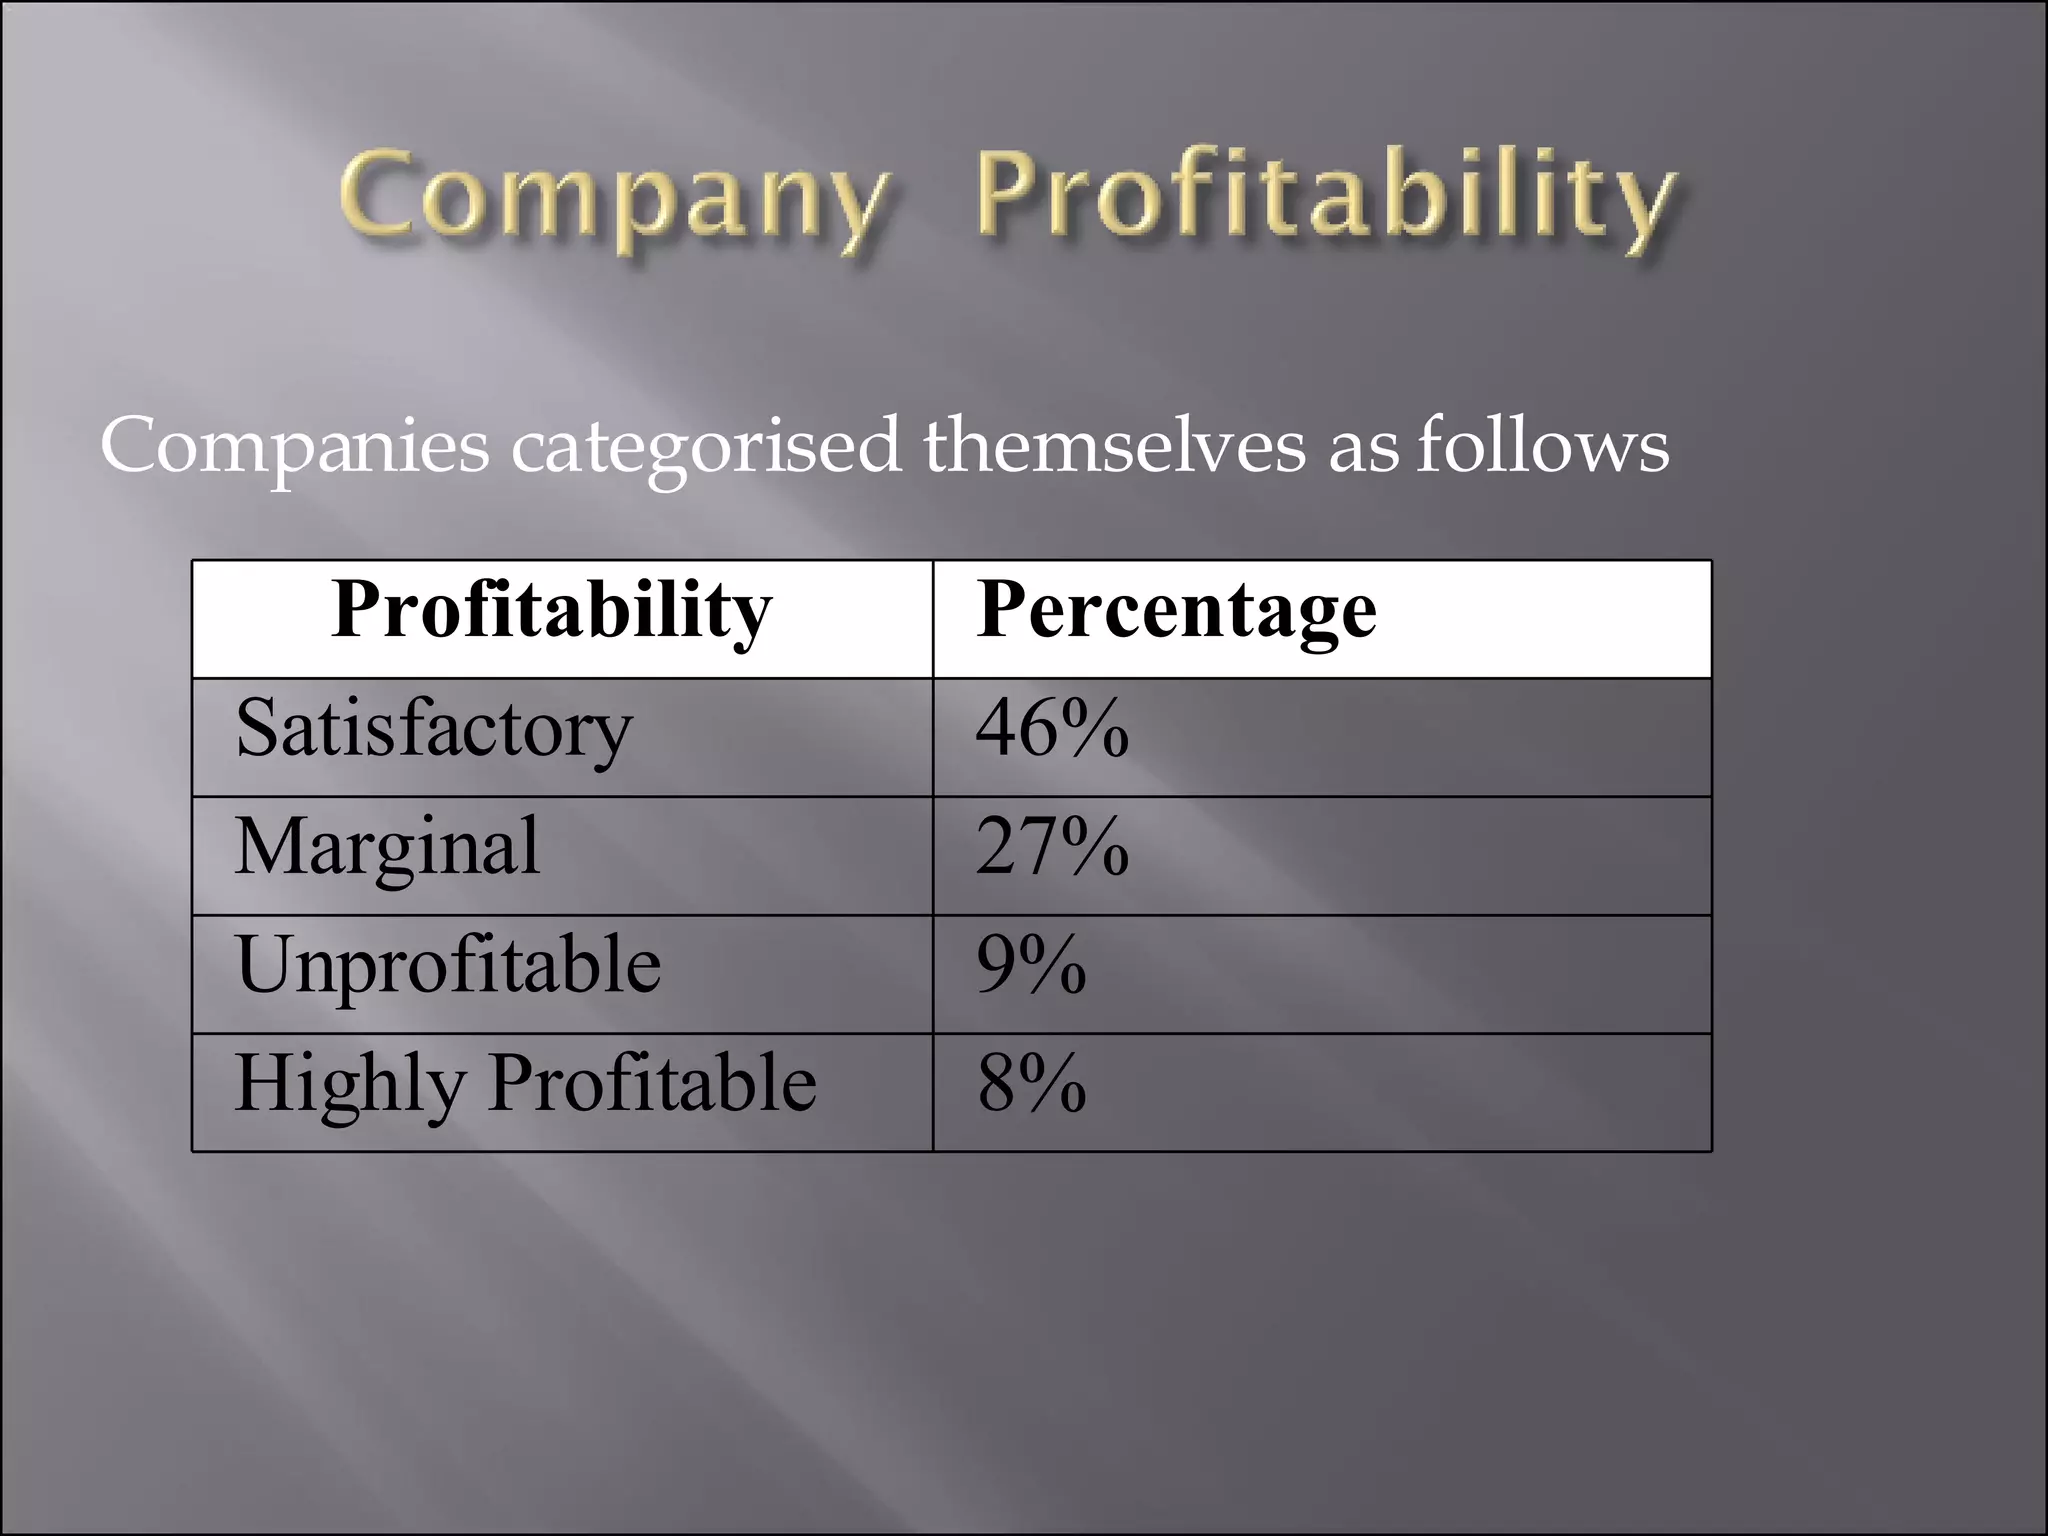
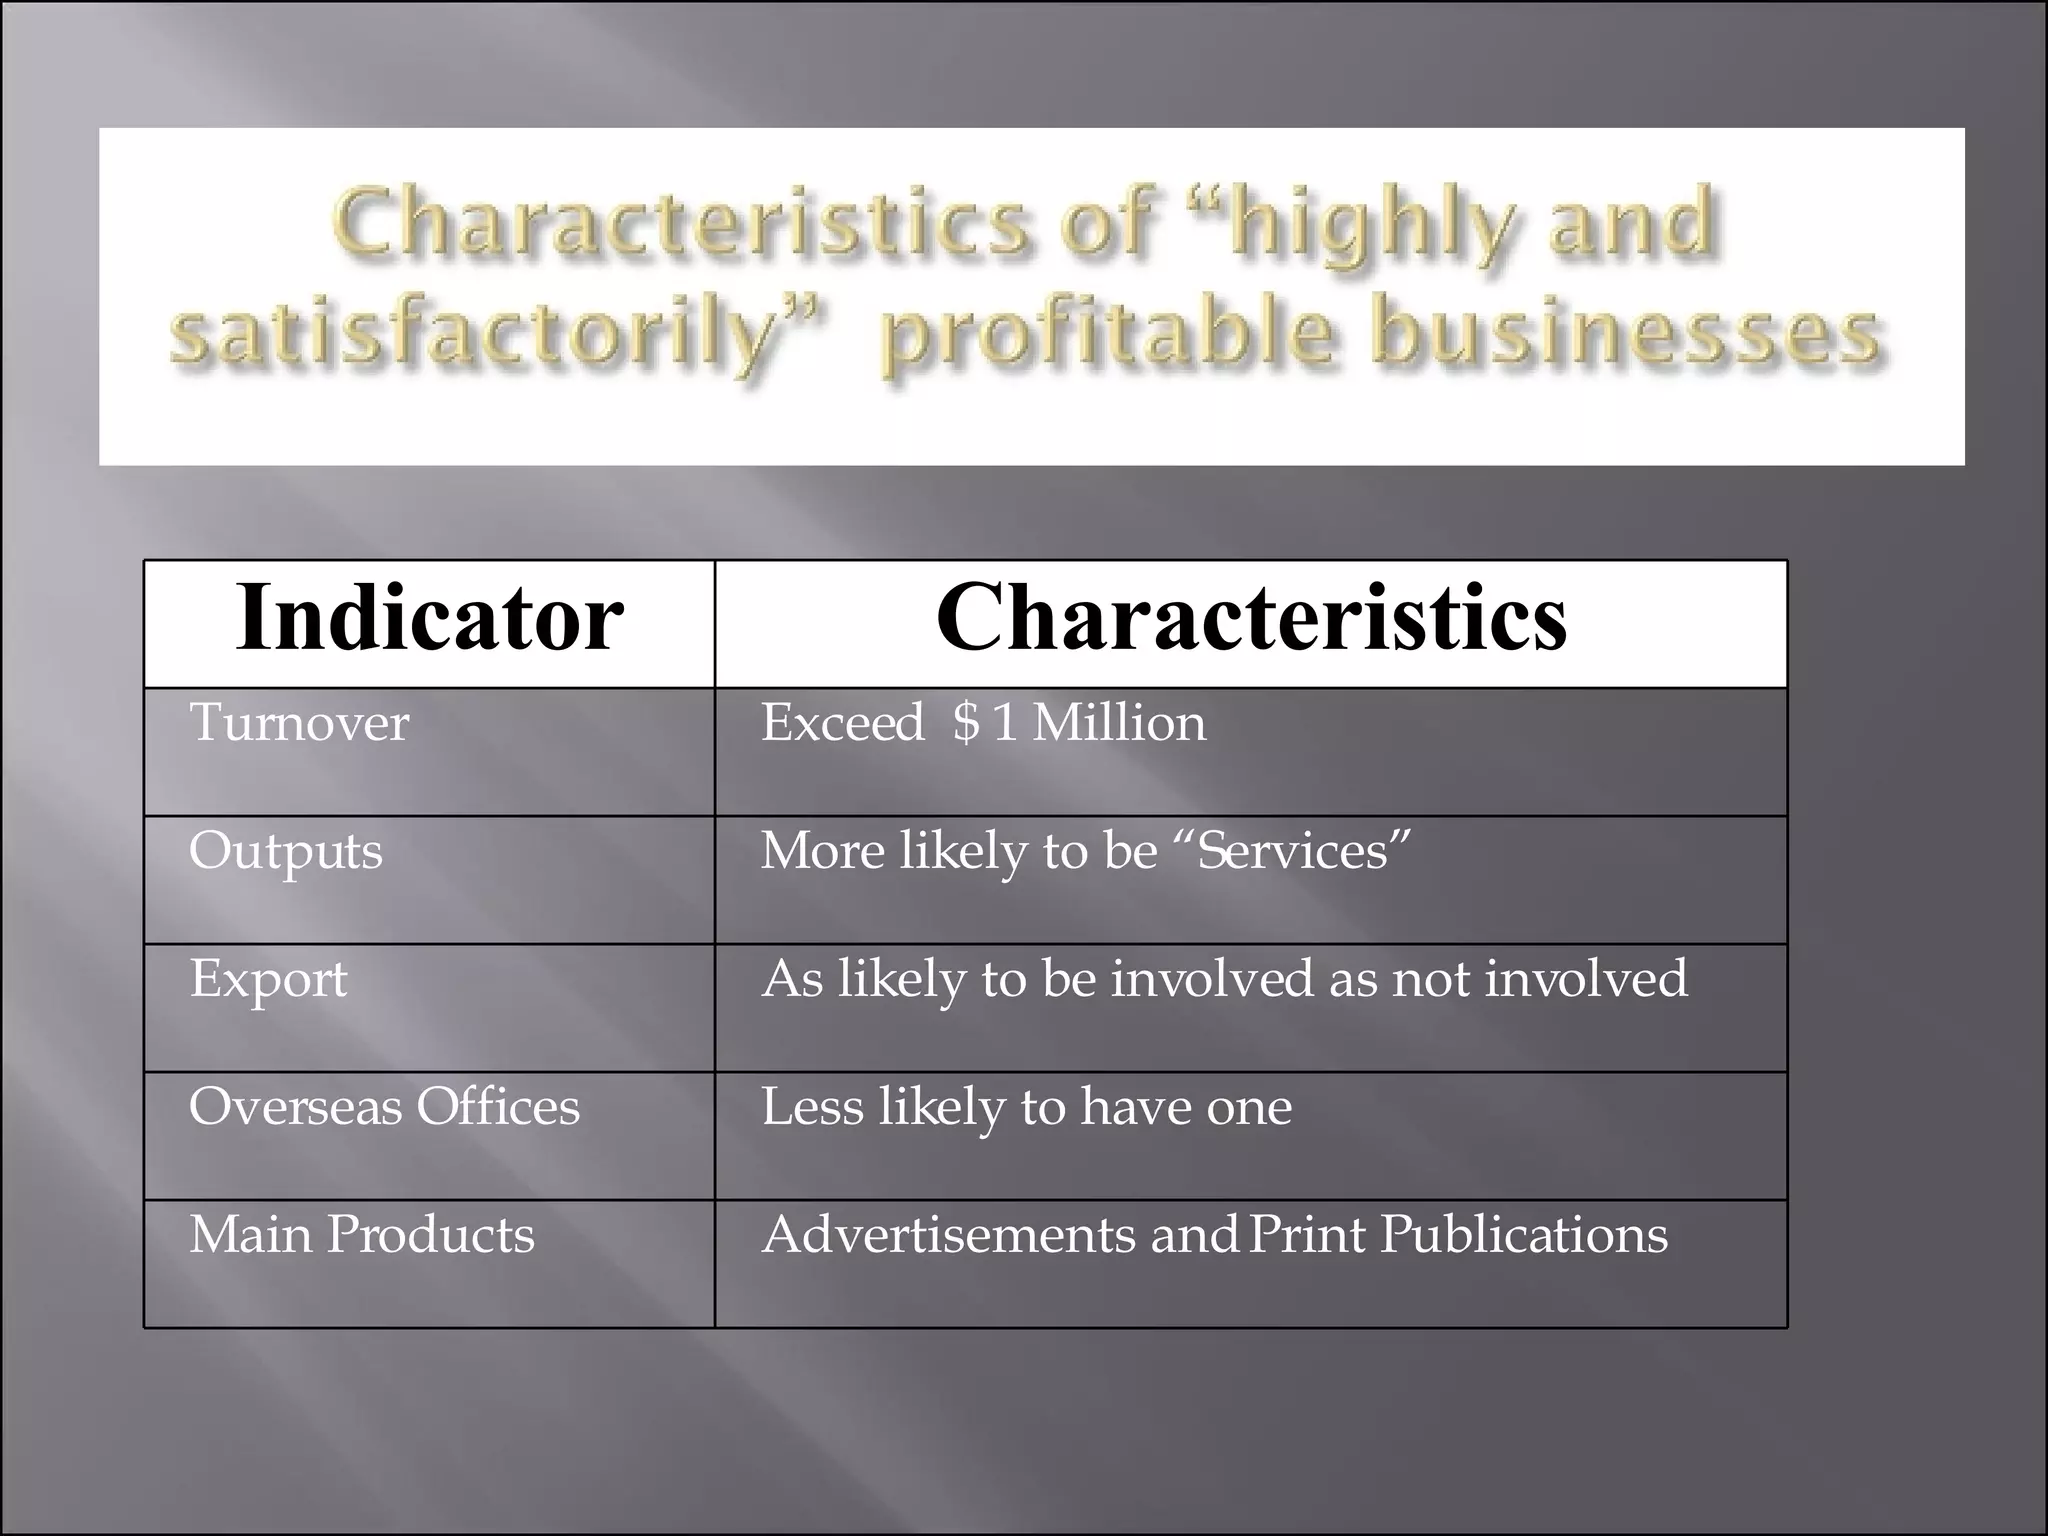
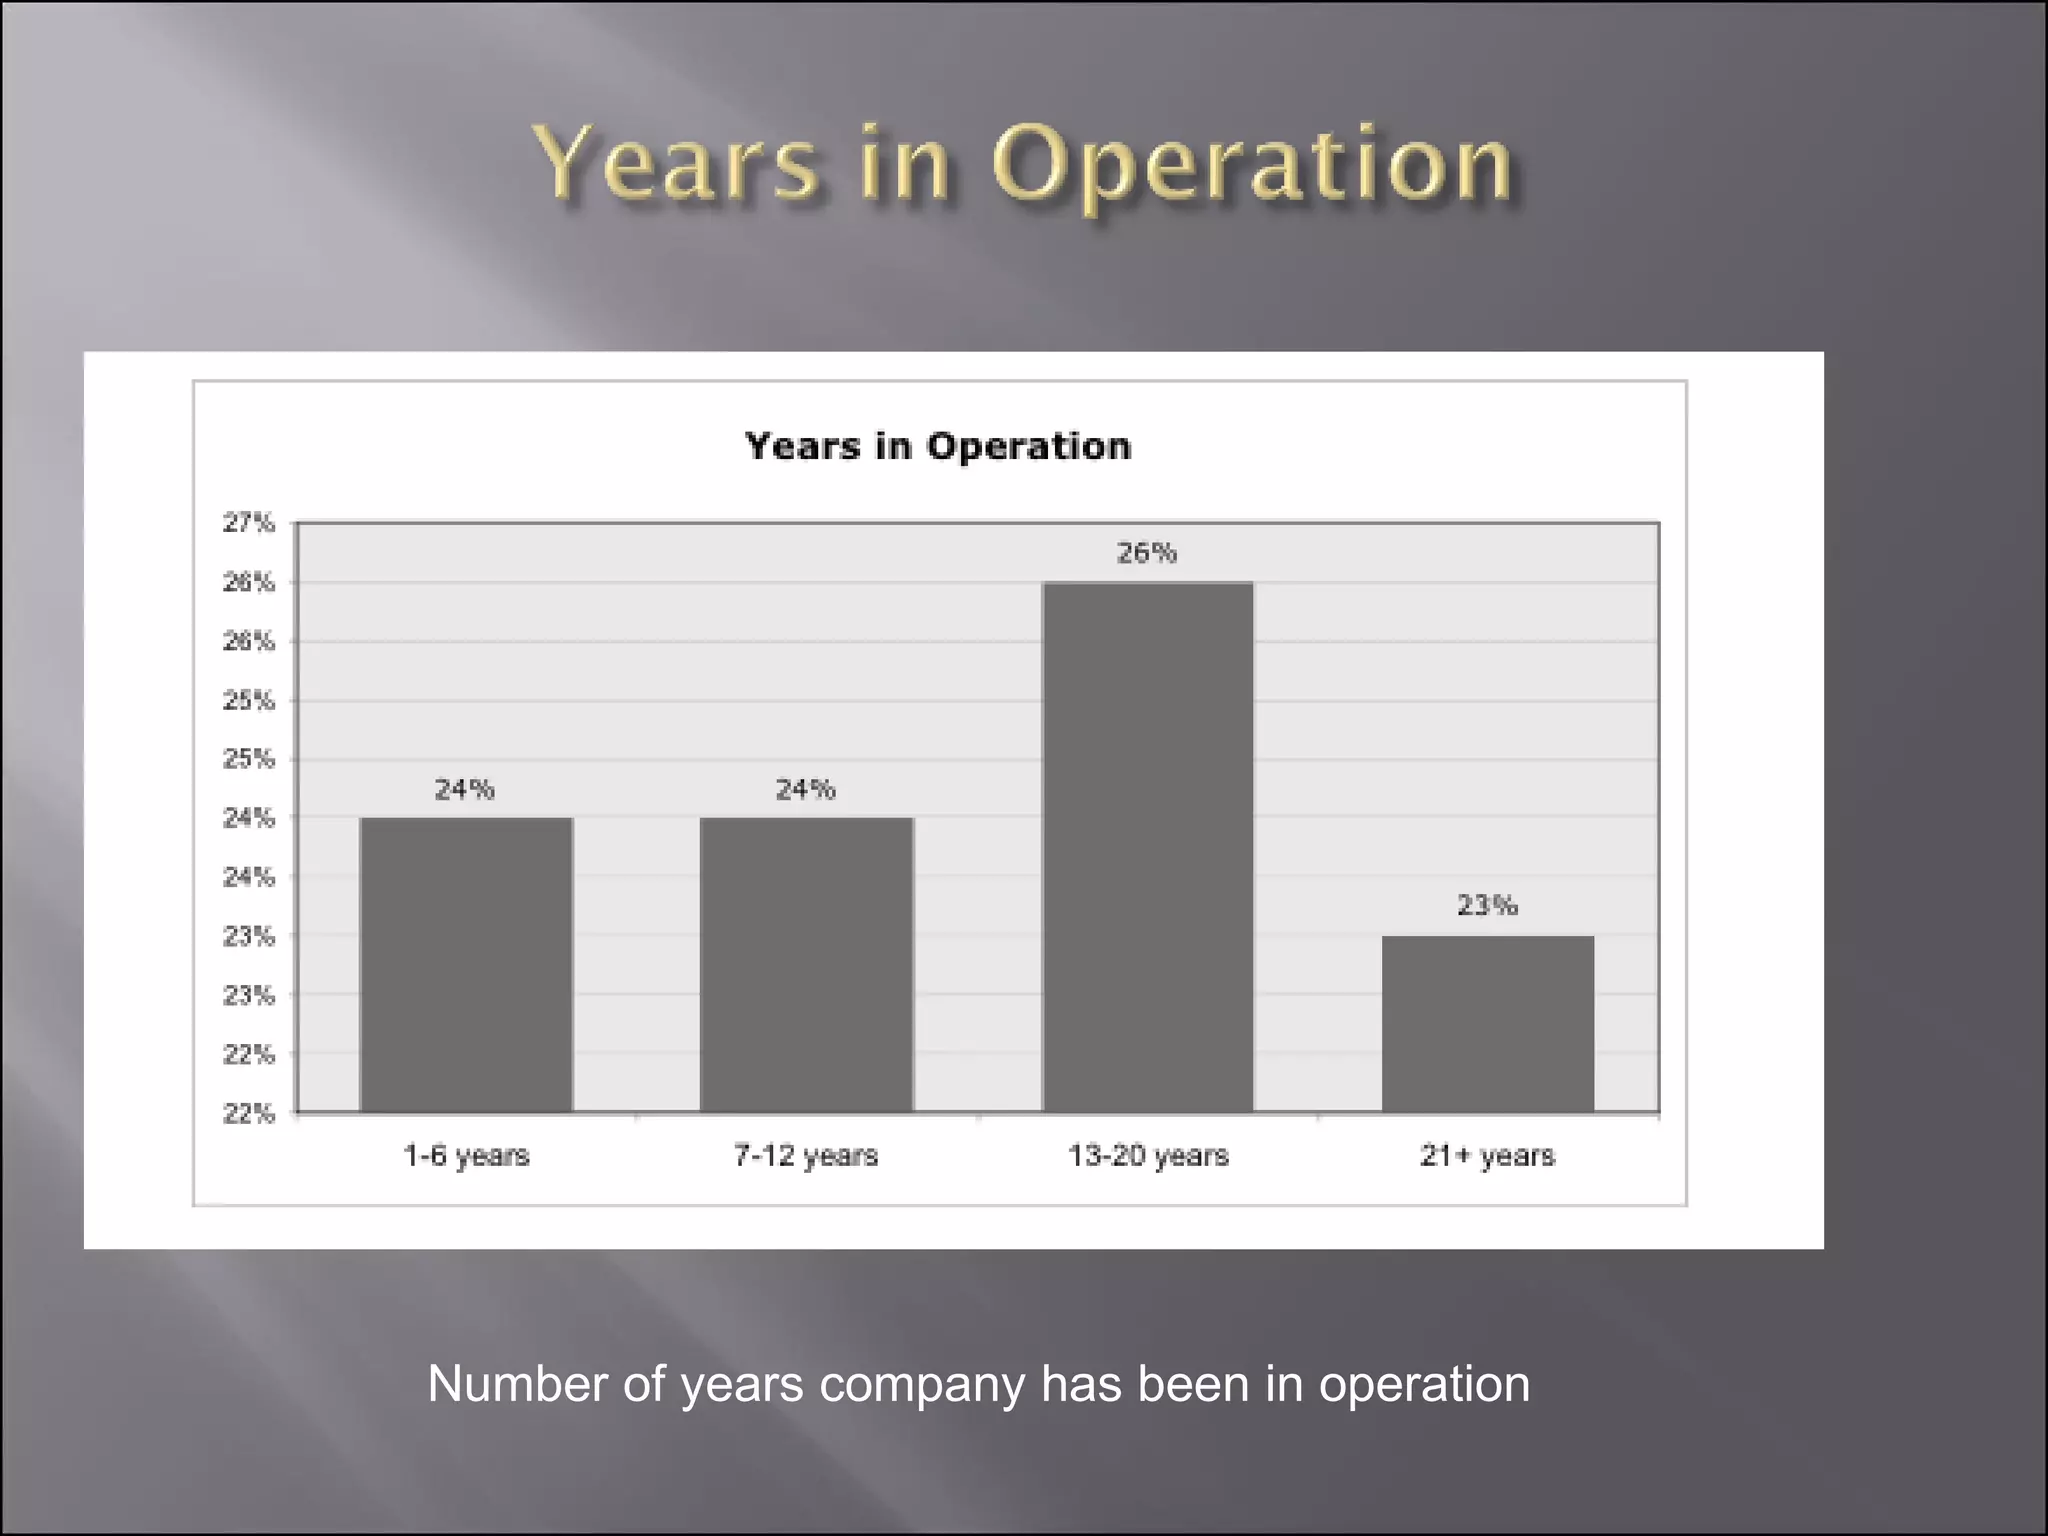
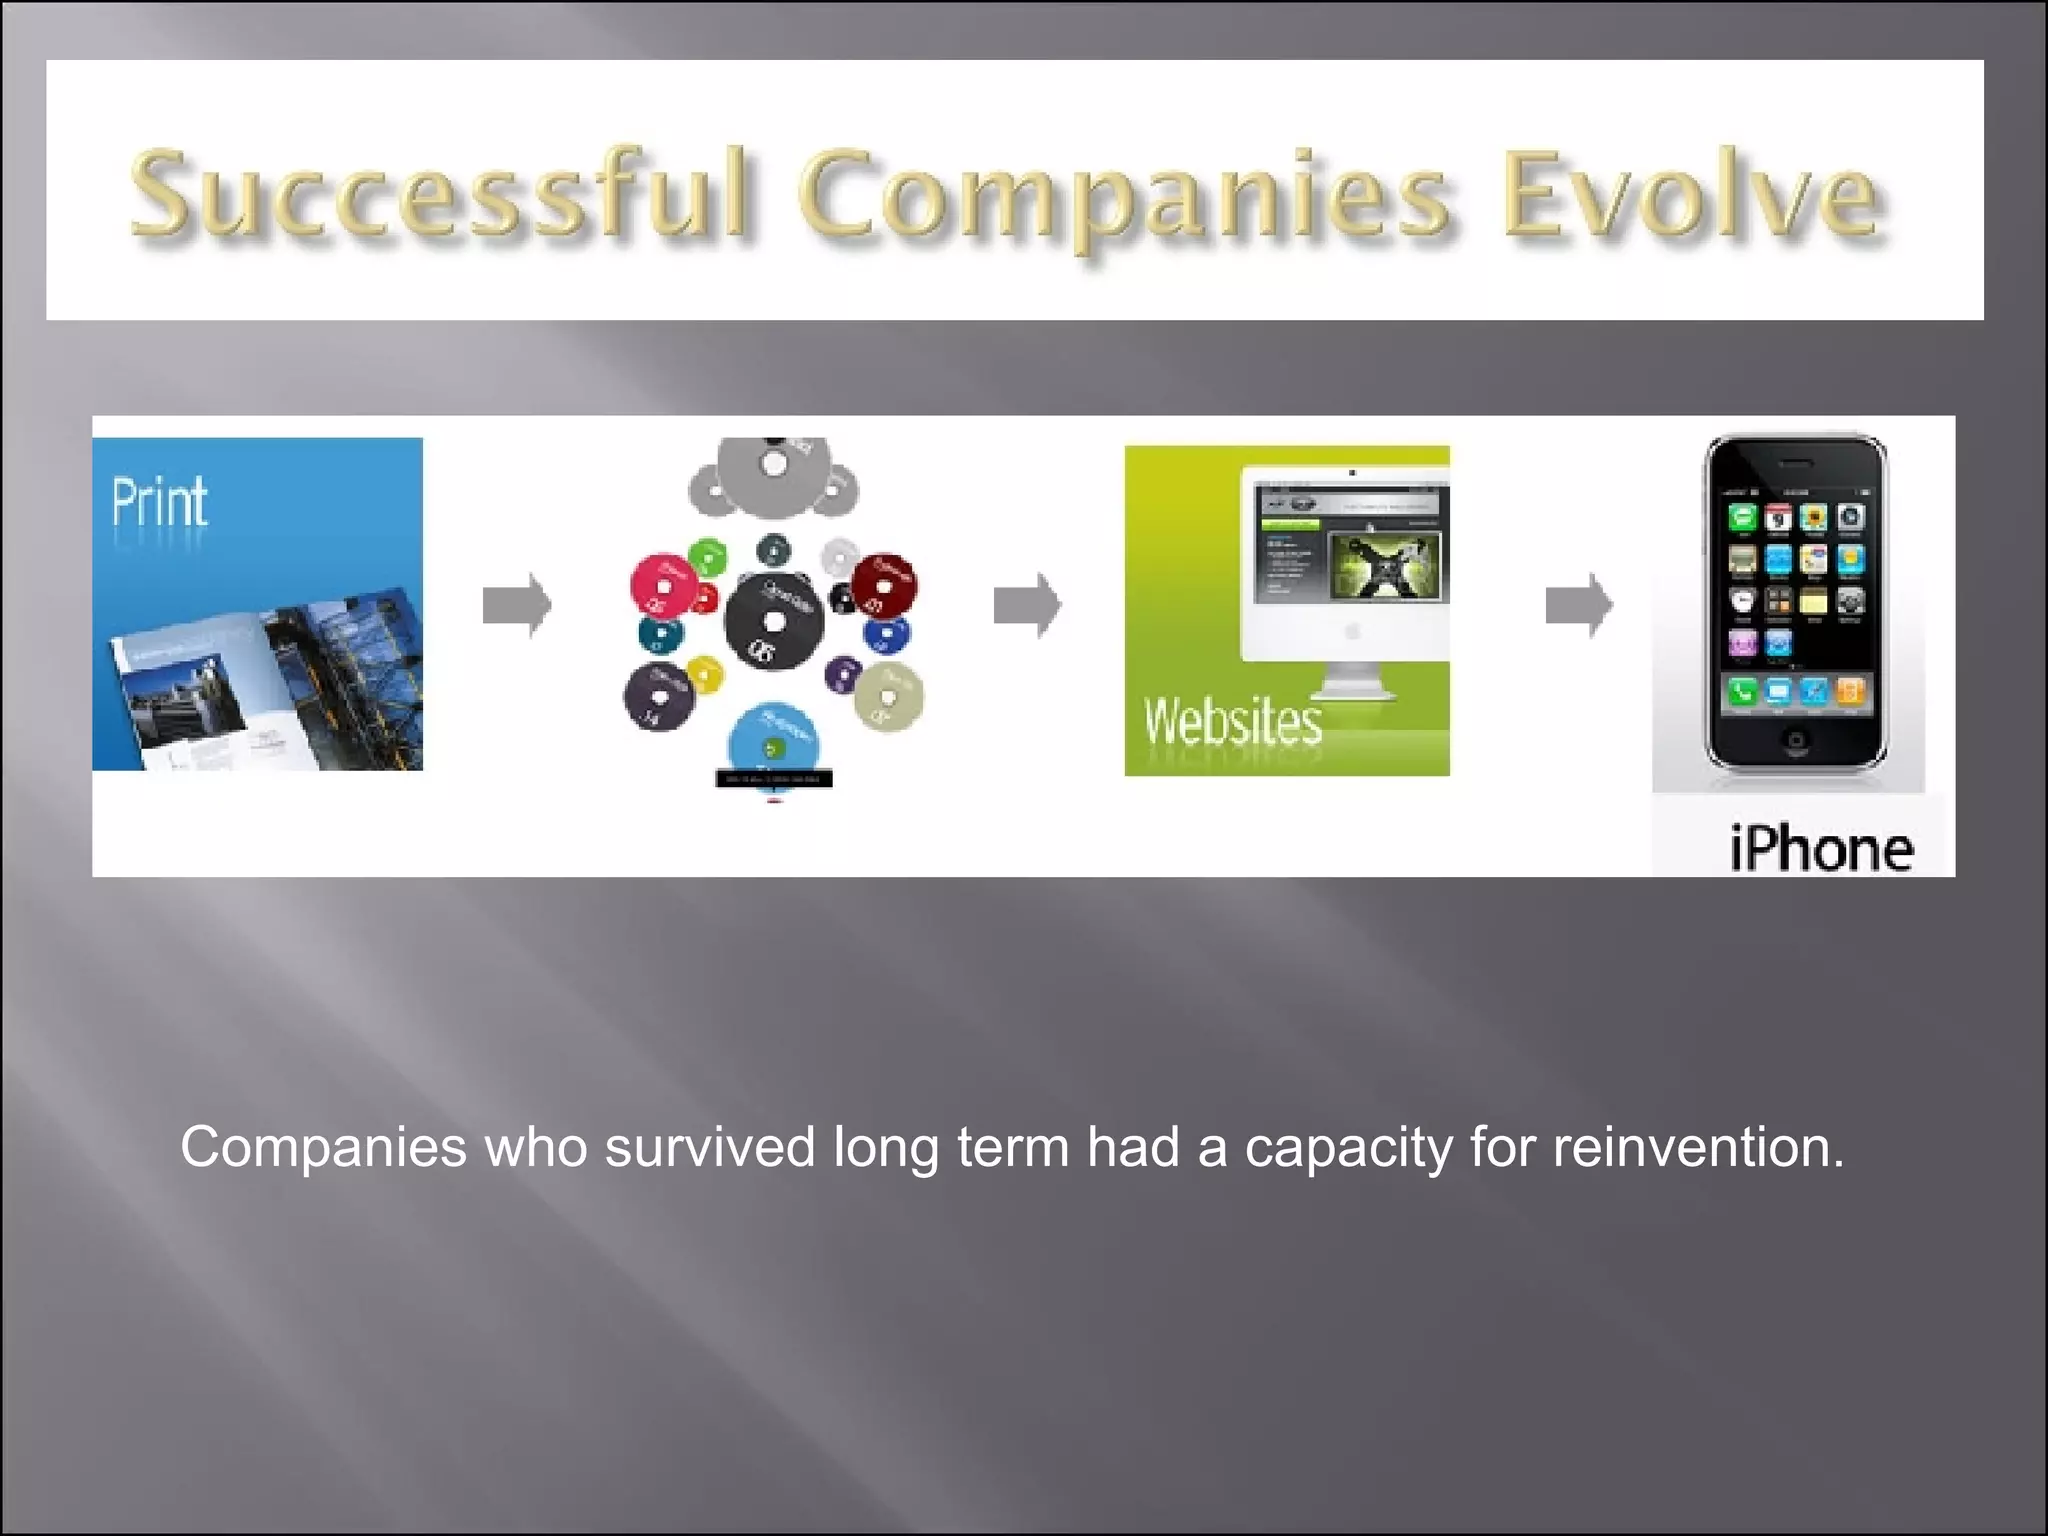
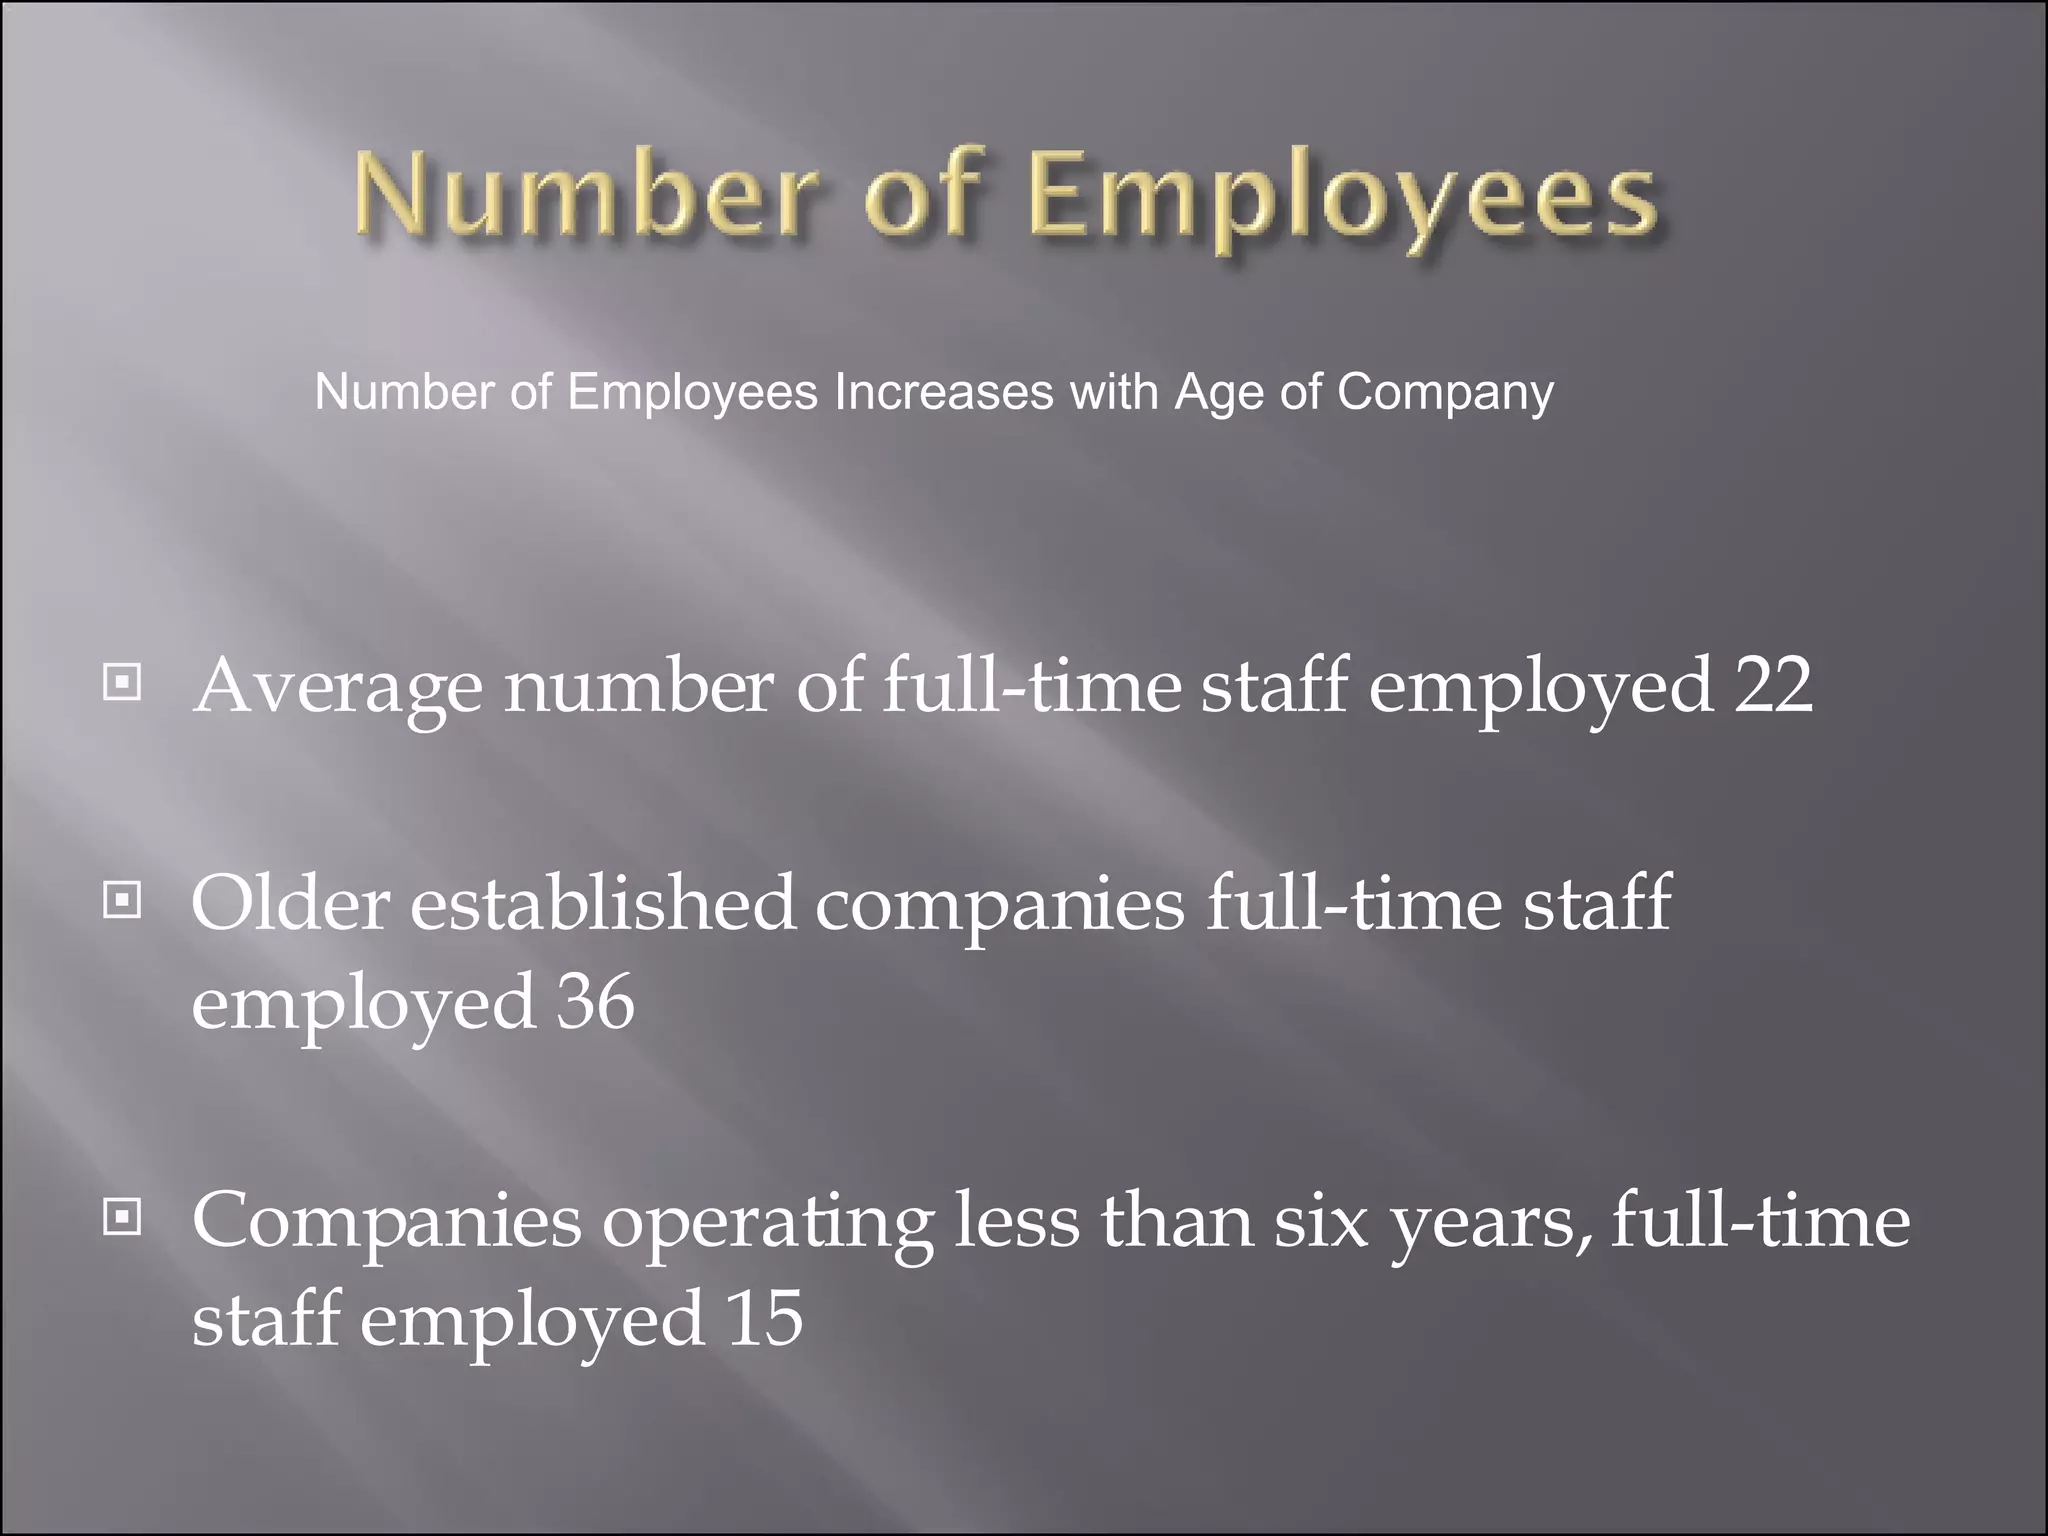
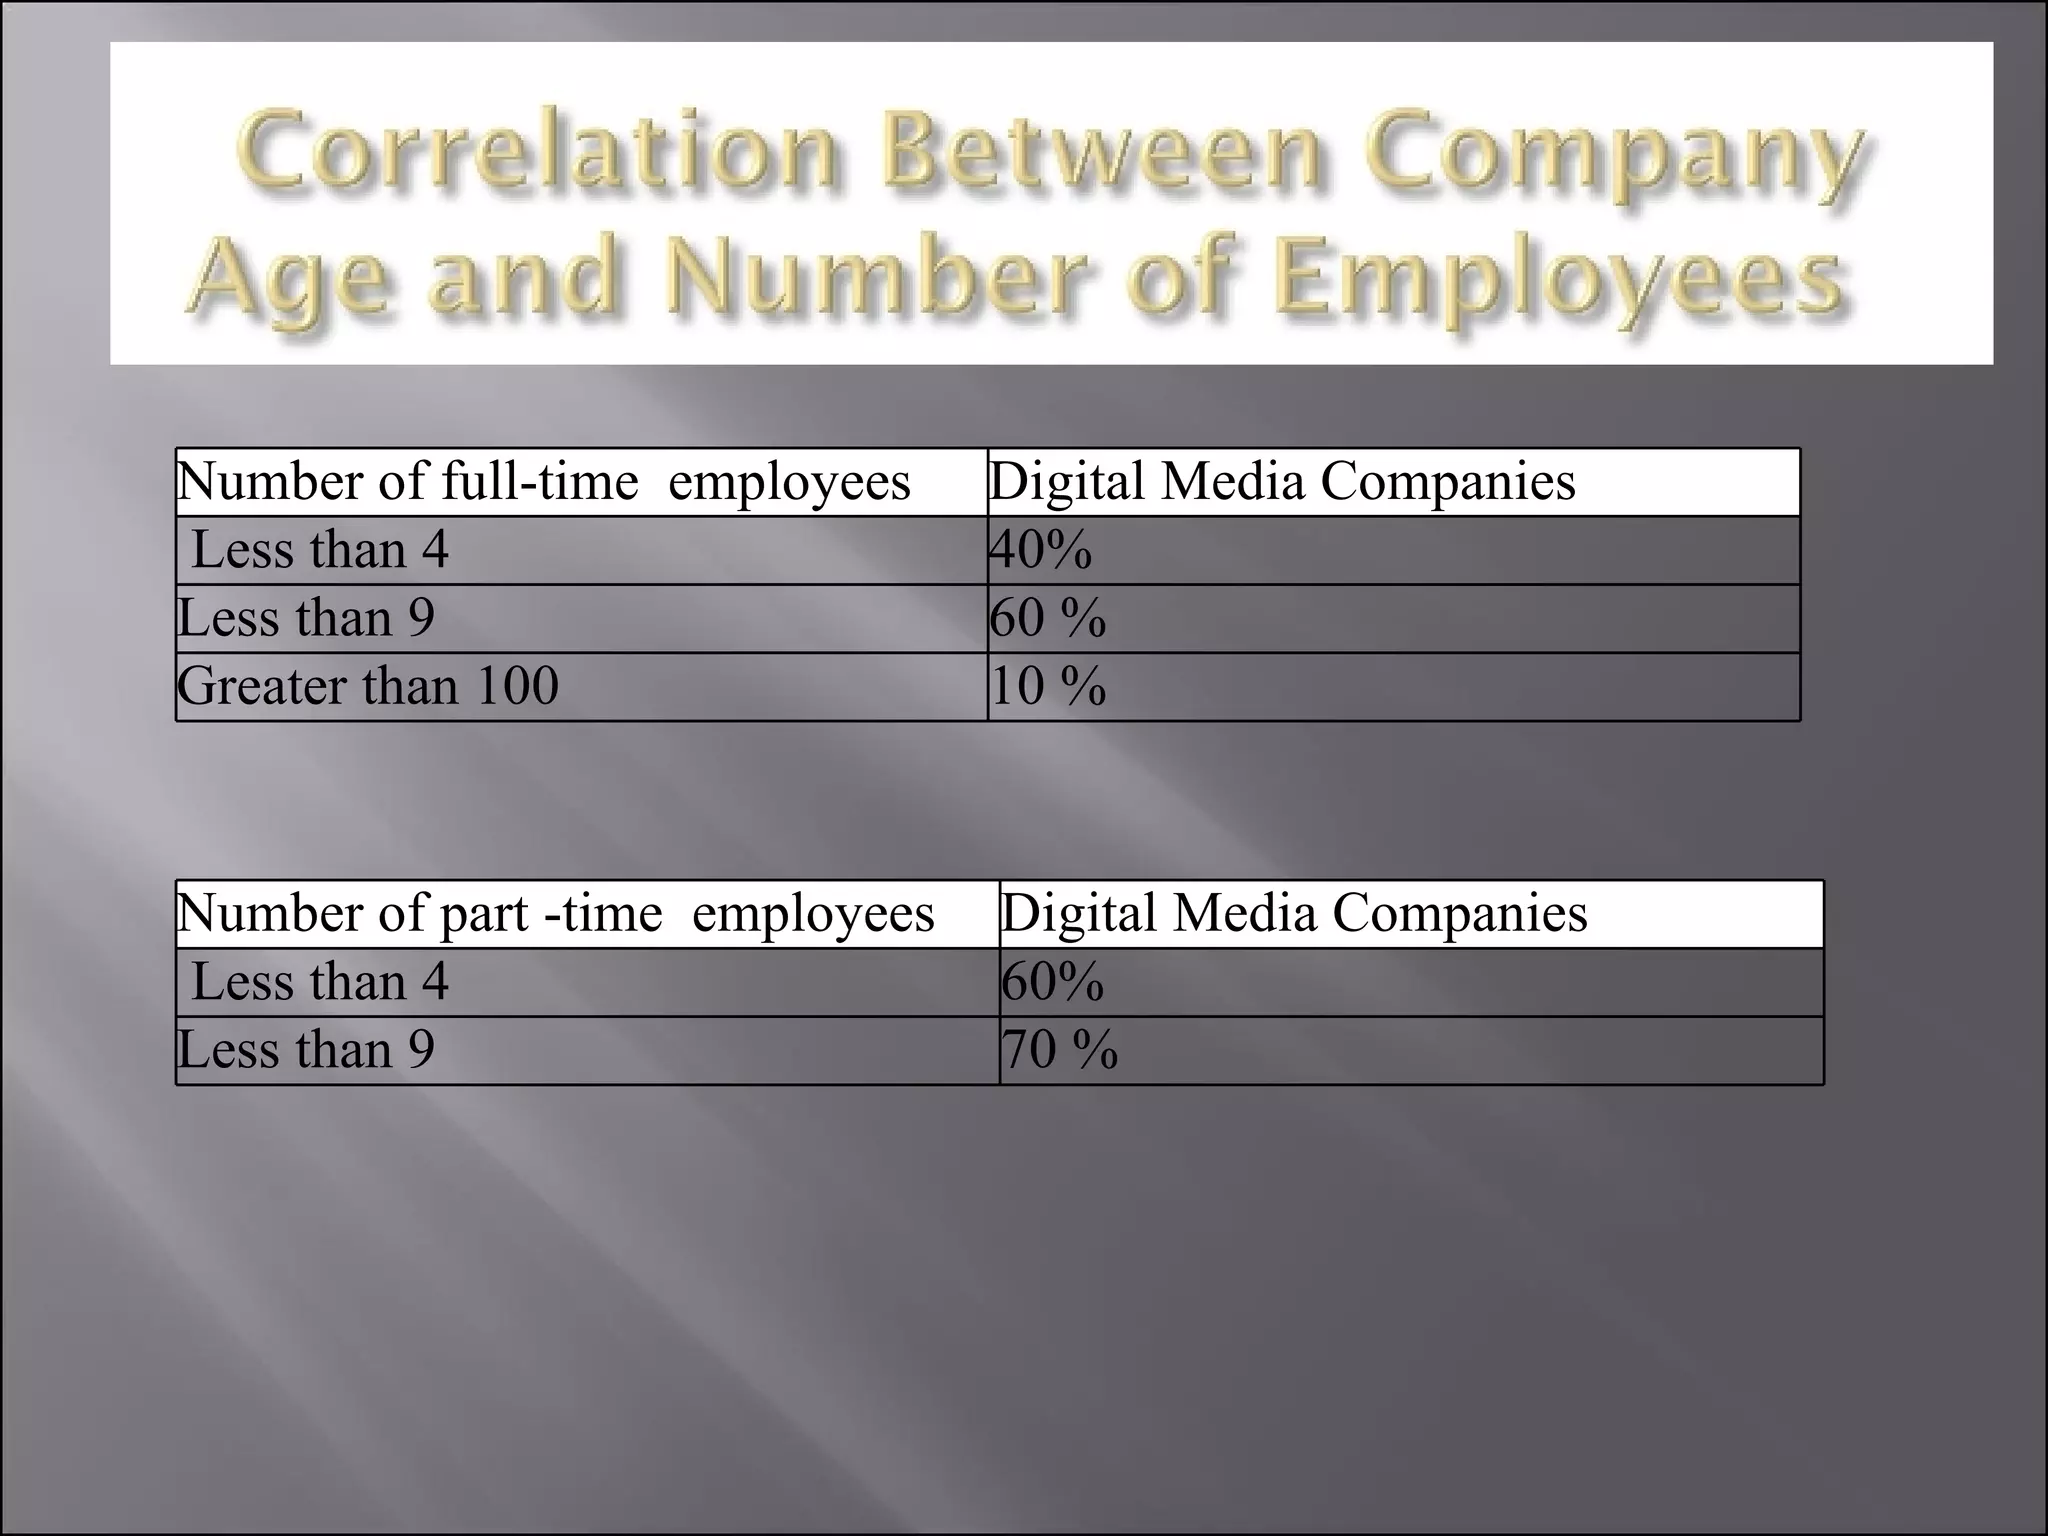
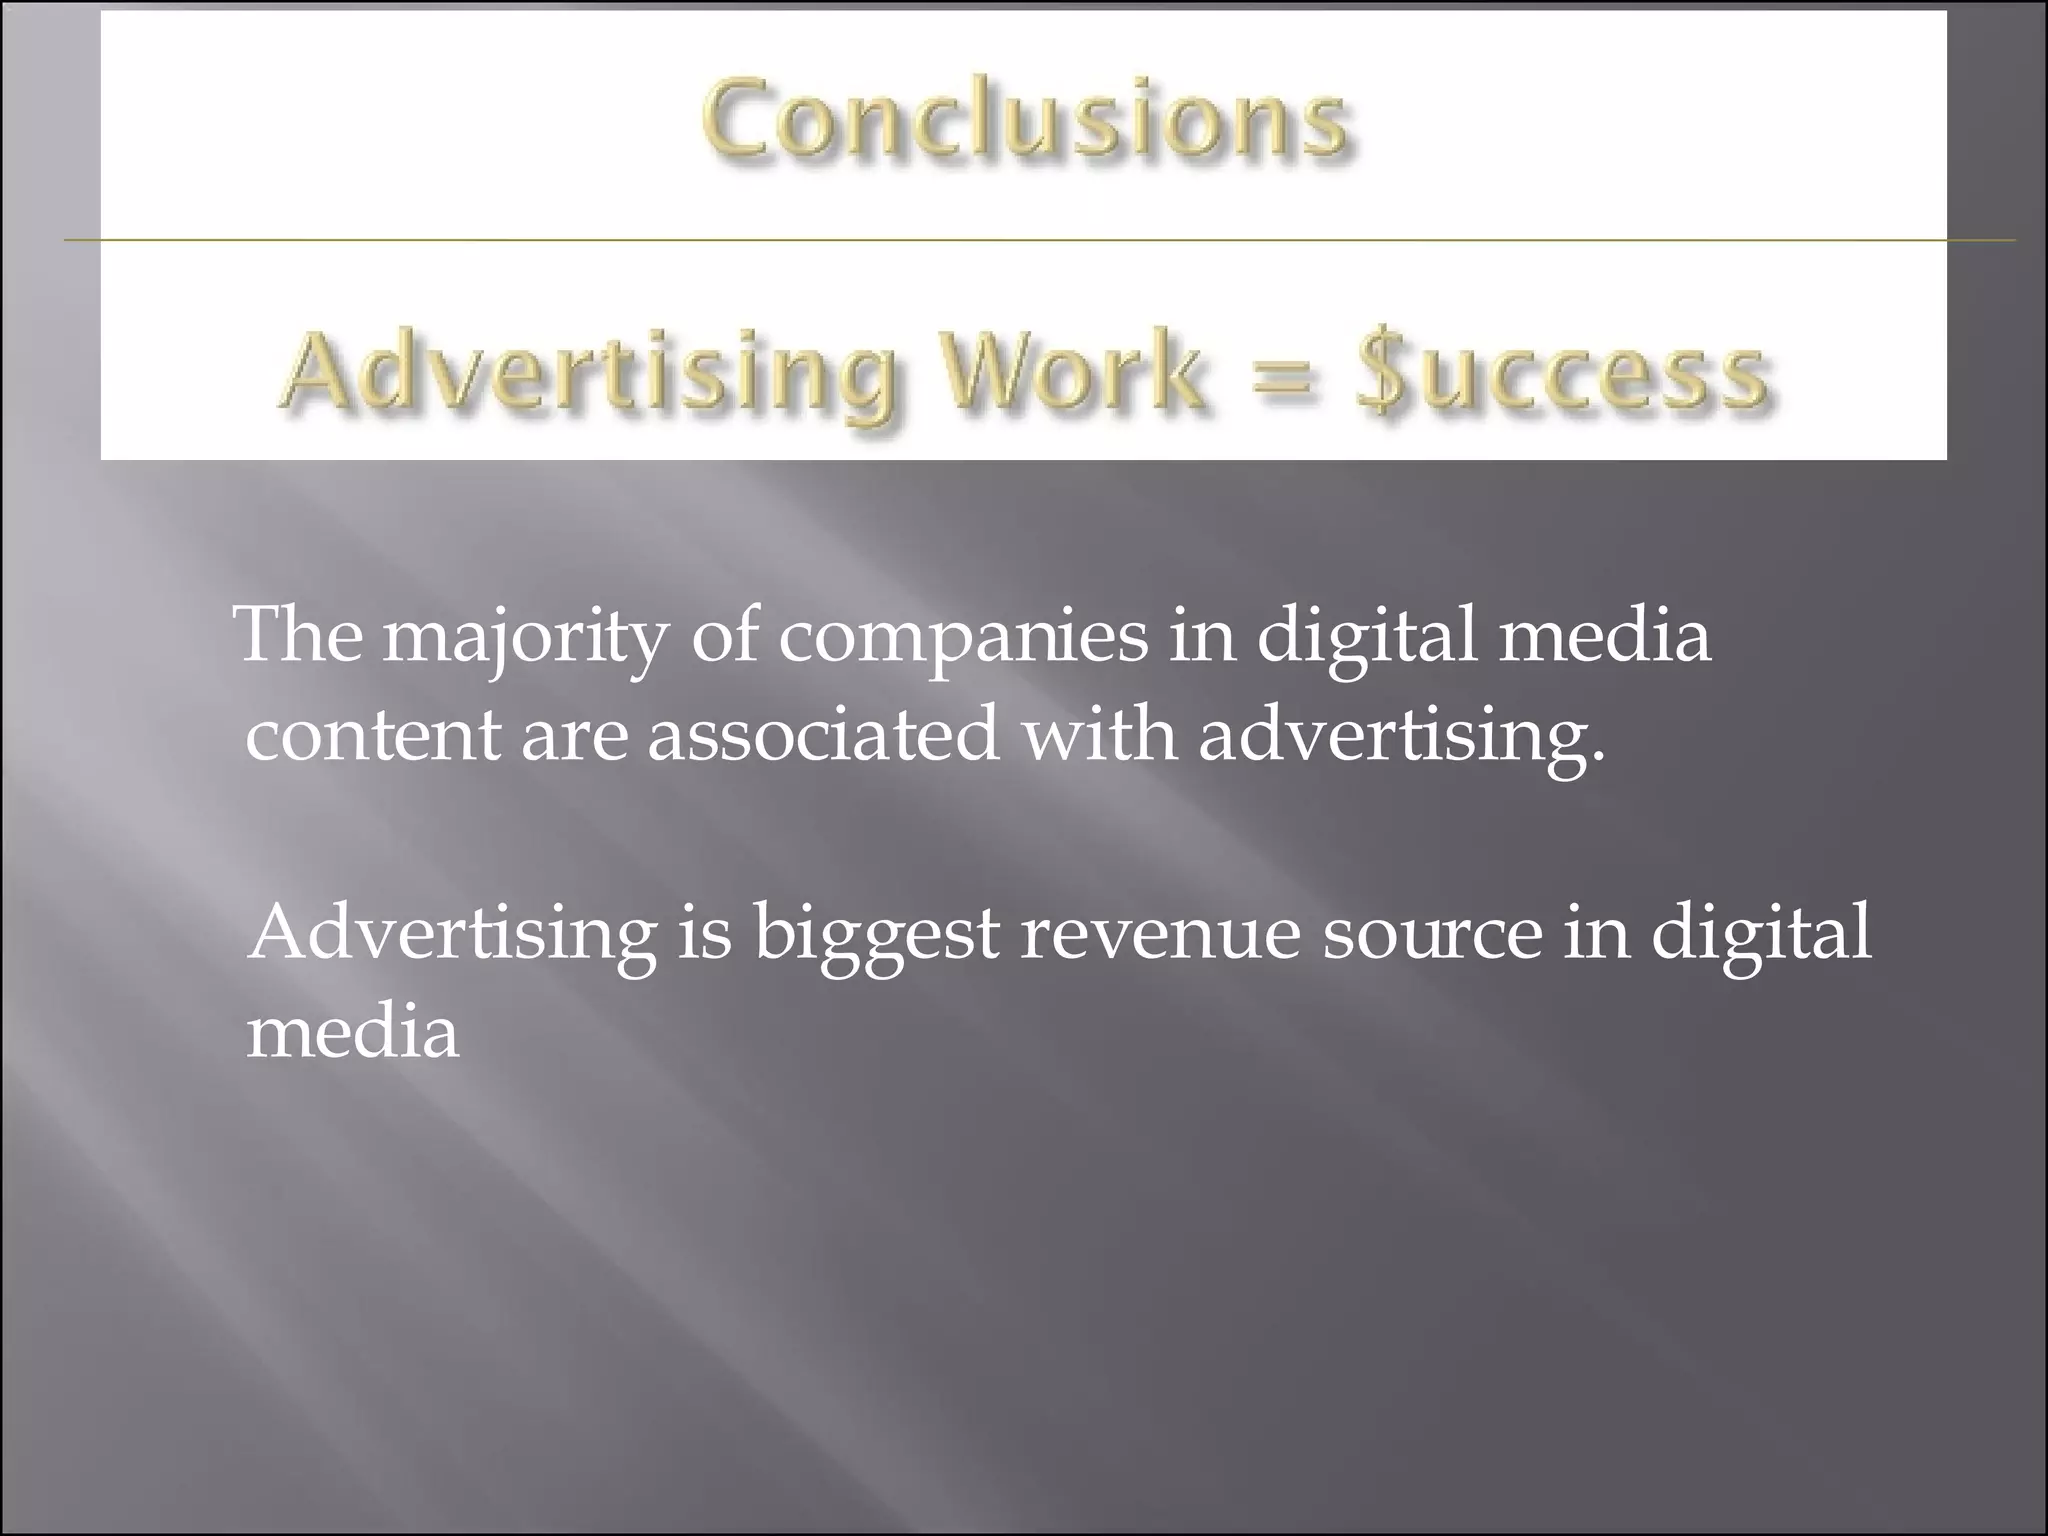
Profile of the Industry Sub- S ectors and Companies
This section of the report looks at the type of products and services the companies taking part in the survey produced and the sources of the company’s revenues from these activities.
Advertising is the largest market for digital content. According to the Australian Film Commission, it is estimated that advertising expenditure is worth three billion dollars annually to the Australian economy.
Significant markets for the digital content industry and associated revenue Activity Revenue Advertising $3,000  Million Box Office Returns $907  Million Movie Rental Hire $452  Million Pay TV Subscription Fees $267  Million Online Charges $104  Million
Advertising Communications and marketing Design Services Video Production Distribution Services Video Post-Production E-Commerce Audio Production Audio Post-Production Web Hosting Technical Service Provision Special Effects Animation Ranking of survey responses
 
Both quantitative and qualitative research found companies in the digital content industry align and define themselves by their end customers. “I guess we are technically a design company. But advertising is our bread and butter and we definitely see ourselves as part of that industry more than any other.” -Interactive Multimedia Designer, Melbourne
Advertising is the largest single market for content.   Many companies in interactive multimedia even those that design and develop websites classified themselves in advertising because the website was part of a larger branding campaign.  
This section of the report details key findings relating to company profiles. . Central to the study was the need to clearly identify the type, nature and size of the companies that make up the Digital Content Industry.
 
Companies categorised themselves as follows Profitability  Percentage Satisfactory 46% Marginal 27% Unprofitable 9% Highly Profitable 8%
Profitability was highly dependent on the number of staff employed . Customers were increasingly willing to pay for quality regardless of industry.
Indicator Characteristics Turnover Exceed  $ 1 Million  Outputs More likely to be “Services” Export As likely to be involved as not involved Overseas Offices Less likely to have one Main Products Advertisements and Print Publications
Number of years company has been in operation
Companies who survived long term had a capacity for reinvention .
Average number of full-time staff employed 22    Older established companies full-time staff employed 36    Companies operating less than six years, full-time staff employed 15   Number of Employees Increases with Age of Company
Number of full-time  employees Digital Media Companies Less than 4 40% Less than 9 60 % Greater than 100 10 % Number of part -time  employees Digital Media Companies Less than 4 60% Less than 9 70 %
The ratio of full time staff to part time staff is approximately 2:1  Two full time staff for 1 part-time staff       
Companies prefer to employ full-time contract staff rather than part-time staff Many companies are focused on single projects especially in post-production and game sectors.        
6% listed on the stock exchange 80% listed companies turnover over  $10 million New pressures if listed       
58% do not expect a change in ownership 32% expect change in ownership 68% companies producing software expect change in ownership due to merger
One in seven companies expect an ownership change due to share market listing Few companies expressed desire to list on the stock market or peruse a merger or acquisition Majority of companies wanted to retain complete ownership.
The majority of companies in digital media content are associated with advertising. Advertising is biggest revenue source in digital media
Evolved with changing technology trends Have been in business more than 10 years Employ skilled full-time contract staff over part-time staff

Ms Report Summary

  • 1.
    Profile of theIndustry Sub- S ectors and Companies
  • 2.
    This section ofthe report looks at the type of products and services the companies taking part in the survey produced and the sources of the company’s revenues from these activities.
  • 3.
    Advertising is thelargest market for digital content. According to the Australian Film Commission, it is estimated that advertising expenditure is worth three billion dollars annually to the Australian economy.
  • 4.
    Significant markets forthe digital content industry and associated revenue Activity Revenue Advertising $3,000 Million Box Office Returns $907 Million Movie Rental Hire $452 Million Pay TV Subscription Fees $267 Million Online Charges $104 Million
  • 5.
    Advertising Communications andmarketing Design Services Video Production Distribution Services Video Post-Production E-Commerce Audio Production Audio Post-Production Web Hosting Technical Service Provision Special Effects Animation Ranking of survey responses
  • 6.
  • 7.
    Both quantitative andqualitative research found companies in the digital content industry align and define themselves by their end customers. “I guess we are technically a design company. But advertising is our bread and butter and we definitely see ourselves as part of that industry more than any other.” -Interactive Multimedia Designer, Melbourne
  • 8.
    Advertising is thelargest single market for content.   Many companies in interactive multimedia even those that design and develop websites classified themselves in advertising because the website was part of a larger branding campaign.  
  • 9.
    This section ofthe report details key findings relating to company profiles. . Central to the study was the need to clearly identify the type, nature and size of the companies that make up the Digital Content Industry.
  • 10.
  • 11.
    Companies categorised themselvesas follows Profitability Percentage Satisfactory 46% Marginal 27% Unprofitable 9% Highly Profitable 8%
  • 12.
    Profitability was highlydependent on the number of staff employed . Customers were increasingly willing to pay for quality regardless of industry.
  • 13.
    Indicator Characteristics TurnoverExceed $ 1 Million Outputs More likely to be “Services” Export As likely to be involved as not involved Overseas Offices Less likely to have one Main Products Advertisements and Print Publications
  • 14.
    Number of yearscompany has been in operation
  • 15.
    Companies who survivedlong term had a capacity for reinvention .
  • 16.
    Average number offull-time staff employed 22   Older established companies full-time staff employed 36   Companies operating less than six years, full-time staff employed 15   Number of Employees Increases with Age of Company
  • 17.
    Number of full-time employees Digital Media Companies Less than 4 40% Less than 9 60 % Greater than 100 10 % Number of part -time employees Digital Media Companies Less than 4 60% Less than 9 70 %
  • 18.
    The ratio offull time staff to part time staff is approximately 2:1 Two full time staff for 1 part-time staff      
  • 19.
    Companies prefer toemploy full-time contract staff rather than part-time staff Many companies are focused on single projects especially in post-production and game sectors.      
  • 20.
    6% listed onthe stock exchange 80% listed companies turnover over $10 million New pressures if listed      
  • 21.
    58% do notexpect a change in ownership 32% expect change in ownership 68% companies producing software expect change in ownership due to merger
  • 22.
    One in sevencompanies expect an ownership change due to share market listing Few companies expressed desire to list on the stock market or peruse a merger or acquisition Majority of companies wanted to retain complete ownership.
  • 23.
    The majority ofcompanies in digital media content are associated with advertising. Advertising is biggest revenue source in digital media
  • 24.
    Evolved with changingtechnology trends Have been in business more than 10 years Employ skilled full-time contract staff over part-time staff