Infographic-Unlocking Customer Satisfaction: Why Digital Holds the key for Telcos.
•
3 likes•1,377 views

Explore the key findings from the Capgemini Consulting digital telco survey: Unlocking Customer Satisfaction: Why Digital Holds the key for Telcos.
Recommended

Recommended
More Related Content
What's hot
What's hot (20)
Viewers also liked
Viewers also liked (18)
Similar to Infographic-Unlocking Customer Satisfaction: Why Digital Holds the key for Telcos.
Similar to Infographic-Unlocking Customer Satisfaction: Why Digital Holds the key for Telcos. (20)
More from Capgemini
More from Capgemini (20)
Recently uploaded
Recently uploaded (20)
Infographic-Unlocking Customer Satisfaction: Why Digital Holds the key for Telcos.
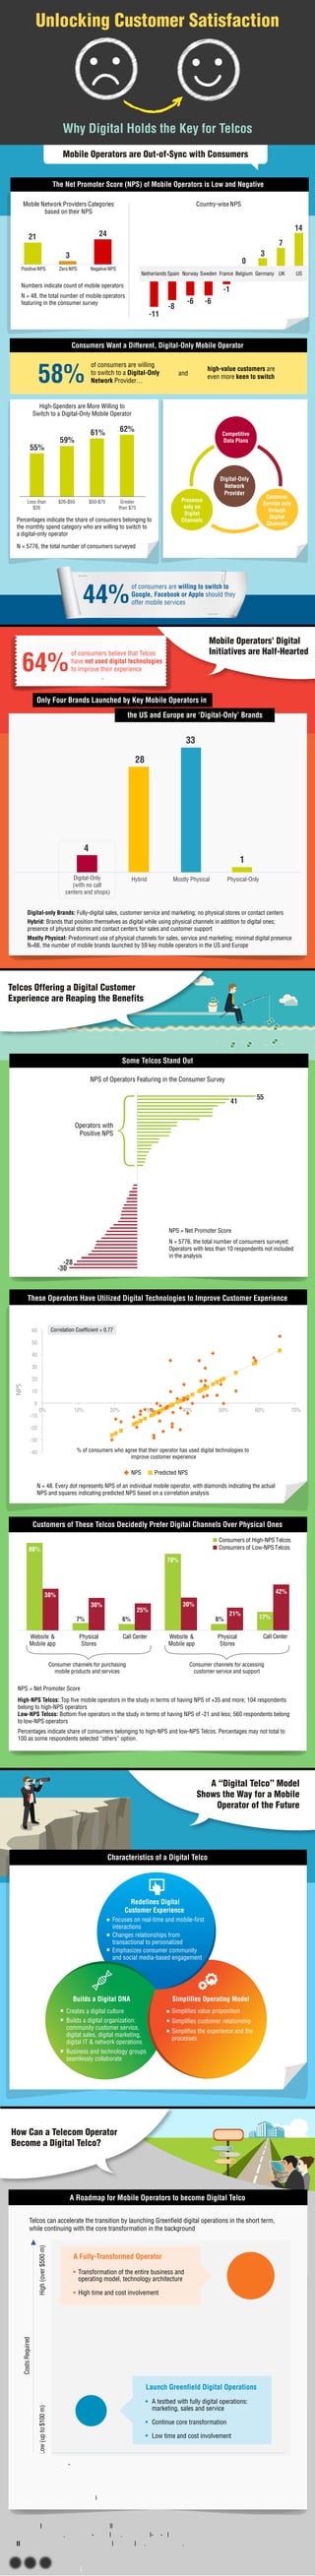
- 1. Mobile Operators' Digital Initiatives are Half-Heartedof consumers believe that Telcos have not used digital technologies to improve their experience64% of consumers are willing to switch to Google, Facebook or Apple should they offer mobile services44% A “Digital Telco” Model Shows the Way for a Mobile Operator of the Future #digitaltransformation Reach out: Interested in reading the full report? Head to https://www.capgemini-consulting.com/digital-for-telcos Follow us on Twitter @capgeminiconsul or email dti.in@capgemini.com -11 -8 -6 -6 -1 0 3 7 14 Country-wise NPS Netherlands Spain Norway Sweden BelgiumFrance Germany UK US Mobile Network Providers Categories based on their NPS 21 3 24 Positive NPS Zero NPS Negative NPS 55% 59% 61% 62% High-Spenders are More Willing to Switch to a Digital-Only Mobile Operator N = 5776, the total number of consumers surveyed Percentages indicate the share of consumers belonging to the monthly spend category who are willing to switch to a digital-only operator Less than $26 $26-$50 $50-$75 Greater than $75 Presence only on Digital Channels Customer Service only through Digital Channels Competitive Data Plans Digital-Only Network Provider High-NPS Telcos: Top five mobile operators in the study in terms of having NPS of +35 and more; 104 respondents belong to high-NPS operators Low-NPS Telcos: Bottom five operators in the study in terms of having NPS of -21 and less; 560 respondents belong to low-NPS operators 7% 6% 6% Website & Mobile app Physical Stores Call Center Website & Mobile app Physical Stores Call Center 80% 38% 30% 70% 17% 25% 30% 21% 42% Consumers of High-NPS Telcos Consumers of Low-NPS Telcos Consumer channels for accessing customer service and support Consumer channels for purchasing mobile products and services NPS = Net Promoter Score % of consumers who agree that their operator has used digital technologies to improve customer experience Correlation Coefficient = 0.77 NPS Predicted NPS N = 48. Every dot represents NPS of an individual mobile operator, with diamonds indicating the actual NPS and squares indicating predicted NPS based on a correlation analysis CostsRequired Low(upto$100m)High(over$500m) TimeRequired Launch Greenfield Digital Operations A Fully-Transformed Operator Transformation of the entire business and operating model, technology architecture High time and cost involvement A testbed with fully digital operations: marketing, sales and service Continue core transformation Low time and cost involvement High (over 5 years) Size of the bubble represents the extent of transformation required in the organization Low (1-2 years) and of consumers are willing to switch to a Digital-Only Network Provider…58% Consumers Want a Different, Digital-Only Mobile Operator These Operators Have Utilized Digital Technologies to Improve Customer Experience Customers of These Telcos Decidedly Prefer Digital Channels Over Physical Ones Characteristics of a Digital Telco How Can a Telecom Operator Become a Digital Telco? Redefines Digital Customer Experience Focuses on real-time and mobile-first interactions Changes relationships from transactional to personalized Emphasizes consumer community and social media-based engagement Simplifies Operating Model Simplifies value proposition Simplifies customer relationship Simplifies the experience and the processes Builds a Digital DNA Creates a digital culture Builds a digital organization: community customer service, digital sales, digital marketing, digital IT & network operations Business and technology groups seamlessly collaborate Unlocking Customer Satisfaction Why Digital Holds the Key for Telcos Telcos Offering a Digital Customer Experience are Reaping the Benefits The Net Promoter Score (NPS) of Mobile Operators is Low and Negative NPS = Net Promoter Score N = 5776, the total number of consumers surveyed; Operators with less than 10 respondents not included in the analysis Operators with Positive NPS -28 -30 41 55 NPS of Operators Featuring in the Consumer Survey Some Telcos Stand Out Percentages indicate share of consumers belonging to high-NPS and low-NPS Telcos. Percentages may not total to 100 as some respondents selected “others” option. Physical-OnlyMostly PhysicalHybrid Digital-only Brands: Fully-digital sales, customer service and marketing; no physical stores or contact centers Hybrid: Brands that position themselves as digital while using physical channels in addition to digital ones; presence of physical stores and contact centers for sales and customer support Mostly Physical: Predominant use of physical channels for sales, service and marketing; minimal digital presence N=66, the number of mobile brands launched by 59 key mobile operators in the US and Europe the US and Europe are ‘Digital-Only’ Brands Digital-Only (with no call centers and shops) Only Four Brands Launched by Key Mobile Operators in 4 28 33 1 A Roadmap for Mobile Operators to become Digital Telco Telcos can accelerate the transition by launching Greenfield digital operations in the short term, while continuing with the core transformation in the background Numbers indicate count of mobile operators N = 48, the total number of mobile operators featuring in the consumer survey high-value customers are even more keen to switch Mobile Operators are Out-of-Sync with Consumers -40 -30 -20 -10 0 10 20 30 40 50 60 0% 10% 20% 30% 40% 50% 60% 70% NPS