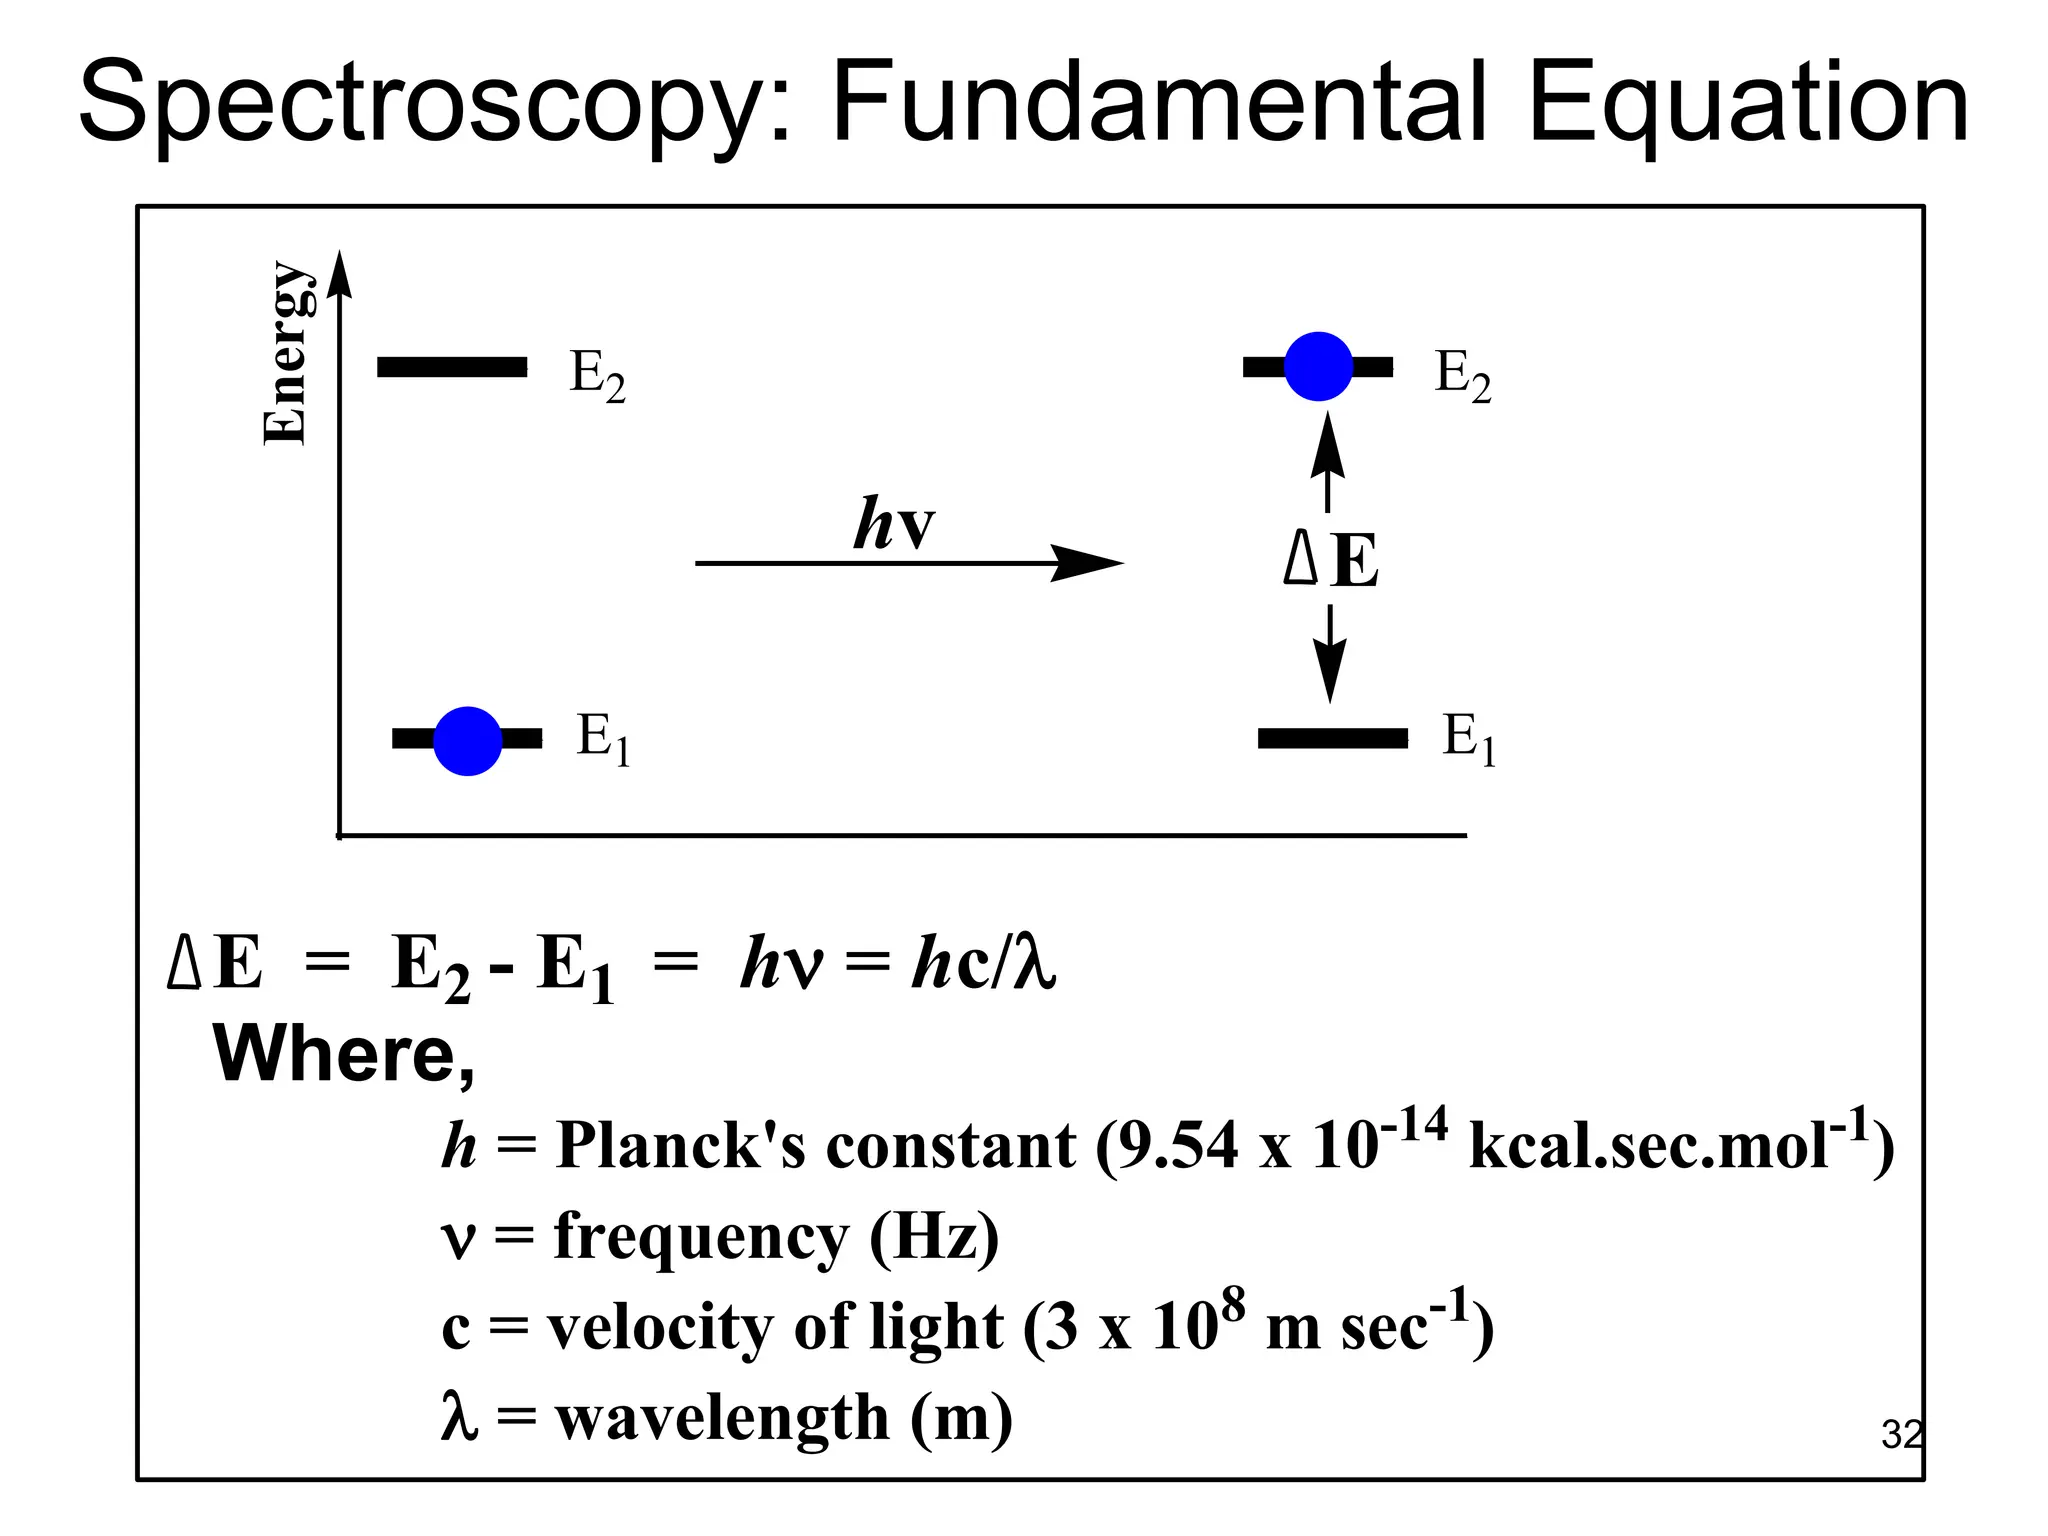
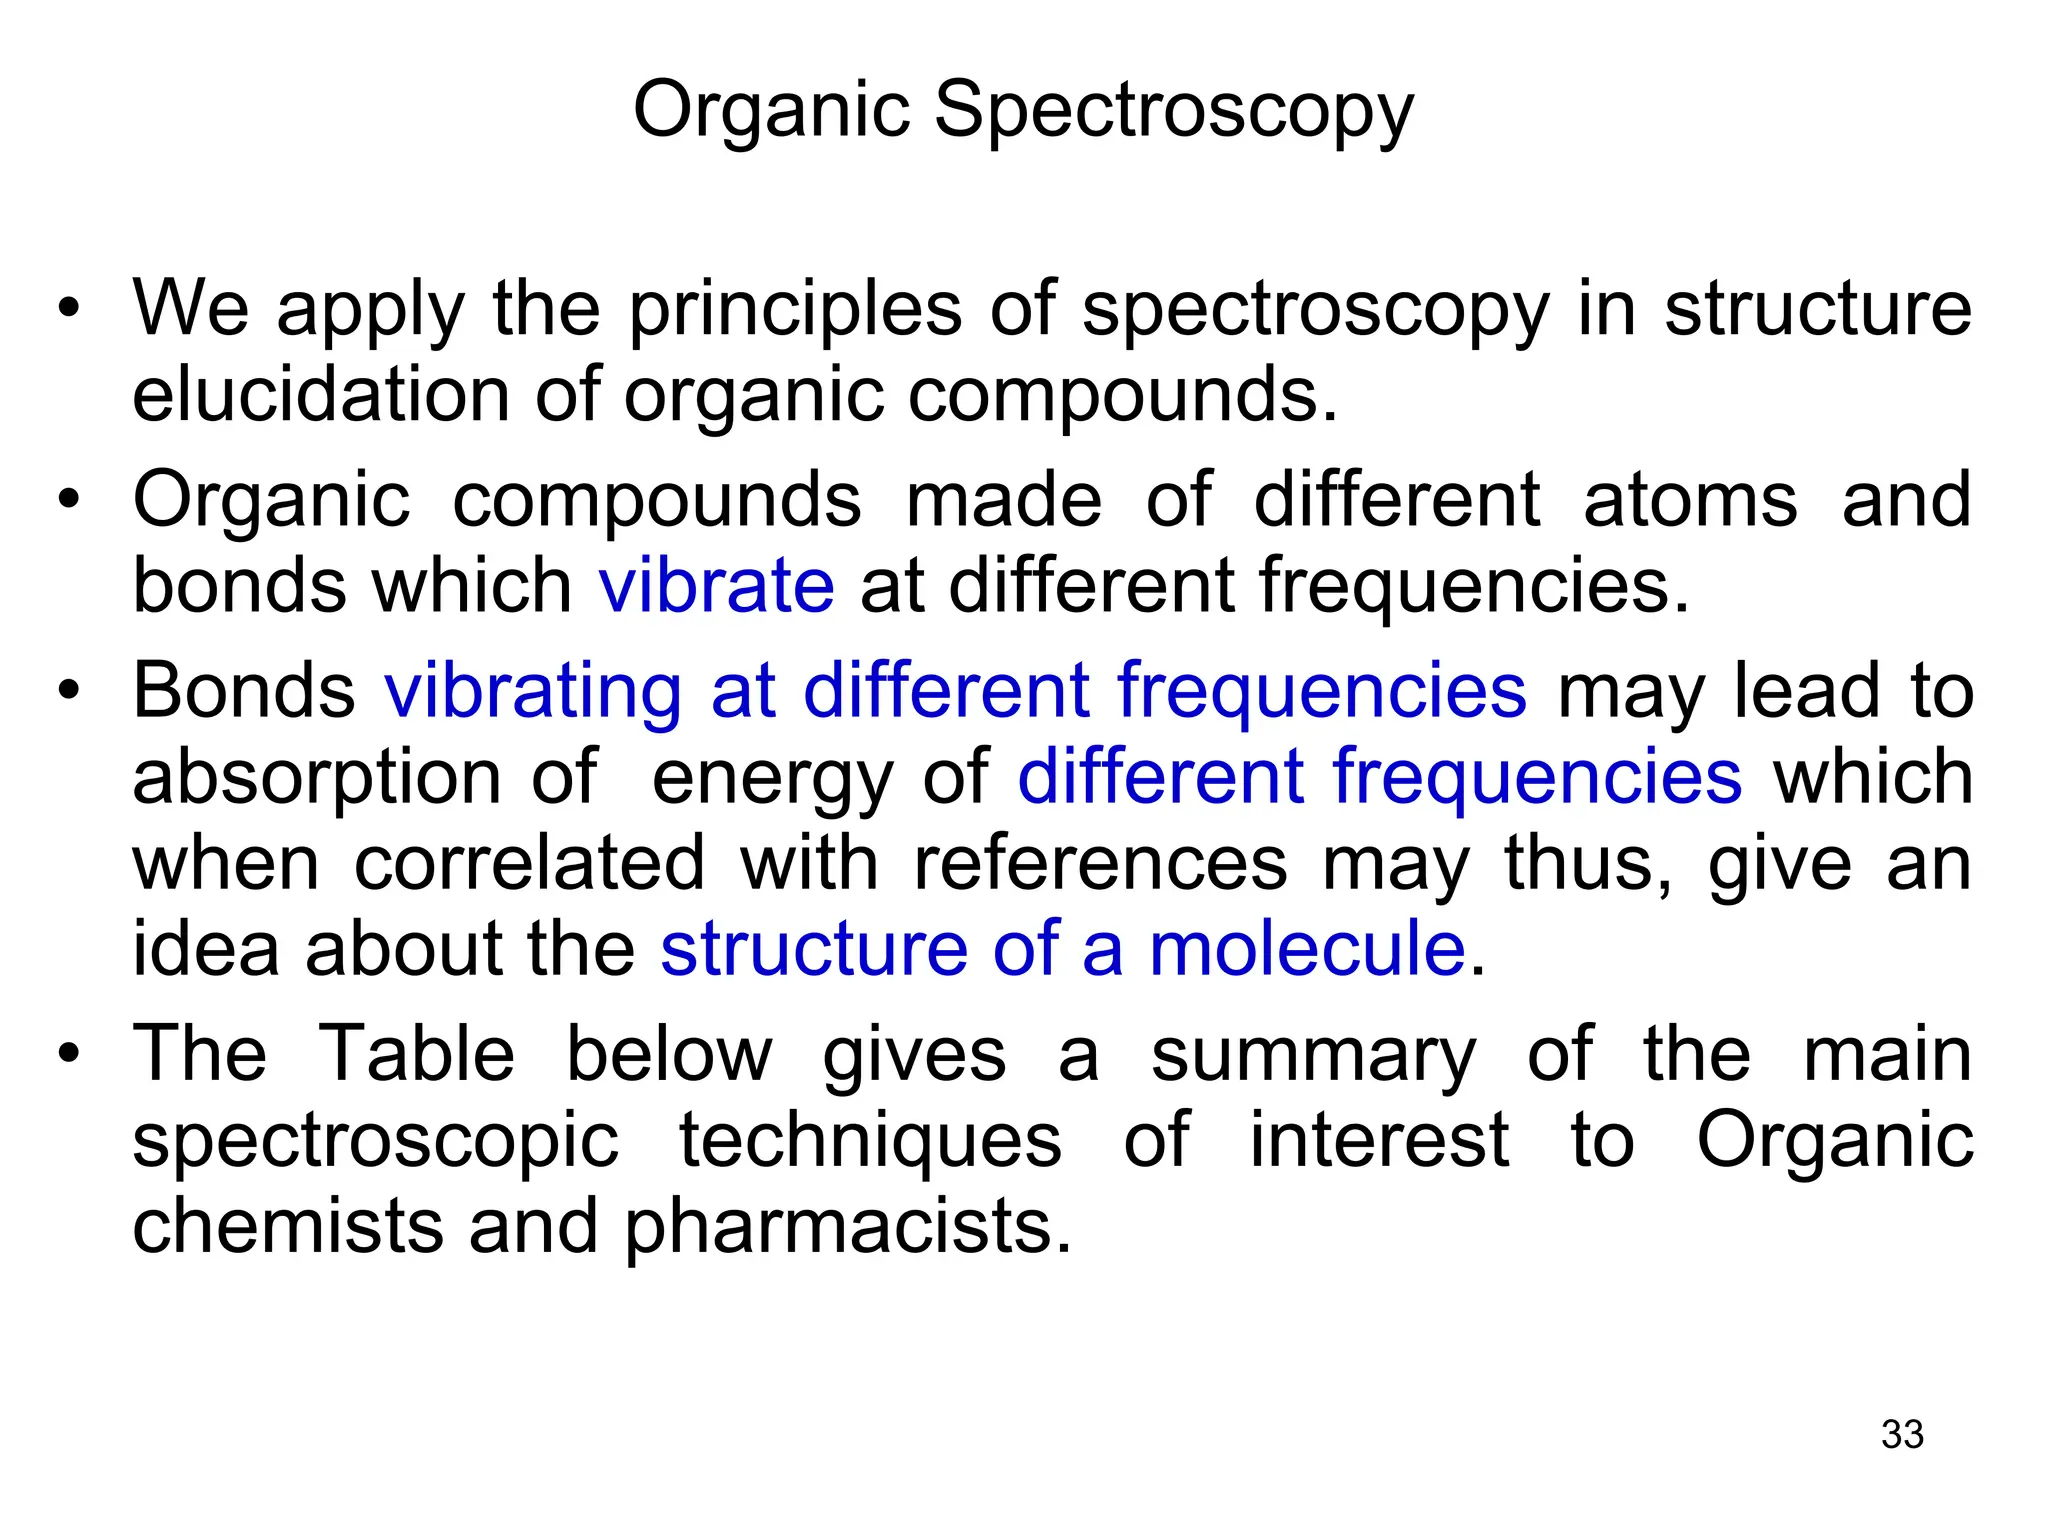
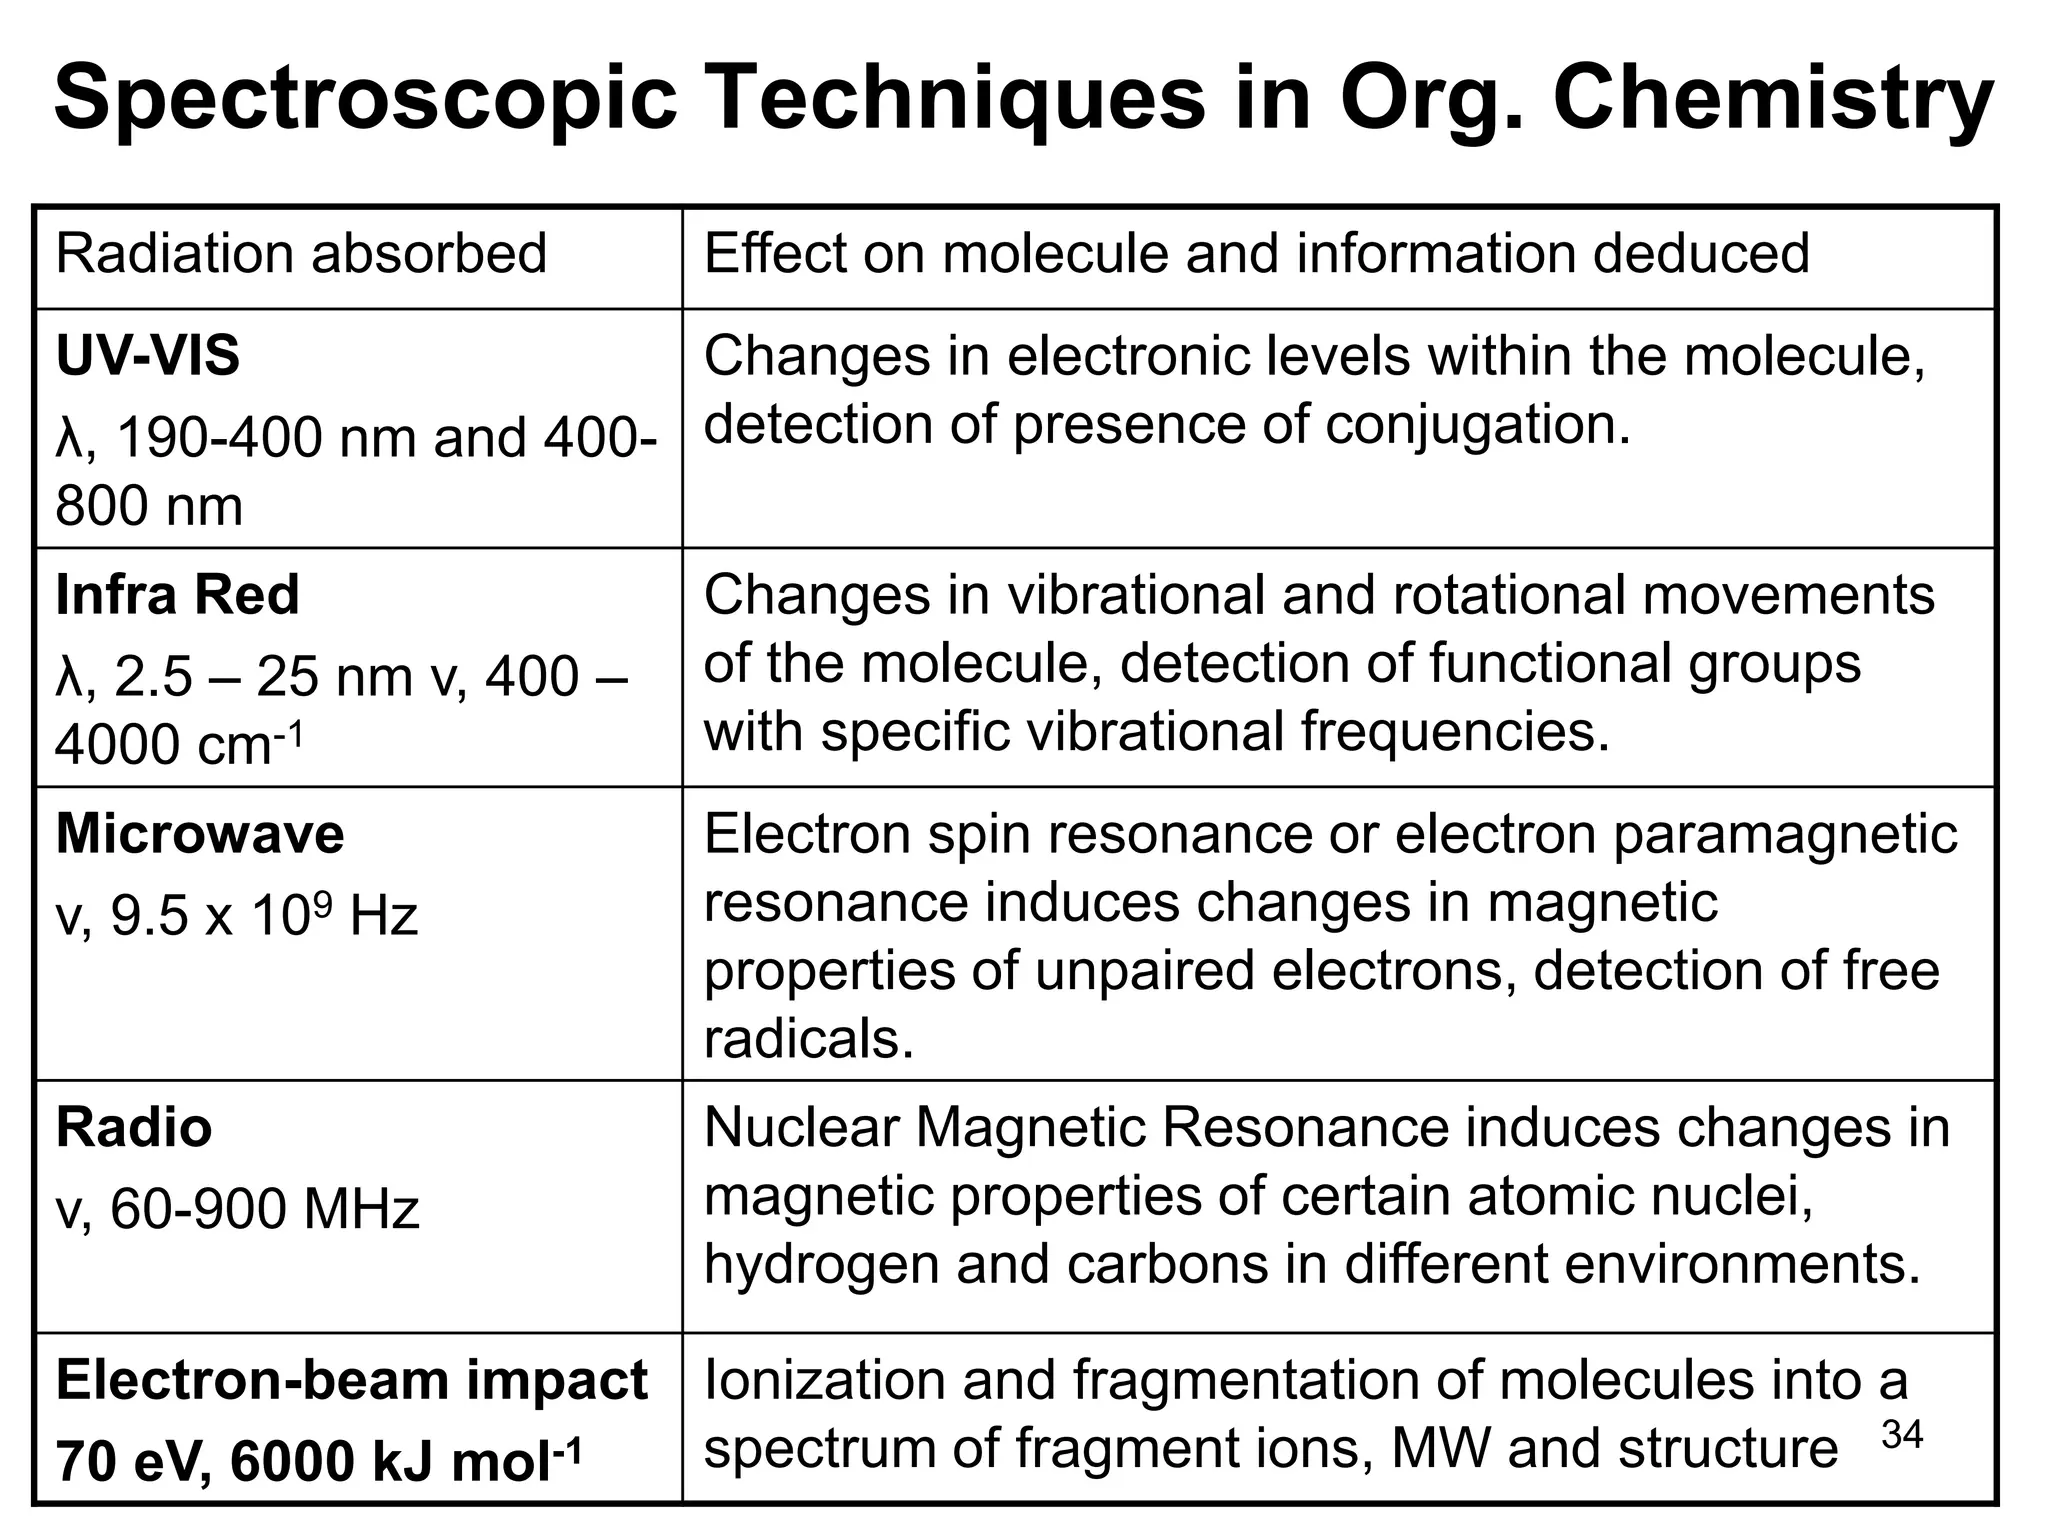
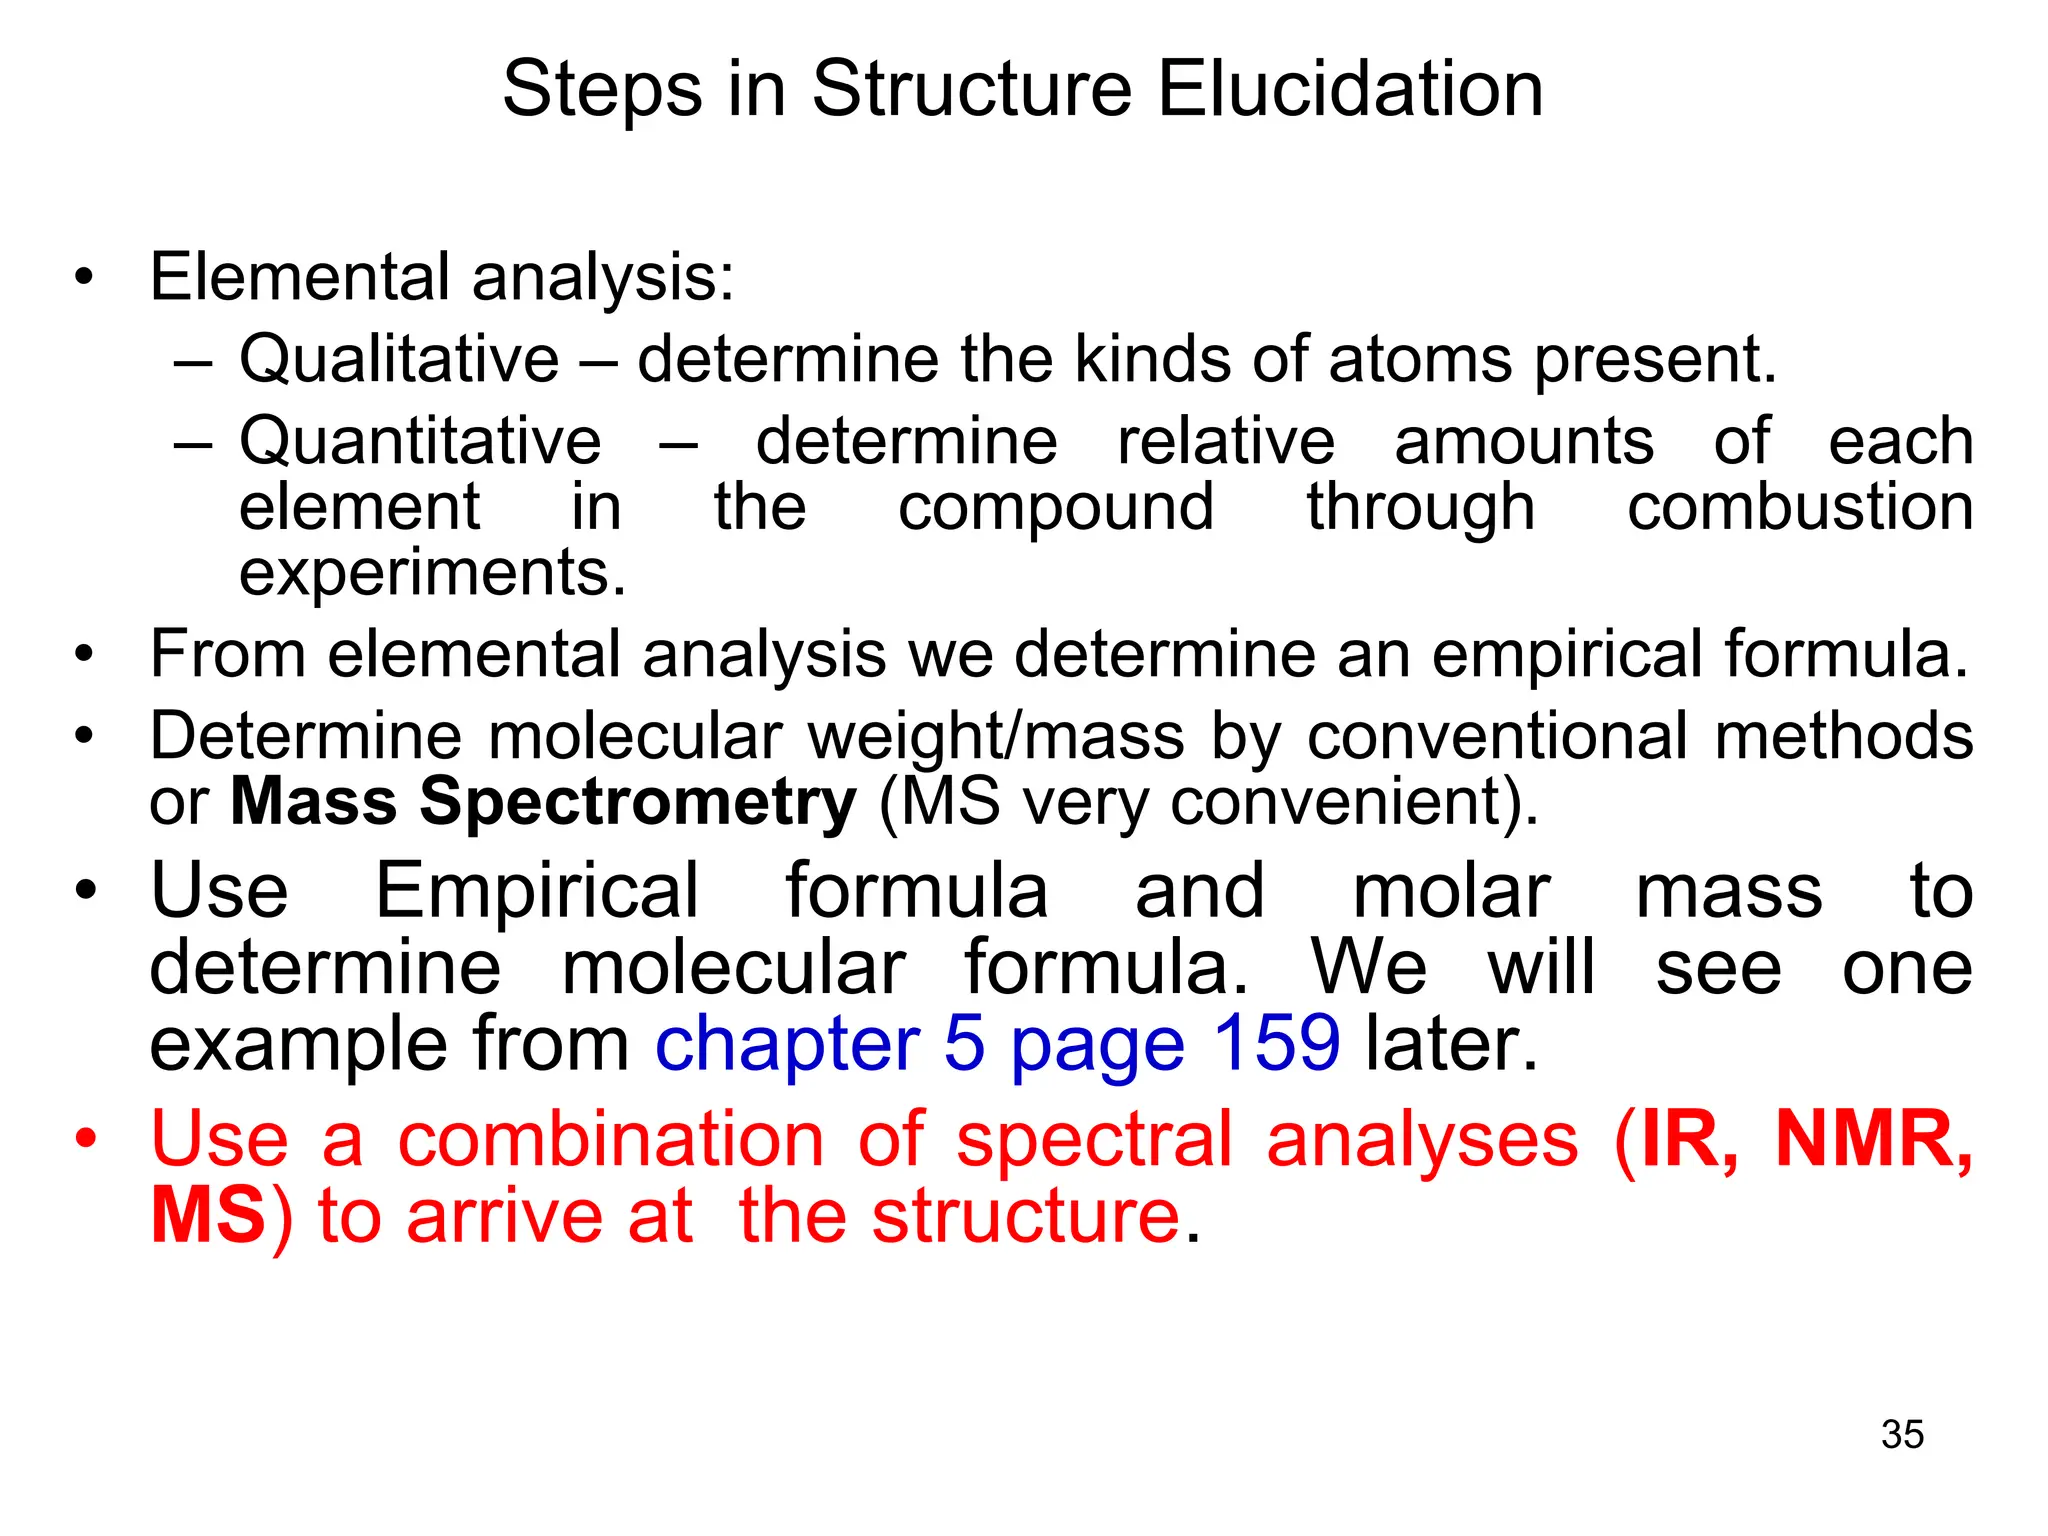
The document discusses the evolution and importance of pharmaceutical chemistry, particularly focusing on the history and techniques of spectroscopy and their applications in identifying and characterizing chemical compounds. It outlines different spectroscopic methods, such as NMR, IR, and UV-Vis spectroscopy, and their roles in structure elucidation of organic compounds. Additionally, it addresses the fundamental principles of electromagnetic radiation and the steps involved in structure determination through empirical formulas and mass spectrometry.

![79
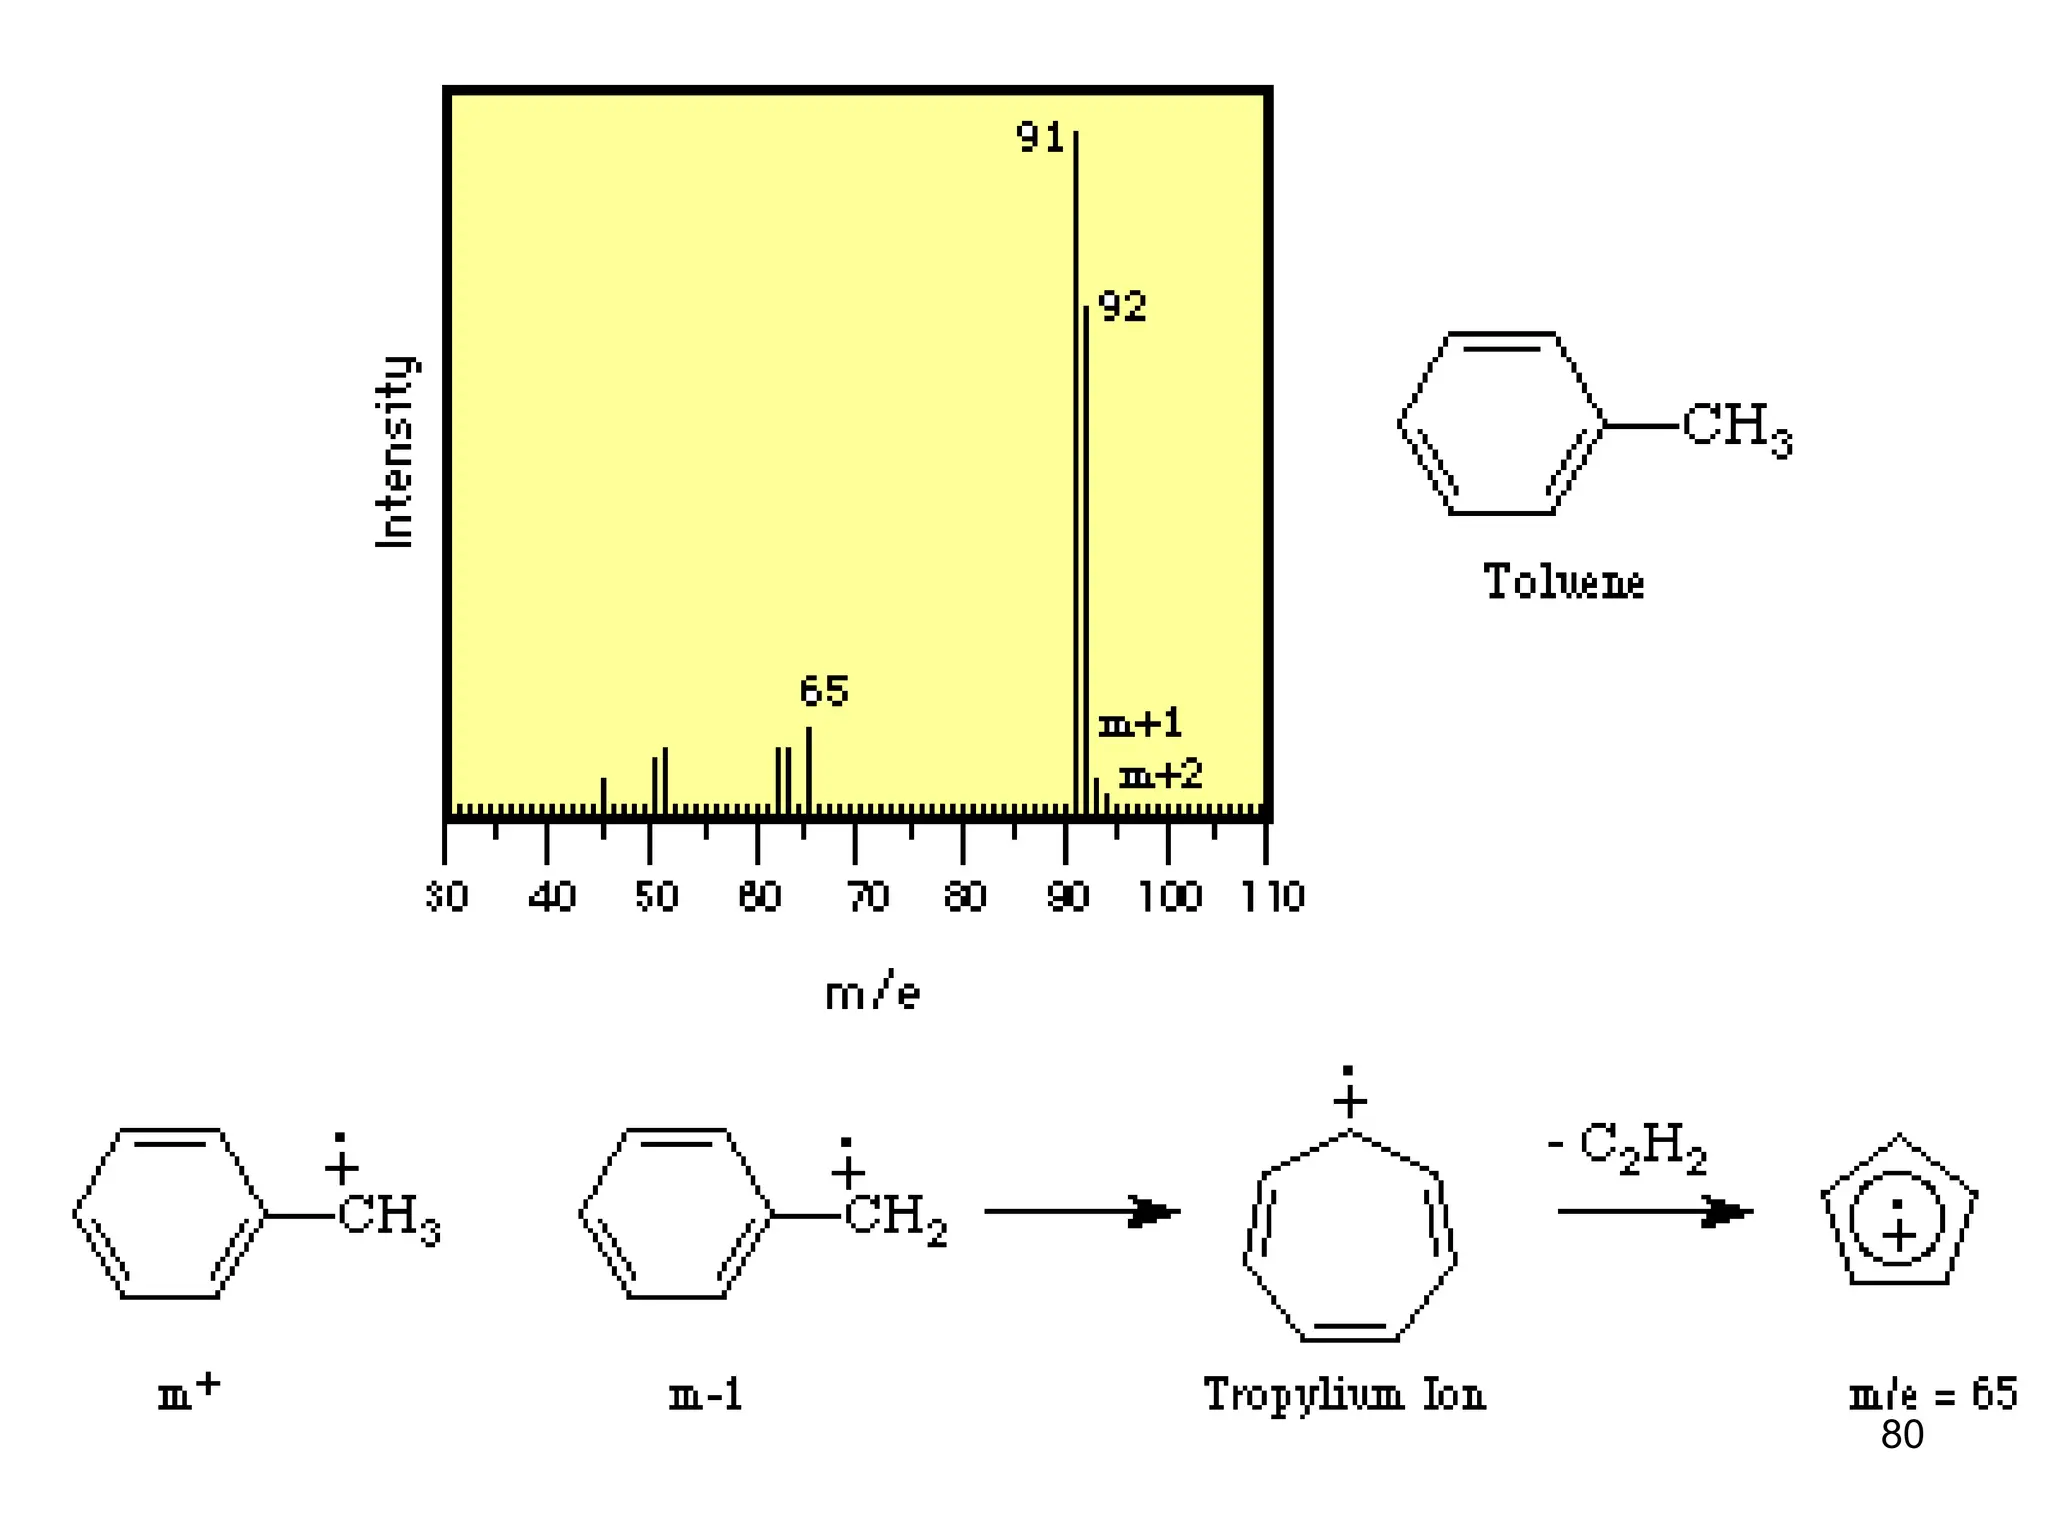
Mass Spectrum of Methylbenzene
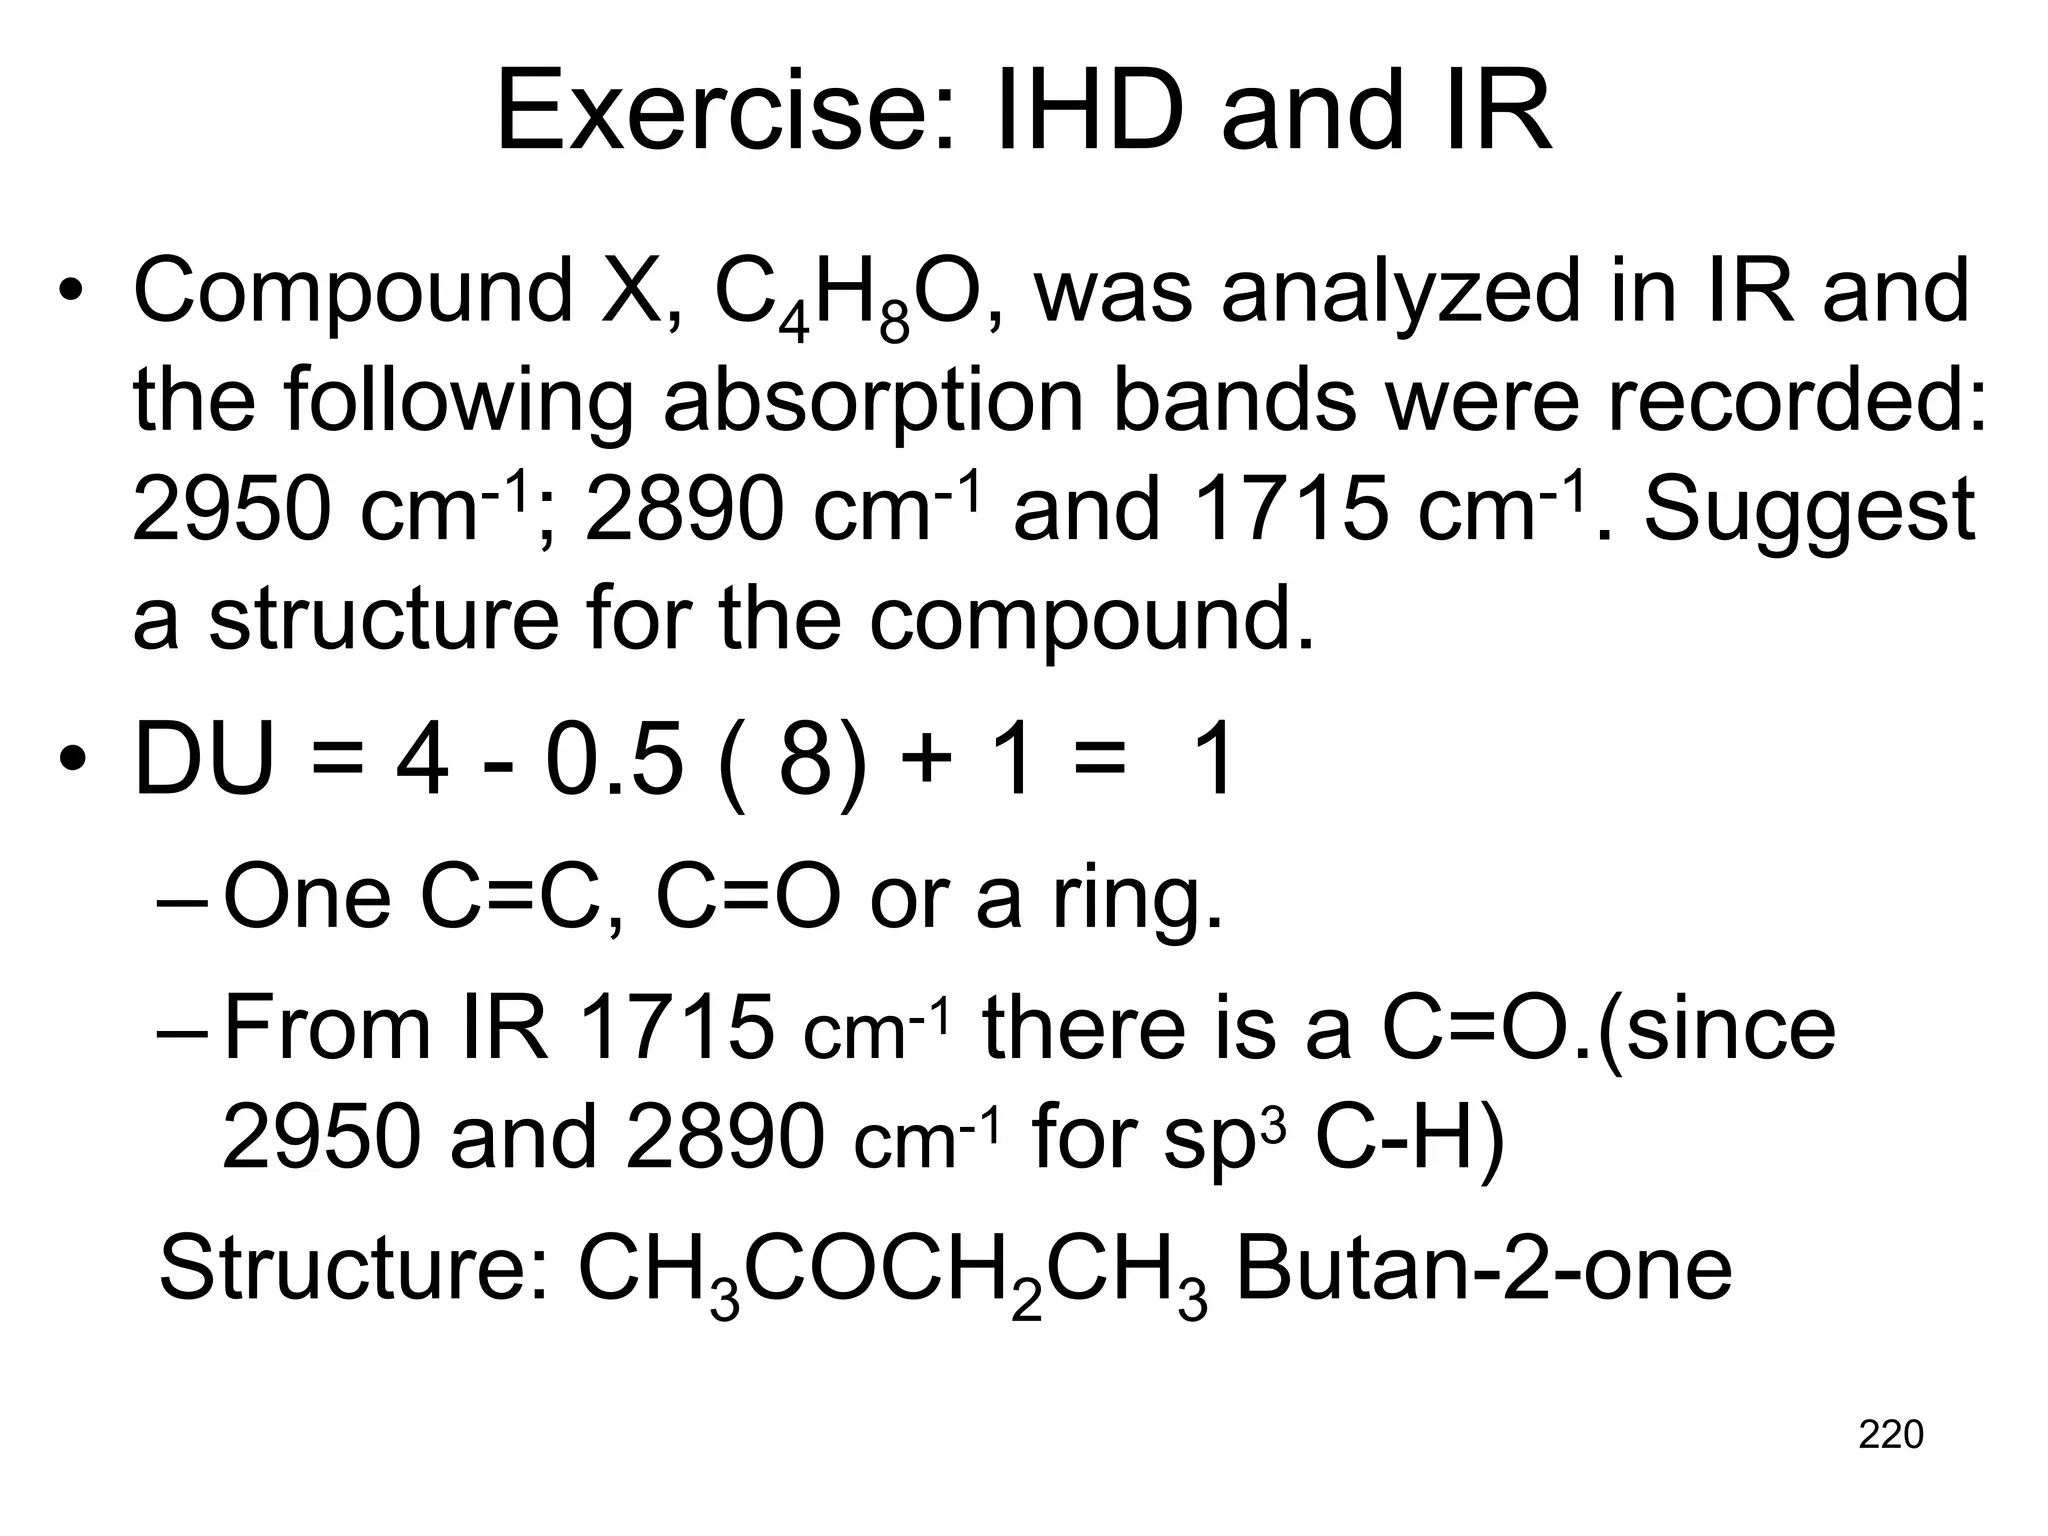
• Molecular ion peak at m/z = 92.
• BASE peak at m/z = 91
• Peak at m/z = 93 [M+ with 13C]
• Peak at m/z = 65 [92 – 27 [CH2=CH]+ = [C5H5]+](https://image.slidesharecdn.com/msirspectroscopy2023updated-240722073130-92424978/75/MS-IR-SPECTROSCOPY-blaco-updated-ppt-79-2048.jpg)
![103
Fragmentation of M+ with Hetero Functional
Groups
Molecular ions [M ] R-Cl R-O-R' R-N
R'
R'
or or or C=O
R
R
1. C-Y Cleavage C
H
R Y
H
C
H
R Y
H
+
2. -Y Cleavage C
R Y + C Y
R
C
R Y
C H
C
R Y
C H
+
3. -Y Cleavage](https://image.slidesharecdn.com/msirspectroscopy2023updated-240722073130-92424978/75/MS-IR-SPECTROSCOPY-blaco-updated-ppt-103-2048.jpg)
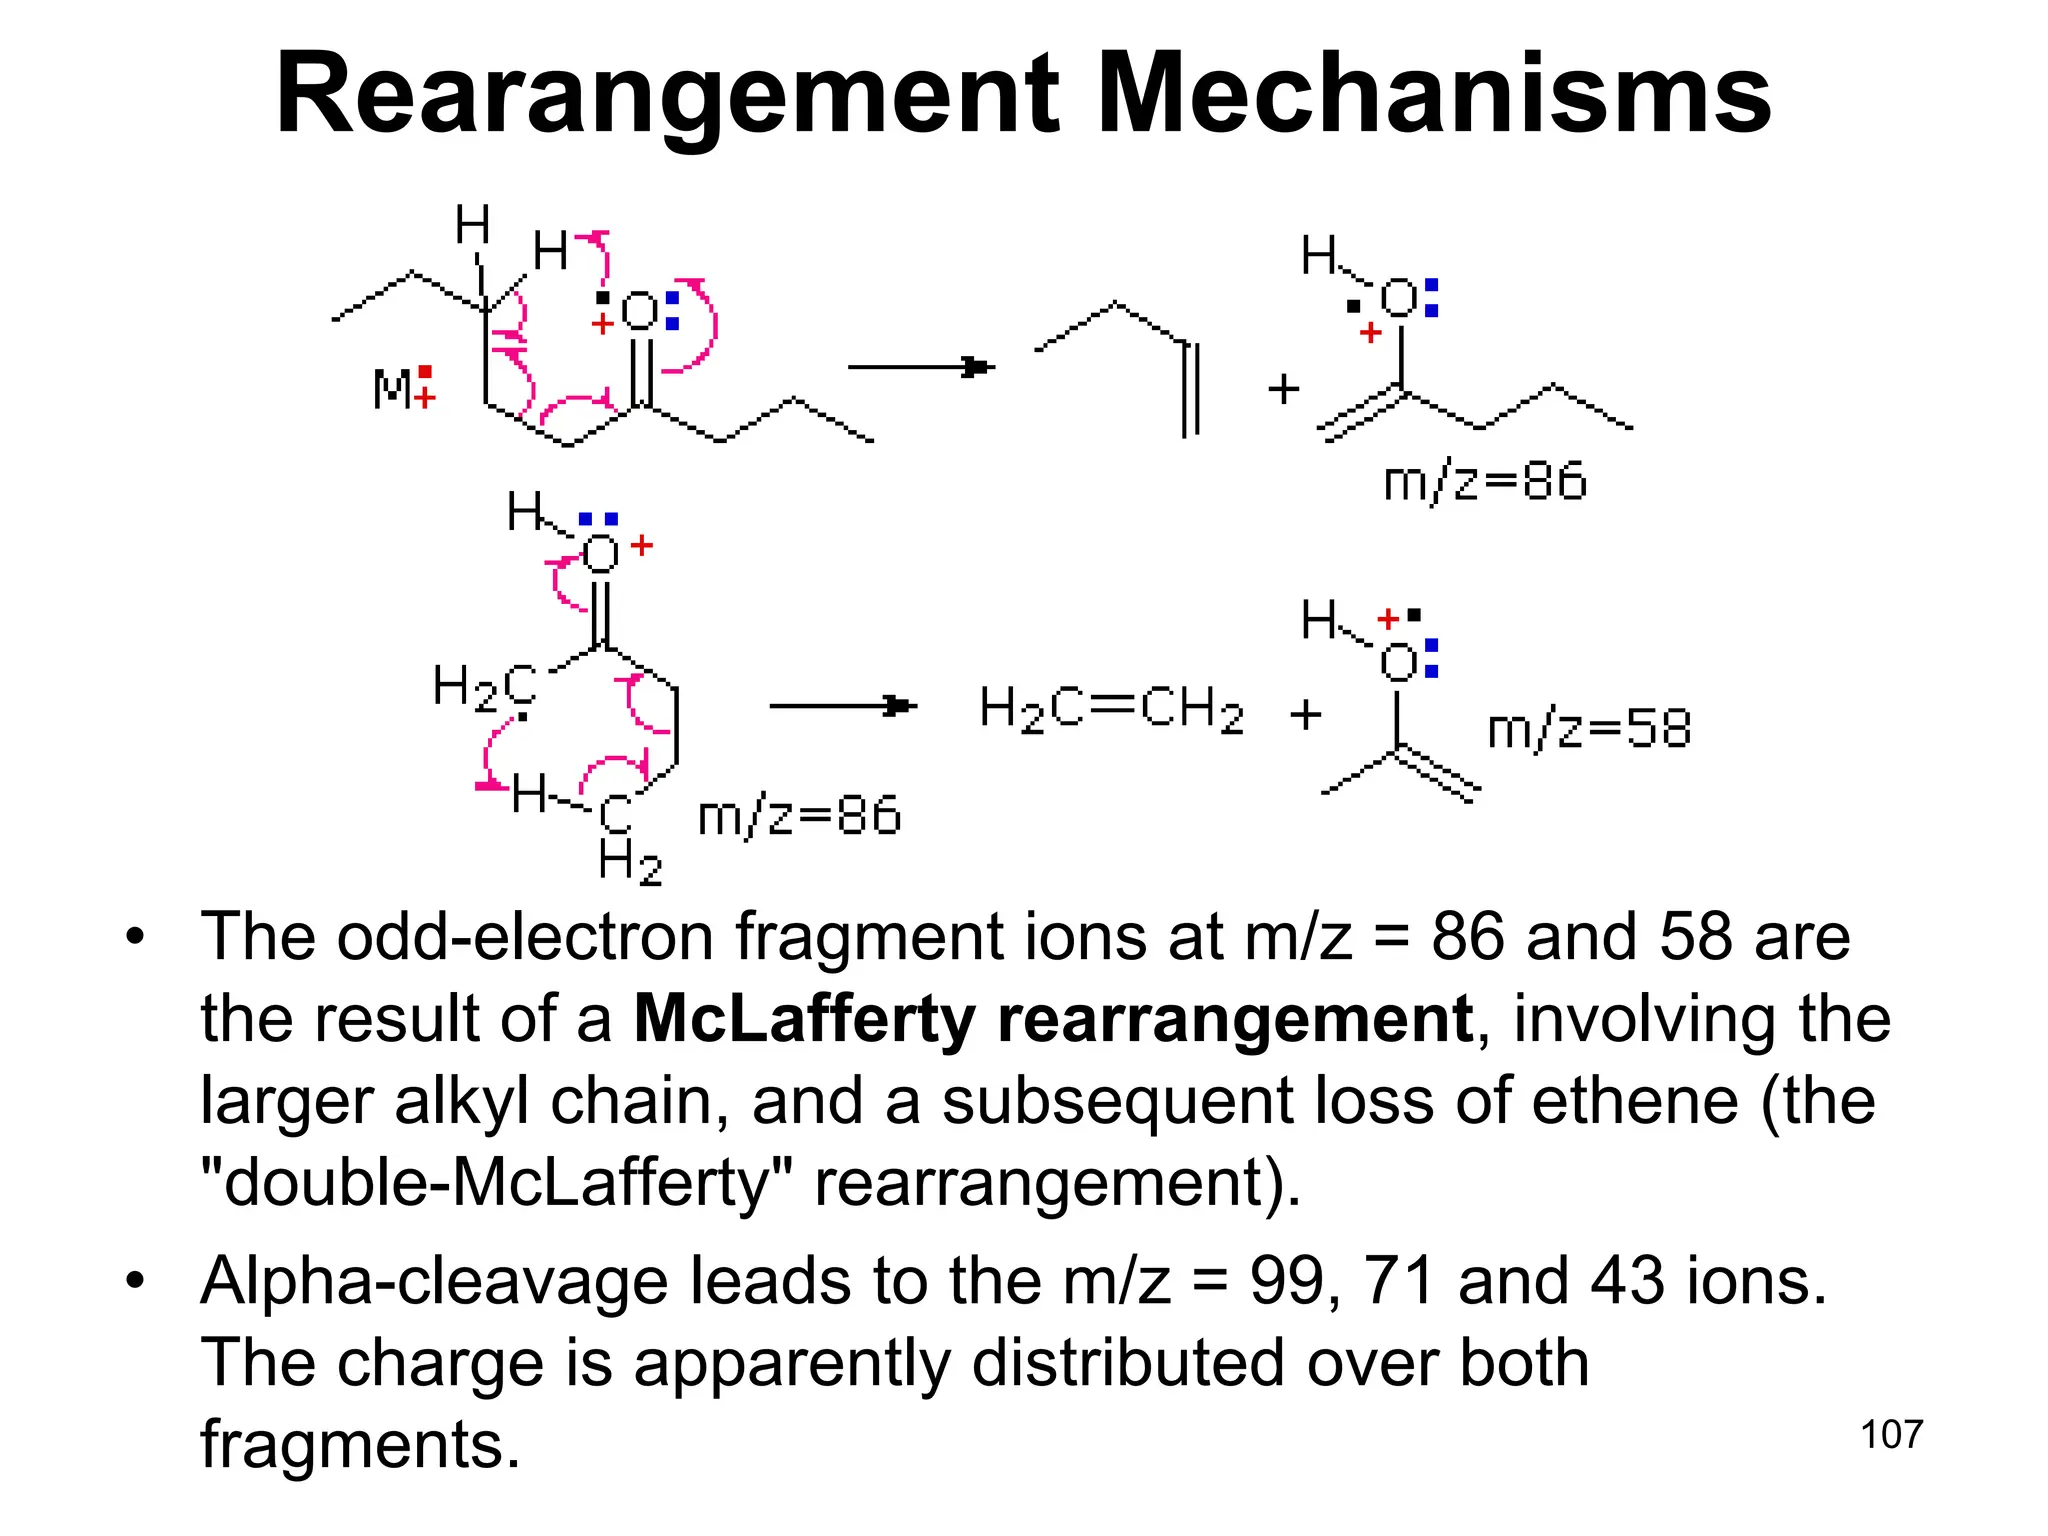
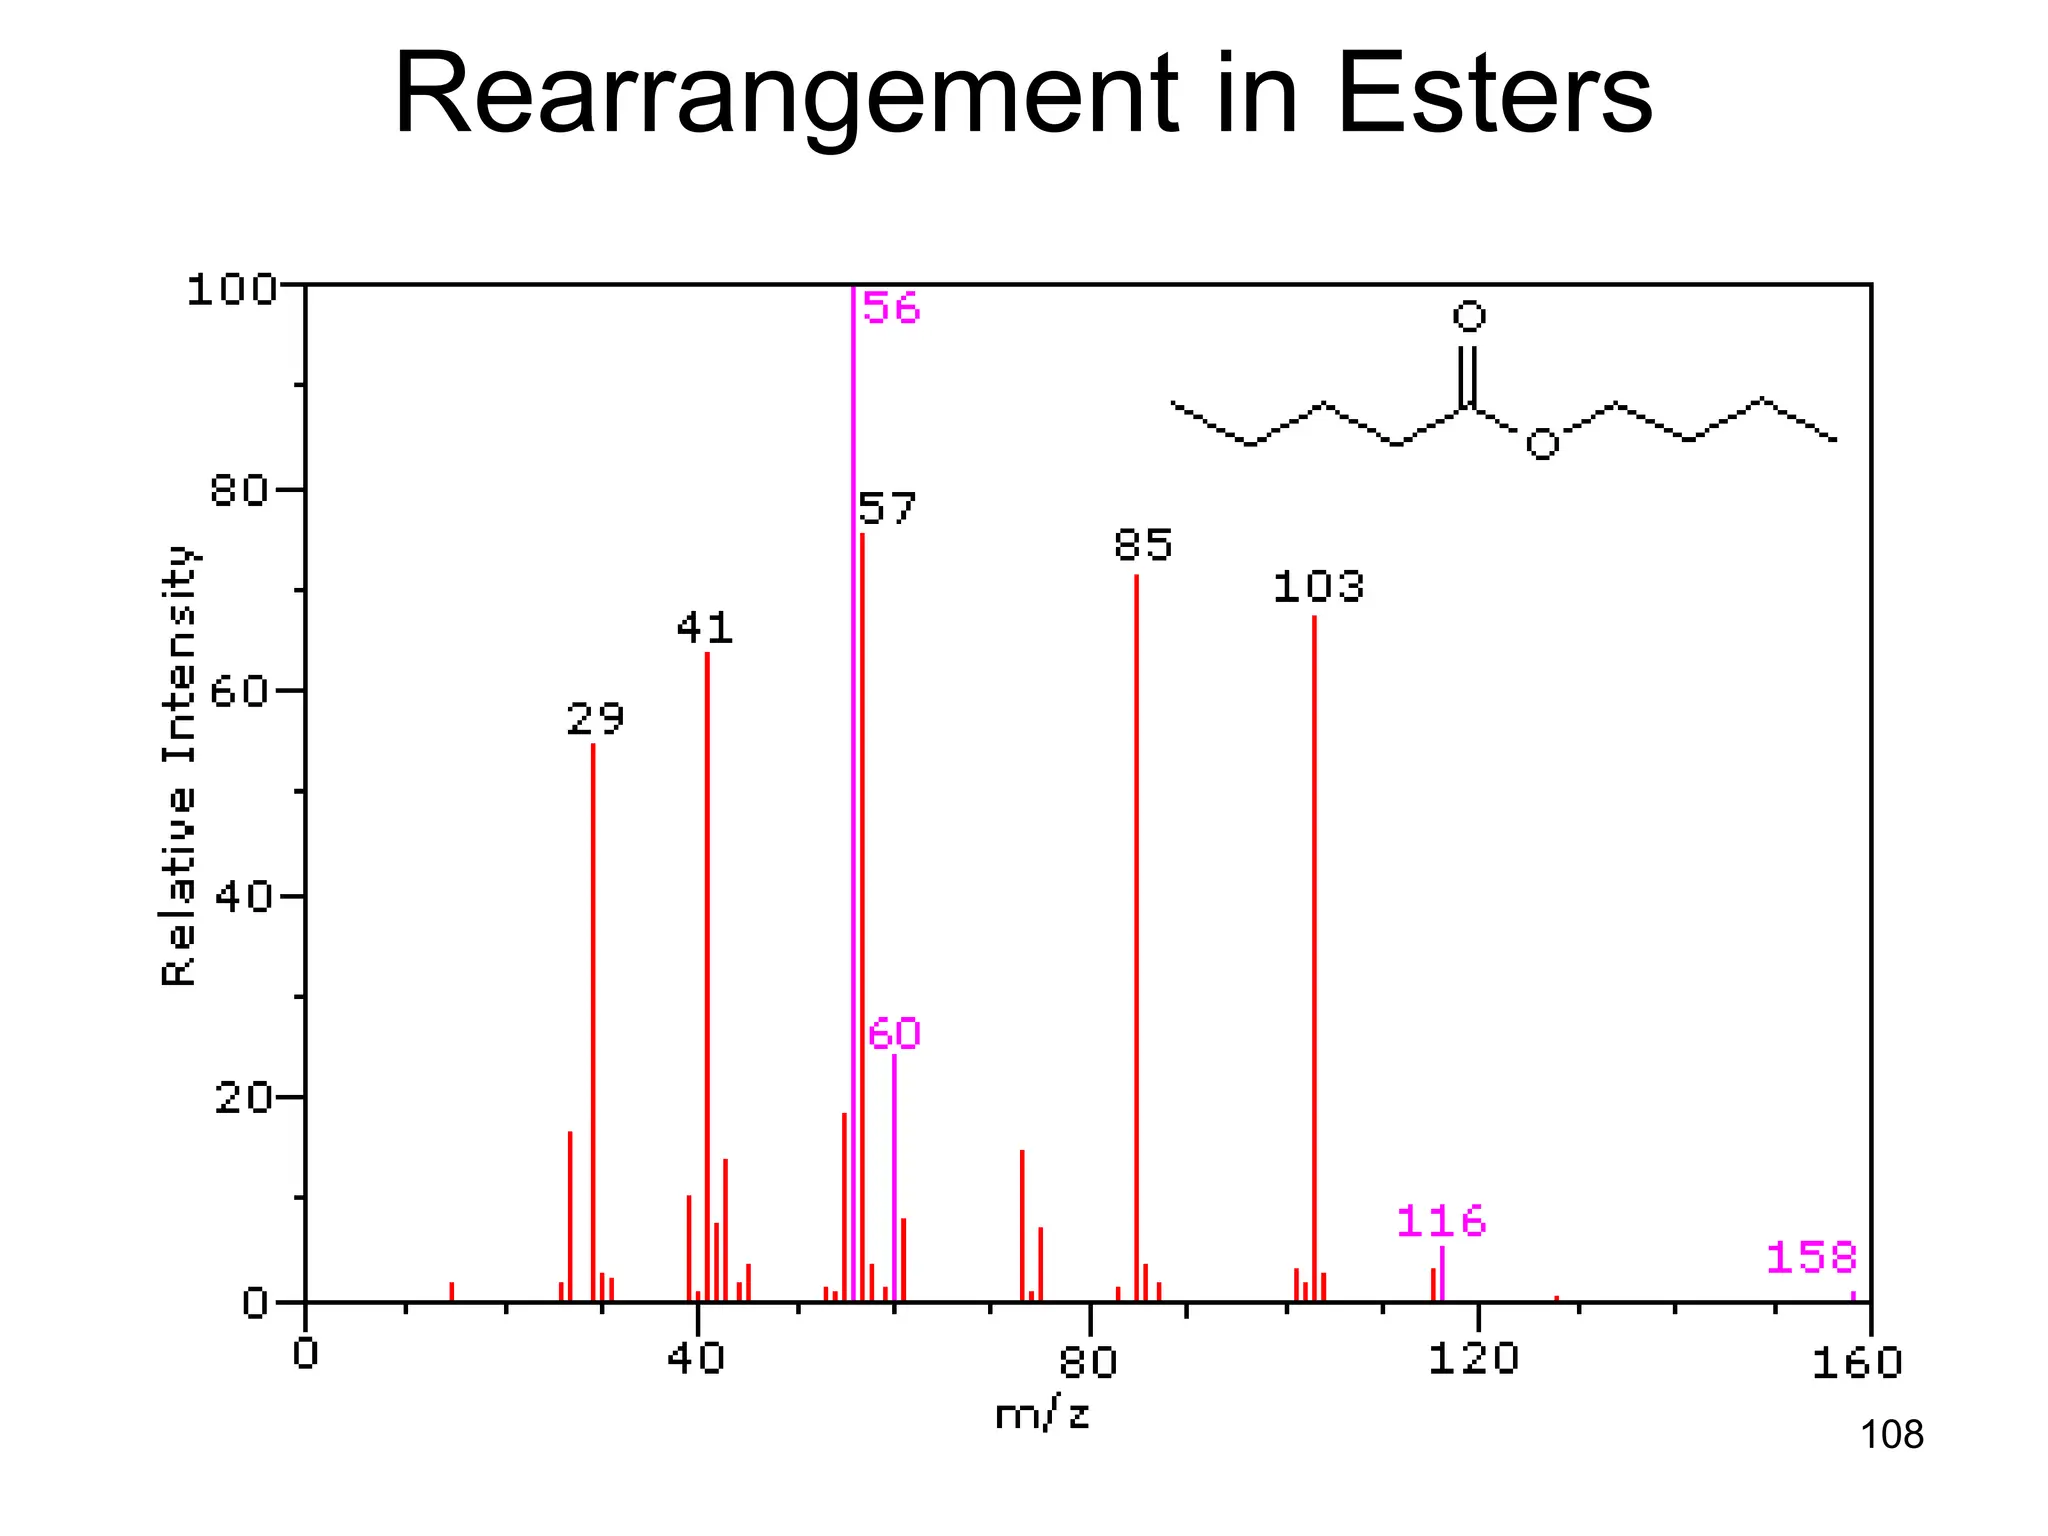
![109
Rearrangement in Esters
• Alpha-cleavage gives ions at m/z = 57 & 85
amu. The McLafferty rearrangement on the acid
side generates a m/z = 116 ion. Subsequent
rearrangement on the alcohol side generates
m/z = 60 and 56 ions. The m/z = 103 ion is
probably [C4H9CO2H2]+.](https://image.slidesharecdn.com/msirspectroscopy2023updated-240722073130-92424978/75/MS-IR-SPECTROSCOPY-blaco-updated-ppt-109-2048.jpg)