Download as PDF, PPTX


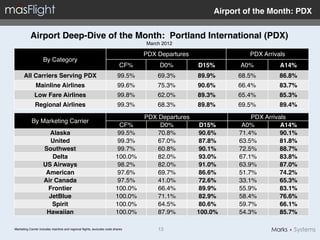


The March 2012 performance report for U.S. airlines outlines key operational statistics, including on-time performance and completion factors for various carriers. The report shows that overall, U.S. airlines had a completion factor of 98.9% for flights, with Hawaiian Airlines ranking highest for on-time arrivals at 91.7%. The document also highlights best and worst performing airports for departures and arrivals, as well as data on ground delays affecting operations.


