Download to read offline


![S. Mondal et al Int. Journal of Engineering Research and Applications
ISSN : 2248-9622, Vol. 3, Issue 6, Nov-Dec 2013, pp.2148-2152
www.ijera.com
REFERENCES
[1]
A.K. Sen, P.K. Karmakar, T.K. Das, A.K.
Devgupta,P.
K.
Chakraborty
and
S.Devbarman, “Significant heights for water
vapour content in the atmosphere”,
International Journal of Remote Sensing,
Vol. 10, pp. 1119–1124, 1989.
[2]
M. K. Raina, “Estimation of water vapour
attenuation
variations
at
microwave
frequencies,” Indian Journal of Radio and
Space Physics, Vol. 17, pp. 129-131, 1988.
P.K. Karmakar, M. Maiti, S. Mondal and
Carlo Frederico Angelis, “Determination of
window frequency in the millimeter wave
band in the range of 58 dgree north through
45 degree south over the globe” Advances
in Space Research ,Vol. 48, pp. 146–
151,2011.
[3]
[4]
P.K. Karmakar, M. Maiti, S. Sett, C. F.
Angelis and L. A.T. Machado, “Radiometric
estimation of water vapour Content over
Brazil,” Advances in Space Research, Vol.
48, pp. 1506–1514, 2011.
[5]
P. K. Karmakar, M. Maiti, Alan James P.
Calheiros, Carlos Frederico Angelis, Luiz
Augusto Toledo Machado and Simone
Sievert da Costa, “Ground-based singlefrequency
microwave
radiometric
measurement of water vapour,” International
Journal of Remote Sensing, pp. 1–11, 2011.
[6]
F.T Ulaby, R.K. Moore and A.K Fung,
“Microwave Remote Sensing: Active and
Passive,” vol. 1. Addison-Wesley Publishing
Company, 1981, pp. 282–283.
www.ijera.com
2152 | P a g e](https://image.slidesharecdn.com/mp3621482152-140101230027-phpapp01/85/Mp3621482152-5-320.jpg)

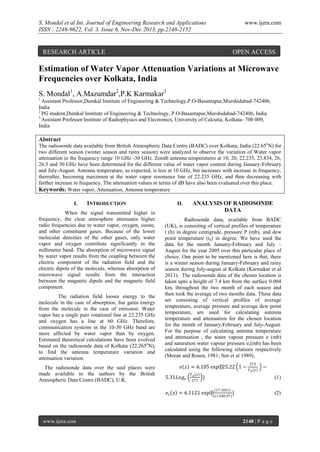
The document discusses the analysis of water vapor attenuation variations at microwave frequencies in Kolkata, India, over two seasons—winter and rainy—using radiosonde data. It highlights the relationship between antenna temperature and water vapor content across a frequency range of 10-30 GHz, noting that attenuation increases with frequency and peaks at the water vapor resonance line of 22.235 GHz. The findings are intended to aid the planning of communication systems in the microwave and millimeter wave regions.