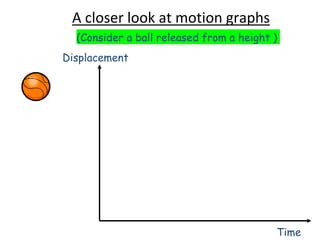
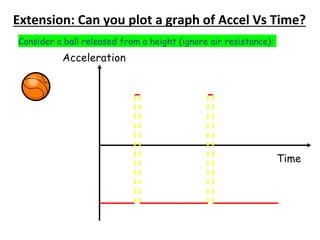
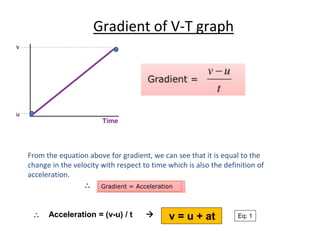
1.3 Mechanics
2.1 Equations of motion
Learning outcomes
1
Use graphical methods to represent distance, displacement, speed, velocity
and acceleration
2
Use graphical methods to analyse distance, displacement, speed, velocity
and acceleration
A closer look at motion graphs
(Consider a ball released from a height )
Displacement
Time
A closer look at motion graphs
Consider a ball released from a height :
Displacement
Time
Recall: Velocity-Time Graphs
A closer look at motion graphs
Consider a ball released from a height (Ignore Air resistance!)
Velocity
Time
A closer look at motion graphs
Velocity
Time
Consider a ball released from a height (Ignore Air resistance!)
Acceleration
Time
Extension: Can you plot a graph of Accel Vs Time?
Consider a ball released from a height (Ignore Air resistance!)
Extension: Can you plot a graph of Accel Vs Time?
Consider a ball released from a height (ignore air resistance):
Acceleration
Time
Gradient of V-T graph
From the equation above for gradient, we can see that it is equal to the
change in the velocity with respect to time which is also the definition of
acceleration.
v
u

 Acceleration = (v-u) / t  v = u + at Eq: 1
Area under V-t graph (constant velocity)
To find the area under the graph shown is:
area = height x base
area = velocity x time
However, recall that  Distance = Velocity x time
 Area under VT graph = Total distance travelled
Area under V-t graph (constant acceln)
To find the area under the graph shown:
Notes shape is a trapezium
area = ½ (A+B) x base
area = ½ (u + v) x time
Since Area under VT graph = Total distance travelled
We can say S = ½ (u + v) x t Eq: 2

Motion AS Edexcel.pptx

  • 1.
    1.3 Mechanics 2.1 Equationsof motion Learning outcomes 1 Use graphical methods to represent distance, displacement, speed, velocity and acceleration 2 Use graphical methods to analyse distance, displacement, speed, velocity and acceleration
  • 2.
    A closer lookat motion graphs (Consider a ball released from a height ) Displacement Time
  • 3.
    A closer lookat motion graphs Consider a ball released from a height : Displacement Time
  • 4.
  • 5.
    A closer lookat motion graphs Consider a ball released from a height (Ignore Air resistance!) Velocity Time
  • 6.
    A closer lookat motion graphs Velocity Time Consider a ball released from a height (Ignore Air resistance!)
  • 7.
    Acceleration Time Extension: Can youplot a graph of Accel Vs Time? Consider a ball released from a height (Ignore Air resistance!)
  • 8.
    Extension: Can youplot a graph of Accel Vs Time? Consider a ball released from a height (ignore air resistance): Acceleration Time
  • 9.
    Gradient of V-Tgraph From the equation above for gradient, we can see that it is equal to the change in the velocity with respect to time which is also the definition of acceleration. v u   Acceleration = (v-u) / t  v = u + at Eq: 1
  • 10.
    Area under V-tgraph (constant velocity) To find the area under the graph shown is: area = height x base area = velocity x time However, recall that  Distance = Velocity x time  Area under VT graph = Total distance travelled
  • 11.
    Area under V-tgraph (constant acceln) To find the area under the graph shown: Notes shape is a trapezium area = ½ (A+B) x base area = ½ (u + v) x time Since Area under VT graph = Total distance travelled We can say S = ½ (u + v) x t Eq: 2