Mortality quadrupled among opioid-driven hospitalizations notably within lower-income and disabled white populations
•
1 like•287 views

This study analyzed national hospitalization data from 1993-2014 to examine trends in mortality and characteristics of hospitalizations related to opioids compared to other drug and non-drug hospitalizations. The key findings were: 1) Mortality among opioid-related hospitalizations quadrupled from 0.43% before 2000 to 2.02% in 2014, increasing 0.12 percentage points per year relative to other drug hospitalizations. 2) While total opioid-related hospitalizations remained stable, diagnoses shifted from opioid dependence/abuse to opioid/heroin poisoning, which have higher mortality rates. Hospitalizations for poisoning grew by 0.01 per 1,000 people annually after 2000. 3) Patients hospitalized for opioid/

Recommended
Recommended
More Related Content
What's hot
What's hot (20)
Similar to Mortality quadrupled among opioid-driven hospitalizations notably within lower-income and disabled white populations
Similar to Mortality quadrupled among opioid-driven hospitalizations notably within lower-income and disabled white populations (20)
More from Paul Coelho, MD
More from Paul Coelho, MD (20)
Recently uploaded
Recently uploaded (20)
Mortality quadrupled among opioid-driven hospitalizations notably within lower-income and disabled white populations
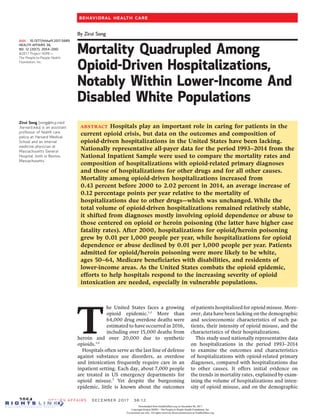
- 1. By Zirui Song Mortality Quadrupled Among Opioid-Driven Hospitalizations, Notably Within Lower-Income And Disabled White Populations ABSTRACT Hospitals play an important role in caring for patients in the current opioid crisis, but data on the outcomes and composition of opioid-driven hospitalizations in the United States have been lacking. Nationally representative all-payer data for the period 1993–2014 from the National Inpatient Sample were used to compare the mortality rates and composition of hospitalizations with opioid-related primary diagnoses and those of hospitalizations for other drugs and for all other causes. Mortality among opioid-driven hospitalizations increased from 0.43 percent before 2000 to 2.02 percent in 2014, an average increase of 0.12 percentage points per year relative to the mortality of hospitalizations due to other drugs—which was unchanged. While the total volume of opioid-driven hospitalizations remained relatively stable, it shifted from diagnoses mostly involving opioid dependence or abuse to those centered on opioid or heroin poisoning (the latter have higher case fatality rates). After 2000, hospitalizations for opioid/heroin poisoning grew by 0.01 per 1,000 people per year, while hospitalizations for opioid dependence or abuse declined by 0.01 per 1,000 people per year. Patients admitted for opioid/heroin poisoning were more likely to be white, ages 50–64, Medicare beneficiaries with disabilities, and residents of lower-income areas. As the United States combats the opioid epidemic, efforts to help hospitals respond to the increasing severity of opioid intoxication are needed, especially in vulnerable populations. T he United States faces a growing opioid epidemic.1,2 More than 64,000 drug overdose deaths were estimated to have occurred in 2016, including over 15,000 deaths from heroin and over 20,000 due to synthetic opioids.3,4 Hospitals often serve as the last line of defense against substance use disorders, as overdose and intoxication frequently require care in an inpatient setting. Each day, about 7,000 people are treated in US emergency departments for opioid misuse.5 Yet despite the burgeoning epidemic, little is known about the outcomes of patients hospitalized for opioid misuse. More- over, data have been lacking on the demographic and socioeconomic characteristics of such pa- tients, their intensity of opioid misuse, and the characteristics of their hospitalizations. This study used nationally representative data on hospitalizations in the period 1993–2014 to examine the outcomes and characteristics of hospitalizations with opioid-related primary diagnoses, compared with hospitalizations due to other causes. It offers initial evidence on the trends in mortality rates, explained by exam- ining the volume of hospitalizations and inten- sity of opioid misuse, and on the demographic doi: 10.1377/hlthaff.2017.0689 HEALTH AFFAIRS 36, NO. 12 (2017): 2054–2061 ©2017 Project HOPE— The People-to-People Health Foundation, Inc. Zirui Song (song@hcp.med .harvard.edu) is an assistant professor of health care policy at Harvard Medical School and an internal medicine physician at Massachusetts General Hospital, both in Boston, Massachusetts. 2054 Health Affairs December 2017 36:12 Behavioral Health Care Downloaded from HealthAffairs.org on December 06, 2017. Copyright Project HOPE—The People-to-People Health Foundation, Inc. For personal use only. All rights reserved. Reuse permissions at HealthAffairs.org.
- 2. and socioeconomic characteristics of affected patients. Study Data And Methods Data Data for the period 1993–2014 were gath- ered from the National Inpatient Sample of the Healthcare Cost and Utilization Project—the na- tion’s largest all-payer inpatient database, which was developed by the Agency for Healthcare Research and Quality.6 The database contains information for about eight million hospitaliza- tions per year obtained from a stratified sample of US hospitals. Historically it included informa- tion about all discharges from approximately 20 percent of hospitals nationwide.7 Beginning in 2012, it included information from about 20 percent of discharges from all participating hospitals, which improved the stability of the nationally representative estimates.8 Sample weights produce national estimates. Data fields are standardized across hospitals, payers, and states. Annual estimates of the US resident pop- ulation from the Census Bureau were used to standardize the volume of hospitalizations by population.9 Types of hospitalizations were defined using the International Classification of Diseases, Ninth Revision (ICD-9), diagnosis code in the primary diagnosis field. Hospitalizations due to opioids were defined as those in which the primary diag- nosis field contained an ICD-9 code for non- dependent opioid abuse, opioid dependence, opioid codependence with other substances, opi- oid poisoning, or poisoning by a specific opioid product such as methadone or heroin (for opi- oid-related ICD-9 diagnosis codes, see online Appendix A).10 Validations for these codes, with a focus on the detection of opioid overdoses, have demonstrated a high positive predictive val- ue and high specificity across different cohorts and areas of the country.11–14 Non-opioid hospitalizations were divided into two groups: those with a primary diagnosis due to other drugs (alcohol, cocaine, and other substances) and all hospitalizations with other primary diagnoses. Hospitalizations for other drugs were those with a primary diagnosis code in Major Diagnostic Categories 20 (alcohol or drug use or induced mental disorders) or 21 (in- juries, poison, and toxic effect of drugs). Major Diagnostic Categories classify all diagnosis codes into twenty-five mutually exclusive catego- ries and are used across payers (for the list of categories, see Appendix B).10 Variables The key outcome variable of inter- est was in-hospital mortality. Secondary out- comes were hospital charges per day, hospital costs per day, and lengths-of-stay. Hospital charges excluded professional fees and non- covered services, and they were standardized by the data distributor by removing excessively high or low amounts. Hospital costs were calcu- lated using the National Inpatient Sample cost- to-charge ratios, which were derived in a stan- dardized manner.15 Hospital charges and costs differ from the administratively set or negotiated fees that are reimbursed, but they provide a proxy for resource use that is comparable across hospitalizations. Length-of-stay, reported in days, typically reflected the number of midnights crossed during a hospitalization. Patient characteristics included age, sex, race/ ethnicity, primary payer, comorbidities, and quartile of median household income based on the patient’s ZIP code of residence. Major racial/ ethnic categories included white, black, and Hispanic. Major payercategories wereMedicare, Medicaid, private insurance, and self-pay. Comorbidities were characterized using the Elixhauser Comorbidity Index.16 While the use of a typical claims-based risk-adjustment model was not feasible in the absence of enrollment data, the Elixhauser index has been shown to outperform other standardized measures of co- morbidity, such as the Charlson Comorbidity Index.17–21 Hospital characteristics included size, urban or rural setting, teaching or nonteaching status, and region. Unadjusted Analysis Characteristics and outcomes of opioid-driven hospitalizations were compared to those of hospitalizations for other drugs and hospitalizations for all other causes. Differences were examined using the t-test, Wilcoxon-Mann-Whitney test for samples with- out assumed normal distributions, and the chi- square test for categorical variables. The population-adjusted volume of hospital- izations (that is, the hospitalization rate) was calculated by dividing the nationally representa- tive number of hospitalizations by the resident US population in each year. The volume of opi- oid-driven hospitalizations was decomposed ac- cording to type of opioid misuse—from opioid abuse and dependence to opioid and heroin poi- soning. Hospitalizations for opioid and heroin poisoning were examined by age, sex, race/eth- nicity, primary payer, and quartile of median household income. Adjusted Analyses A linear multivariable model was used to evaluate changes in mortality among opioid-driven hospitalizations relative to hospitalizations for otherdrugs.With data aggre- gated to the annual level, the key independent variables included an indicator for the type of hospitalization, secular trend, and their interac- tion term—which captured differences in mor- tality trends among opioid-driven hospitaliza- December 2017 36:12 Health Affairs 2055 Downloaded from HealthAffairs.org on December 06, 2017. Copyright Project HOPE—The People-to-People Health Foundation, Inc. For personal use only. All rights reserved. Reuse permissions at HealthAffairs.org.
- 3. tions after accounting for mortality trends in hospitalizations for other drugs. In a segmented regression framework, the model further speci- fied a secondary trend after 2000 to allow for differences in mortality trends after that time, given the increased availability of opioids that began at the turn of the century.22–25 Additional independent variables included age, sex, race/ ethnicity, payer, quartile of median household income, Elixhauser Comorbidity Index, proce- dures during the hospitalization, and month of admission. Sensitivity analyses, including alterations in the covariates and the model, tested the robust- ness of main estimates. Additional sensitivity analyses included a segmented regression model at the hospitalization level with analogous inde- pendent variables, sample weights, and hospital fixed effects that accounted for time-invariant hospital factors. Standardized errors were clus- tered by hospital. Reported p values are two- tailed. Limitations This study had several limita- tions. First, patient identifiers were excluded from the data for confidentiality. Thus, each observation was a distinct hospitalization, and readmissions were not identifiable. Second, the sampling strategy in the National Inpatient Sample changed in 2012, as discussed above. However, the data continued to capture about 20 percent of hospitalizations nation- wide.8 Third, hospital charges and costs are not syn- onymous with each other or with the actual amounts reimbursed by the payer, although they do make it possible to use billing as a proxy for resource use during hospitalizations in these data.26 Fourth, ICD-9 diagnosis codes, despite their validation in capturing opioid misuse, are likely to have some degree of subjectivity and measure- ment error. Nevertheless, the codes are the best instrument available in most administrative da- tabases for identifying the cause of hospitaliza- tion. This study employed a conservative defini- tion of the cause of hospitalization by using only the primary ICD-9 diagnosis code.While this nar- rowed the sample of hospitalizations that could be considered opioid related, it avoided contam- inating the sample with hospitalizations for other indications in which an opioid-related code was used in a secondary diagnosis field. This approach differs from that of previous re- search that defined opioid-related hospitaliza- tions using all diagnosis fields and that did not find an increase in mortality.27 The focus on the primary diagnosis code is somewhat novel and not widely established. The specific code in the primary diagnosis field might also be influenced by awareness of the opioid epidemic among pro- viders or changes in coding behavior. However, the primary diagnosis code is meant to reflect the clinician’s judgment of the chief cause of admis- sion, and thus it provides a meaningful lens through which to examine the reason for hospi- talization in a more targeted manner. Study Results Study Population For the period 1993–2014, the raw data in the National Inpatient Sample comprised 384,611 hospitalizations that were primarily opioid driven, 3,840,028 hospitaliza- tions due to other drugs, and 159,265,806 hos- pitalizations due to all othercauses. After sample weights were applied, the nationally representa- tive sample was estimated to comprise 1,934,326 hospitalizations due to opioids, 19,220,610 due to other drugs, and 794,406,343 due to all other causes (for unweighted and weighted numbers of hospitalizations, see Appendix C).10 On average across the study period, patients with opioid-driven hospitalizations were youn- ger (38.9 years) than patients hospitalized for other drugs (44.2 years) and for all other causes (47.6 years) (for patient and hospital character- istics, see Appendix D).10 Similarly, relative to these two comparison groups, patients with opi- oid-driven hospitalizations were less likely to be white (53.8 percent versus 57.4 percent and 56.8 percent, respectively) and more likely to have Medicaid (40.1 percent versus 23.0 percent and 18.7 percent, respectively), be self-pay (un- insured) (17.2 percent versus 15.1 percent and 4.7 percent, respectively), and live in areas with the lowest quartile of median household income (32.3 percent versus 28.0 percent and 25.2 per- cent, respectively). Opioid-driven hospitalizations were more likely than hospitalizations for other drugs or for all other causes to occur in urban teaching hospitals (50.4 percent versus 49.7 percent and 46.7 percent, respectively). Despite the fact that the largest numbers of hospitalizations in this data came from the South and Midwest, a disproportionately large share of opioid-driven hospitalizations occurred in the Northeast, relative to the shares of the two comparison groups of hospitalizations (43.9 percent versus 25.5 percent and 19.5 percent, respectively) (see Appendix D).10 Changes In Mortality Rates The unadjusted in-hospital mortality rates for opioid-driven hospitalizations were relatively constant before 2000, averaging 0.43 percent (that is, 4.3 deaths per thousand admissions) (Exhibit 1). Between 2000 and 2007 the rates more than doubled (to 1.05 percent), and by 2014 they had nearly dou- Behavioral Health Care 2056 Health Affairs December 2017 36:12 Downloaded from HealthAffairs.org on December 06, 2017. Copyright Project HOPE—The People-to-People Health Foundation, Inc. For personal use only. All rights reserved. Reuse permissions at HealthAffairs.org.
- 4. bled again (to 2.02 percent, or 20.2 deaths per thousand admissions). In contrast, mortality rates among hospitalizations due to other drugs remained stable throughout the study period, averaging 0.71 percent before and 0.75 percent after 2000. The mortality trend for all other hos- pitalizations in the United States steadily de- creased throughout the period, from more than five times that for opioid-driven hospitalizations in 1993 to slightly below it by 2014. The results of adjusted analyses showed that differences between mortality trends among hospitalizations due to opioids and those among hospitalizations due to other drugs remained constant before 2000 (a difference of −0.003 percentage points per year; p ¼ 0:75). After 2000, however, mortality among hospitaliza- tions due to opioids increased, on average, 0.12 percentage points (that is, 1.2 deaths per thousand) per year more than mortality among hospitalizations due to other drugs (p < 0:001). There was no significant change in mortality among hospitalizations due to other drugs (p ¼ 0:25) during the study period. These ad- justed mortality rates are visually displayed in Appendix E; the results of sensitivity analyses were consistent with those of the main analysis, as shown in Appendix F.10 Decomposition Of Changes In Mortality Given that in-hospital mortality rates are the ratios of deaths (the numerator) to the volume of hospitalizations (the denominator),therising mortality rates among opioid-driven hospitaliza- tions could be explained by either a decrease in the volume of hospitalizations, an increase in the likelihood of death from opioid-driven hospital- izations (that is, the case fatality rate), or a com- bination of these factors. The volume of hospitalizations in the United States due to opioids remained relatively con- stant during the study period, averaging 0.3 hospitalizations per thousand people (Appen- dix G).10 Compared with hospitalizations due to other drugs, the average change was not sig- nificantly different (0.0004 hospitalizations per thousand per year; p ¼ 0:97) (data not shown). Within this stable volume of opioid-driven hospitalizations, however, an increasing share involved more intensive forms of opioid use. Hospitalizations for opioid dependence or abuse decreased, whereas hospitalizations for opioid poisoning—and, more recently, for heroin poisoning—increased (Exhibit 2). The results from adjusted analyses showed that hospitaliza- tions for opioid dependence or abuse declined by 0.01 per thousand people per year (p < 0:001), while those for opioid and heroin poisoning col- lectively grew on average by 0.01 per thousand people per year (p < 0:001). During the study period, the case fatality rate of hospitalizations for opioid dependence or abuse averaged 0.13 percent, whereas that for hospitalizations due to opioid poisoning and heroin poisoning averaged 2.86 percent (opioid poisoning: 2.30 percent; heroin poisoning: 4.87 percent) (Appendix H).10 This gap remained fairly stable as the overall mortality rate of opi- oid-driven hospitalizations grew after 2000. The results from adjusted analyses showed that the case fatality rate for hospitalizations due to opi- oid and heroin poisoning grew by 0.006 percent- age points per year (p ¼ 0:84), relative to that for hospitalizations for opioid dependence or abuse (data not shown). Hospitalizations For Opioid And Heroin Poisoning The evolution of opioid-driven hos- pitalizations from opioid dependence or abuse toward opioid and heroin poisoning was not evenly distributed across demographic and so- cioeconomic dimensions. A decomposition of hospitalizations due to opioid and heroin poi- soning (that is, those with a higher intensity of abuse) by age and sex demonstrated that forboth men and women, those ages 50–64 accounted for the fastest-growing share of the hospitaliza- tions during the study period (Appendix I).10 A decomposition of hospitalizations due to opioid and heroin poisoning by race showed that white patients accounted for the largest and fast- est-growing share of hospitalizations in recent years (Exhibit 3). Analogously, a decomposition Exhibit 1 In-hospital mortality rates among people hospitalized for opioid-related primary diagnoses and other primary diagnoses in the United States, 1993–2014 SOURCE Author’s analysis of data from the Healthcare Cost and Utilization Project (see Note 6 in text). NOTE The categories of primary diagnoses are explained in the text. December 2017 36:12 Health Affairs 2057 Downloaded from HealthAffairs.org on December 06, 2017. Copyright Project HOPE—The People-to-People Health Foundation, Inc. For personal use only. All rights reserved. Reuse permissions at HealthAffairs.org.
- 5. of these hospitalizations by quartile of median household income demonstrated that patients in the lowest quartile accounted for the largest and fastest-growing share (Appendix J).10 A decomposition of hospitalizations due to opioid and heroin poisoning by payer showed that people enrolled in Medicare, not those in Medicaid, accounted for the fastest-growing share. Medicare beneficiaries went from the smallest proportion of these hospitalizations in the 1990s to the largest share by the mid- 2000s (Exhibit 4). Medicare beneficiaries hospi- talized for opioid or heroin poisoning were, on average, 59.8 years old, which was younger than Medicare beneficiaries hospitalized for other drugs (63.6 years) and for all other indications (73.6 years). Overall, 59.3 percent of Medicare beneficiaries hospitalized for opioid or heroin poisoning were younger than age sixty-five, com- pared with 42.2 percent among beneficiaries hospitalized for other drugs and 15.6 percent among beneficiaries hospitalized for all other indications. Given that nearly all Medicare ben- eficiaries younger than age sixty-five receive Social Security Disability Insurance, most Medi- care beneficiaries hospitalized for opioid or heroin poisoning were thus likely to have physi- cal or mental disabilities.28 Secondary Outcomes While mortality among opioid-driven hospitalizations increased relative to mortality among hospitalizations for drugs and for other causes, indicators of re- source use during opioid-driven hospitalizations did not demonstrate a significantly different rate of change relative to those of other hospitaliza- tions (Appendix K1).10 On average, after 2000, hospital charges per opioid-driven hospitaliza- tion increased $73 per hospitalization per year (p ¼ 0:74) relative to hospitalizations for other drugs. Relative to hospitalizations for all other causes, charges per opioid-driven hospitaliza- tion decreased $68 per hospitalization per year (p ¼ 0:84). These differential changes were similarly not significant when charges were con- verted to hospital costs. Length-of-stay among opioid-driven hospital- izations increased, on average, 0.14 day per year (p ¼ 0:02) after 2000, relative to that among hospitalizations for other drugs and 0.18 day per year (p ¼ 0:008) relative to that of hospital- izations for all other causes (Appendix L).10 Re- sults from adjusted analyses that normalized hospital charges by length-of-stay showed that charges per day among opioid-driven hospital- izations did not change significantly relative to those for hospitalizations due to other drugs (a decline of $33; p ¼ 0:46) or all other causes (a decline of $53; p ¼ 0:49) (Appendix K2).10 Exhibit 2 Hospitalizations per 1,000 people in the United States for opioid-related primary diagnoses by type, 1993–2014 SOURCE Author’s analysis of data from the Healthcare Cost and Utilization Project (see Note 6 in text) and the Census Bureau. NOTE The categories of primary diagnoses are explained in the text. Exhibit 3 Hospitalizations in the United States for opioid and heroin poisoning by race/ethnicity, 1993–2014 SOURCE Author’s analysis of data from the Healthcare Cost and Utilization Project (see Note 6 in text). NOTE The numbers of hospitalizations are weighted to reflect nationally representative totals. Behavioral Health Care 2058 Health Affairs December 2017 36:12 Downloaded from HealthAffairs.org on December 06, 2017. Copyright Project HOPE—The People-to-People Health Foundation, Inc. For personal use only. All rights reserved. Reuse permissions at HealthAffairs.org.
- 6. Discussion Mortality rates among opioid-driven hospital- izations have increased more than fourfold in recent years. This stands in stark contrast to the stable mortality rates for hospitalizations for other drugs and the decreasing mortality rates among all other hospitalizations in the United States. Within the group of opioid-driven hospitaliza- tions, as defined using the primary diagnosis code, the overall rate of hospitalizations changed little. However, the severity of these hospitalizations intensified, as hospitalizations for opioid dependence or abuse were replaced by those for opioid and heroin poisoning. Among patients hospitalized for opioid or heroin poi- soning, the fastest-growing segments were peo- ple who were ages 50–64, white, and Medicare beneficiaries, and those who lived in areas with the lowest quartile of median household income. The fact that Medicare beneficiaries—the ma- jority of whom were younger than age sixty- five—accounted for the fastest-growing and larg- est share by payer of hospitalizations for opioid and heroin poisoning is consistent with in- creased opioid use among disabled Medicare beneficiaries. Nearly all beneficiaries younger than age sixty-five receive Social Security Dis- ability Insurance, and over 40 percent of dis- abled beneficiaries use prescription opioids— with a growing proportion using opioids chroni- cally.29 The demographic makeup of the popula- tion hospitalized for opioids in these data reflects the burden of opioid morbidity and mortality nationally outside of the hospital set- ting.30,31 These results are also consistent with broader trends in rising mortality rates in the United States due to poisonings: Relative to oth- er developed nations, in the United States the increases are concentrated among middle-age, socioeconomically disadvantaged white popula- tions.32 In recent years, data from the National Vital Statistics System have suggested that overall deaths in the United States due to opioid anal- gesics began to plateau in 2006.33 Similarly, the Researched Abuse, Diversion, and Addiction- Related Surveillance System showed that diver- sion and abuse of prescription opioid medica- tions plateaued or declined between 2011 and 2013.34 Despite these encouraging develop- ments, this study found that in-hospital mortali- ty rates for opioid-driven hospitalizations de- fined by the primary diagnosis code have continued to climb in recent years. The fact that patients who are hospitalized may fare worse is consistent with the increasing severity of opioid abuse, especially among vulnerable and disabled populations.35 The detailed mechanisms behind these trends require further study. However, three potential mechanisms may help explain these descriptive findings. First, more potent opioids such as fentanyl, which can be 50–100 times as strong as heroin, have become increasingly available in the United States.2,36,37 Second, the price of pre- scription opioids such as oxycodone has re- mained higher than or increased relative to the price of heroin, which has likely contributed to the substitution pattern seen here and more broadly nationwide.38,39 Third, as the medical and public health communities respond to the opioid crisis, less severe cases of opioid poison- ing may have been increasingly treated in the field, outpatient settings, or the emergency de- partment, thus leaving a greater proportion of more severe cases for inpatient admission. Conclusion This is the first evaluation of nationally repre- sentative, multipayer data on the mortality rates and composition of opioid-driven hospitaliza- tions in the United States, defined using the pri- mary diagnosis code. Along with a growing liter- ature, these findings resonate with the call for increased resources to help communities at risk. Policy makers have begun taking such steps.40,41 The Department of Health and Human Services budgeted $94 million for federally qualified health centers to combat opioid use disorders.42 Exhibit 4 Hospitalizations in the United States for opioid and heroin poisoning by payer, 1993–2014 SOURCE Author’s analysis of data from the Healthcare Cost and Utilization Project (see Note 6 in text). NOTE The numbers of hospitalizations are weighted to reflect nationally representative totals. December 2017 36:12 Health Affairs 2059 Downloaded from HealthAffairs.org on December 06, 2017. Copyright Project HOPE—The People-to-People Health Foundation, Inc. For personal use only. All rights reserved. Reuse permissions at HealthAffairs.org.
- 7. The Comprehensive Addiction and Recovery Act of 2016 and recent federal budgets have included additional funding.43 As the nation moves for- ward in its effort to slow the opioid epidemic, such funding may have heterogeneous impacts across different populations. Notably, it can be especially challenging to implement effective in- terventions within disadvantaged populations. For instance, laws that restrict the prescribing and dispensing of opioids have not been associ- ated with reduced opioid use or overdose among disabled Medicare beneficiaries.44 Until community-based efforts to tackle opioid misuse have taken root, treating opioid addic- tion and better equipping hospitals to care for patients with increasingly severe opioid abuse may help the health care system combat the ris- ing mortality rates of patients hospitalized for opioid use disorders. ▪ An earlier version of this article was presented at the AcademyHealth Annual Research Meeting, June 26, 2017, in New Orleans, Louisiana; the National Meeting of the Society of General Internal Medicine (SGIM), April 22, 2017, in Washington, D.C.; and the New England Region Meeting of the SGIM, March 10, 2017, in Boston, Massachusetts. The work was supported by the Office of the Director of the National Institutes of Health (NIH Director’s Early Independence Award No. 1DP5OD024564-01). The author acknowledges Jean Roth and Mohan Ramanujan at the National Bureau of Economic Research for assistance with the data. The author is grateful for comments and suggestions from seminar participants at Massachusetts General Hospital, the Massachusetts Health Policy Commission, and the Dartmouth Institute for Health Policy and Clinical Practice, as well as attendees of the AcademyHealth and SGIM meetings. NOTES 1 Bose J, Hedden SL, Lipari RN, Park- Lee E, Porter JD, Pemberton MR. Key substance use and mental health indicators in the United States: re- sults from the 2015 National Survey on Drug Use and Health [Internet]. Rockville (MD): Substance Abuse and Mental Health Services Admin- istration; 2016 [cited 2017 Oct 23]. (HHS Publication No. SMA 16-4984, NSDUH Series H-51). Available from: https://www.samhsa.gov/ data/sites/default/files/NSDUH- FFR1-2015/NSDUH-FFR1-2015/ NSDUH-FFR1-2015.pdf 2 Rudd RA, Seth P, David F, Scholl L. Increases in drug and opioid- involved overdose deaths—United States, 2010–2015. MMWR Morb Mortal Wkly Rep. 2016;65(5051): 1445–52. 3 National Institute on Drug Abuse. Overdose death rates [Internet]. Bethesda (MD): NIDA; [revised 2017 Sep; cited 2017 Oct 23]. Available from: https://www.drugabuse.gov/ related-topics/trends-statistics/ overdose-death-rates 4 National Center for Health Statistics. NCHS data on drug-poisoning deaths [Internet]. Hyattsville (MD): NCHS; 2017 Aug [cited 2017 Oct 23]. (NCHS Fact Sheet). Available from: https://www.cdc.gov/nchs/data/ factsheets/factsheet_drug_ poisoning.pdf 5 Centers for Disease Control and Prevention. Opioid overdose: un- derstanding the epidemic [Internet]. Atlanta (GA): CDC; [last updated 2017 Aug 30; cited 2017 Oct 23]. Available from: https://www.cdc .gov/drugoverdose/epidemic/ index.html 6 Healthcare Cost and Utilization Project. NIS overview [Internet]. Rockville (MD): Agency for Health- care Research and Quality; [last modified 2017 Mar 22; cited 2017 Oct 23]. Available from: https:// www.hcup-us.ahrq.gov/ nisoverview.jsp 7 Healthcare Cost and Utilization Project. Introduction to the HCUP Nationwide Inpatient Sample (NIS) 2011 [Internet]. Rockville (MD): Agency for Healthcare Research and Quality; [updated 2015 Nov; cited 2017 Oct 23]. Available from: https://www.hcup-us.ahrq.gov/db/ nation/nis/NIS_Introduction_ 2011.pdf 8 Houchens R, Ross D, Elixhauser A, Jiang J. HCUP Methods Series: Na- tionwide Inpatient Sample (NIS) redesign final report [Internet]. Rockville (MD): Agency for Health- care Research and Quality; 2014 Apr 4 [cited 2017 Oct 23]. (Report No. 2014-04). Available from: https://www.hcup-us.ahrq.gov/ reports/methods/2014-04.pdf 9 Census Bureau. American Fact Finder [Internet]. Washington (DC): Census Bureau; [cited 2017 Oct 23]. Available from: https://factfinder .census.gov/faces/nav/jsf/pages/ index.xhtml 10 To access the Appendix, click on the Details tab of the article online. 11 Reardon JM, Harmon KJ, Schult GC, Staton CA, Waller AE. Use of diag- nosis codes for detection of clinically significant opioid poisoning in the emergency department: a retrospec- tive analysis of a surveillance case definition. BMC Emerg Med. 2016; 16:11. 12 Ellison J, Walley AY, Feldman JA, Bernstein E, Mitchell PM, Koppelman EA, et al. Identifying patients for overdose prevention with ICD-9 classification in the emergency department, Massachu- setts, 2013–2014. Public Health Rep. 2016;131(5):671–5. 13 Rowe C, Vittinghoff E, Santos GM, Behar E, Turner C, Coffin PO. Per- formance measures of diagnostic codes for detecting opioid overdose in the emergency department. Acad Emerg Med. 2017;24(4):475–83. 14 Green CA, Perrin NA, Janoff SL, Campbell CI, Chilcoat HD, Coplan PM. Assessing the accuracy of opioid overdose and poisoning codes in diagnostic information from elec- tronic health records, claims data, and death records. Pharmacoepide- miol Drug Saf. 2017;26(5):509–17. 15 Healthcare Cost and Utilization Project. Cost-to-charge ratio files [Internet]. Rockville (MD): Agency for Healthcare Research and Quality; [last modified 2017 May 23; cited 2017 Oct 23]. Available from: https://www.hcup-us.ahrq.gov/db/ state/costtocharge.jsp 16 Elixhauser A, Steiner C, Harris DR, Coffey RM. Comorbidity measures for use with administrative data. Med Care. 1998;36(1):8–27. 17 Charlson ME, Pompei P, Ales KL, MacKenzie CR. A new method of classifying prognostic comorbidity in longitudinal studies: development and validation. J Chronic Dis. 1987; 40(5):373–83. 18 Needham DM, Scales DC, Laupacis A, Pronovost PJ. A systematic review of the Charlson Comorbidity Index using Canadian administrative data- bases: a perspective on risk adjust- ment in critical care research. J Crit Care. 2005;20(1):12–9. 19 Lieffers JR, Baracos VE, Winget M, Fassbender K. A comparison of Charlson and Elixhauser comorbid- ity measures to predict colorectal cancer survival using administrative health data. Cancer. 2011;117(9): Behavioral Health Care 2060 Health Affairs December 2017 36:12 Downloaded from HealthAffairs.org on December 06, 2017. Copyright Project HOPE—The People-to-People Health Foundation, Inc. For personal use only. All rights reserved. Reuse permissions at HealthAffairs.org.
- 8. 1957–65. 20 Menendez ME, Neuhaus V, van Dijk CN, Ring D. The Elixhauser comor- bidity method outperforms the Charlson index in predicting inpa- tient death after orthopaedic sur- gery. Clin Orthop Relat Res. 2014; 472(9):2878–86. 21 Southern DA, Quan H, Ghali WA. Comparison of the Elixhauser and Charlson/Deyo methods of comor- bidity measurement in administra- tive data. Med Care. 2004;42(4): 355–60. 22 Centers for Disease Control and Prevention [Internet]. Atlanta (GA): CDC; 2015. Press release, Drug overdose deaths hit record numbers in 2014; 2015 Dec 18 [cited 2017 Oct 23]. Available from: https://www .cdc.gov/media/releases/2015/ p1218-drug-overdose.html 23 Beauchamp GA,Winstanley EL, Ryan SA, Lyons MS. Moving beyond mis- use and diversion: the urgent need to consider the role of iatrogenic ad- diction in the current opioid epi- demic. Am J Public Health. 2014; 104(11):2023–9. 24 Compton WM, Jones CM, Baldwin GT. Relationship between nonmedi- cal prescription-opioid use and her- oin use. N Engl J Med. 2016;374(2): 154–63. 25 Okie S. A flood of opioids, a rising tide of deaths. N Engl J Med. 2010; 363(21):1981–5. 26 Finkler SA. The distinction between cost and charges. Ann Intern Med. 1982;96(1):102–9. 27 Ronan MV, Herzig SJ. Hospitaliza- tions related to opioid abuse/ dependence and associated serious infections increased sharply, 2002– 12. Health Aff (Millwood). 2016; 35(5):832–7. 28 Boards of Trustees. 2014 annual re- port of the Boards of Trustees of the Federal Hospital Insurance and Federal Supplementary Medical In- surance Trust Funds [Internet]. Washington (DC): The Trustees; 2014 Jul 28 [cited 2017 Oct 23]. Available from: https://www.cms .gov/Research-Statistics-Data-and- Systems/Statistics-Trends-and- Reports/ReportsTrustFunds/ downloads/tr2014.pdf 29 Morden NE, Munson JC, Colla CH, Skinner JS, Bynum JP, Zhou W, et al. Prescription opioid use among dis- abled Medicare beneficiaries: inten- sity, trends, and regional variation. Med Care. 2014;52(9):852–9. 30 Cicero TJ, Ellis MS, Harney J. Shifting patterns of prescription opioid and heroin abuse in the United States. N Engl J Med. 2015; 373(18):1789–90. 31 Cicero TJ, Ellis MS, Surratt HL, Kurtz SP. The changing face of her- oin use in the United States: a ret- rospective analysis of the past 50 years. JAMA Psychiatry. 2014;71(7): 821–6. 32 Case A, Deaton A. Rising morbidity and mortality in midlife among white non-Hispanic Americans in the 21st century. Proc Natl Acad Sci U S A. 2015;112(49):15078–83. 33 Chen LH, Hedegaard H, Warner M. Drug-poisoning deaths involving opioid analgesics: United States, 1999–2011. NCHS Data Brief. 2014; (166):1–8. 34 Dart RC, Surratt HL, Cicero TJ, Parrino MW, Severtson SG, Bucher- Bartelson B, et al. Trends in opioid analgesic abuse and mortality in the United States. N Engl J Med. 2015; 372(3):241–8. 35 Jones CM, Logan J, Gladden RM, Bohm MK. Vital signs: demographic and substance use trends among heroin users—United States, 2002– 2013. MMWR Morb Mortal Wkly Rep. 2015;64(26):719–25. 36 Gladden RM, Martinez P, Seth P. Fentanyl law enforcement submis- sions and increases in synthetic opioid-involved overdose deaths—27 states, 2013–2014. MMWR Morb Mortal Wkly Rep. 2016;65(33): 837–43. 37 Peterson AB, Gladden RM, Delcher C, Spies E, Garcia-Williams A, Wang Y, et al. Increases in fentanyl-related overdose deaths—Florida and Ohio, 2013–2015. MMWR Morb Mortal Wkly Rep. 2016;65(33):844–9. 38 Alpert A, Powell D, Pacula RL. Supply-side drug policy in the pres- ence of substitutes: evidence from the introduction of abuse-deterrent opioids [Internet]. Cambridge (MA): National Bureau of Economic Re- search; 2017 Jan [cited 2017 Oct 23]. (NBER Working Paper No. 23031). Available for download (fee re- quired) from: http://www.nber.org/ papers/w23031 39 Cicero TJ, Ellis MS. Abuse-deterrent formulations and the prescription opioid abuse epidemic in the United States: lessons learned from oxy- contin. JAMA Psychiatry. 2015; 72(5):424–30. 40 Office of National Drug Control Policy. 2015 National Drug Control Strategy [Internet]. Washington (DC): The White House; 2015 [cited 2017 Oct 30]. Available from: https://obamawhitehouse.archives .gov/sites/default/files/ondcp/ policy-and-research/2015_ national_drug_control_strategy_0 .pdf 41 Department of Health and Human Services, Office of Disease Preven- tion and Health Promotion. National action plan for adverse drug event prevention [Internet]. Washington (DC): HHS; 2014 [cited 2017 Oct 24]. Available from: https://health .gov/hcq/pdfs/ade-action-plan- 508c.pdf 42 Department of Health and Human Services [Internet]. Washington (DC): HHS; 2016. Press release, HHS awards $94 million to health centers to help treat the prescription opioid abuse and heroin epidemic in America; 2016 Mar 17 [cited 2017 Oct 24]. Available from: https:// www.hhs.gov/hepatitis/blog/2016/ 03/17/hhs-awards-94-million-to- health-centers-to-help-treat-the- prescription-opioid-abuse-and- heroin-epidemic-in-america.html 43 White House, Office of the Press Secretary [Internet]. Washington (DC): White House; 2016. Press re- lease, Fact sheet: President Obama proposes $1.1 billion in new funding to address the prescription opioid abuse and heroin use epidemic; 2016 Feb 2 [cited 2017 Oct 24]. Available from: https://www.whitehouse.gov/ the-press-office/2016/02/02/ president-obama-proposes-11- billion-new-funding-address- prescription 44 Meara E, Horwitz JR, Powell W, McClelland L, Zhou W, O’Malley AJ, et al. State legal restrictions and prescription-opioid use among dis- abled adults. N Engl J Med. 2016; 375(1):44–53. December 2017 36:12 Health Affairs 2061 Downloaded from HealthAffairs.org on December 06, 2017. Copyright Project HOPE—The People-to-People Health Foundation, Inc. For personal use only. All rights reserved. Reuse permissions at HealthAffairs.org.