Download to read offline
![Prescription Opioid Use Among
Disabled Medicare Beneficiaries
Intensity, Trends, and Regional Variation
Nancy E. Morden, MD, MPH,* Jeffrey C. Munson, MD, MSCE,*
Carrie H. Colla, PhD,* Jonathan S. Skinner, PhD,* Julie P.W. Bynum, MD, MPH,*
Weiping Zhou, PhD,* and Ellen Meara, PhD*w
Background: Prescription opioid use and overdose deaths are in-
creasing in the United States. Among disabled Medicare benefi-
ciaries under the age of 65, the rise in musculoskeletal conditions as
qualifying diagnoses suggests that opioid analgesic use may be
common and increasing, raising safety concerns.
Methods: From a 40% random-sample Medicare denominator, we
identified fee-for-service beneficiaries under the age of 65 and
created annual enrollment cohorts from 2007 to 2011 (6.4 million
person-years). We obtained adjusted, annual opioid use measures:
any use, chronic use (Z6 prescriptions), intensity of use [daily
morphine equivalent dose (MED)], and opioid prescribers per user.
Geographic variation was studied across Hospital Referral Regions.
Results: Most measures peaked in 2010. The adjusted proportion
with any opioid use was 43.9% in 2007, 44.7% in 2010, and 43.7%
in 2011. The proportion with chronic use rose from 21.4% in 2007
to 23.1% in 2011. Among chronic users: mean MED peaked at
81.3 mg in 2010, declining to 77.4 mg in 2011; in 2011, 19.8%
received Z100 mg MED; 10.4% received Z200 mg. In 2011,
Hospital Referral Region–level measures varied broadly (5th–95th
percentile): any use: 33.0%–58.6%, chronic use: 13.9%–36.6%;
among chronic users, mean MED: 45 mg–125 mg; mean annual
opioid prescribers: 2.4–3.7.
Conclusions: Among these beneficiaries, opioid use was common.
Although intensity stabilized, the population using opioids chroni-
cally grew. Variation shows a lack of a standardized approach and
reveals regions with mean MED at levels associated with overdose
risk. Future work should assess outcomes, chronic use predictors,
and policies balancing pain control and safety.
Key Words: opioid analgesics, Medicare, regional variation, dis-
abled
(Med Care 2014;52: 852–859)
BACKGROUND
As prescription opioid consumption rises in the United
States, use by the disabled population under the age of 65
warrants careful examination.1 Growing numbers of Amer-
icans are applying for and receiving Social Security Dis-
ability Insurance (SSDI).2,3 This SSDI program expansion
includes a rapid rise in eligibility due to musculoskeletal
conditions, often treated with prescription analgesics. In
2011, musculoskeletal conditions such as back pain were the
most common SSDI-qualifying diagnoses, accounting for
33.8% of program participants (up from 20% in 1996).2 This
shift in the composition of disabling conditions, combined
with national trends of increasing prescription opioid use and
prescription opioid overdose deaths, suggests the potential
for substantial opioid use in the SSDI population and raises
concern for the overall health and safety of these injured and
ill workers.
Although the best approach to pain management and
opioid analgesic prescribing, in particular, are debated, in-
tense chronic opioid analgesics use for nonmalignant pain is
increasingly recognized as ineffective and potentially haz-
ardous to individuals and to the public.1,4–7 In state-level and
From the *Department of Community and Family Medicine, The Dartmouth
Institute for Health Policy & Clinical Practice; and wNational Bureau of
Economic Research, Cambridge Massachusetts, Lebanon, NH.
Funding and support was received from NIH/NIA P01 AG019783 to J.S.S.,
J.P.W.B., and W.Z.; NIH/NIA U01 AG046830 to J.S.S., J.P.W.B.,
C.H.C., E.M., J.C.M., and W.Z.; NIH/NIA K23 AG035030 - 01A1 to
N.E.M.; Robert Wood Johnson Foundation Dartmouth Atlas Project
059491 to N.E.M.; SYNERGY at Dartmouth and Dartmouth Hitchcock
Medical Center to N.E.M., J.C.M., and C.H.C.
Funders had no role in the design and conduct of the study; collection,
management, analysis, or interpretation of the data; preparation, review,
or approval of the manuscript; or decision to submit the manuscript for
publication.
All authors are affiliated with the Dartmouth Institute for Health Policy &
Clinical Practice, Lebanon, NH. N.E.M. and J.C.M. are also affiliated
with The Geisel School of Medicine at Dartmouth, Hanover, NH. N.M.
and C.H.C. are associated with the Norris Cotton Cancer Center at
Dartmouth Hitchcock Medical Center. E.M., C.H.C., and J.S.S. are also
affiliated with the Department of Economics, Dartmouth College, Han-
over, NH.
Reprints: Nancy E. Morden, MD, MPH, Department of Community and
Family Medicine, The Dartmouth Institute for Health Policy & Clinical
Practice, 35 Centerra Parkway Room 3088, Lebanon, NH 03766. E-mail:
Nancy.e.morden@dartmouth.edu.
Supplemental Digital Content is available for this article. Direct URL cita-
tions appear in the printed text and are provided in the HTML and PDF
versions of this article on the journal’s Website, www.lww-medical
care.com.
Copyright r 2014 by Lippincott Williams & Wilkins
ISSN: 0025-7079/14/5209-0852
ORIGINAL ARTICLE
852 | www.lww-medicalcare.com Medical Care Volume 52, Number 9, September 2014](https://image.slidesharecdn.com/prescriptionopioiduseamongdisabledmedicare-161209134827/85/SSDI-Opioid-Use-1-320.jpg)
![national-level analyses, higher use of prescription opioids
has been linked to higher drug overdose death rates among
patients and, because of drug diversion, nonpatients as
well.5,6,8–10 Despite these warnings, the use of prescription
opioids in the United States continues to climb.11–13 The
SSDI population may be at high risk for chronic, intense, and
potentially hazardous prescription opioid use, but the an-
algesic consumption of this large and growing national
population of patients supported by federal disability in-
surance has not been studied.
We examined the opioid prescription fill patterns of
Medicare beneficiaries under 65 years of age. Disabled
workers become eligible for Medicare benefits, regardless of
age, 2 years after qualifying for SSDI, and SSDI recipients
make up nearly all Medicare beneficiaries under the age of
65 years.3 Our aim was to quantify their use of prescription
opioids over time and across geographic areas.
METHODS
Study Population
Using a 40% Medicare random sample denominator
for each of 5 calendar years, 2007–2011, we identified pa-
tients under the age of 65, continuously enrolled in fee-for-
service Medicare Parts A, B, and D (inpatient, outpatient,
and prescription benefits). We analyzed opioid use sepa-
rately for each calendar year from 2007 to 2011 using all
beneficiaries in our 40% sample. Beneficiaries were only
included in a calendar year if they were continuously en-
rolled for the entire 12 months. We obtained individual-level
covariates using the Medicare Beneficiary Summary File
(denominator file), MedPAR, Carrier, Outpatient, and Hos-
pice files.14 To eliminate study of opioids used for cancer-
related pain or end-of-life pain management, we excluded
patients with any hospice use or any ICD-9 diagnosis code
for cancer (except nonmelanoma skin cancer) occurring at
any time in the enrollment year. To focus our cohort on
disabled workers, we also excluded patients qualifying for
Medicare due to end-stage renal disease.
Main Measures
We determined individual-level counts of opioid an-
algesic fill events from the Medicare Part D Prescription
Drug Event file. We calculated individual annual pills [or
volume of elixir products ( 1% of fills)] received. To ach-
ieve opioid use measures comparable across products, in-
dividual daily morphine equivalent dose (MED) was
calculated by dividing total annual morphine equivalents
received by 365 (Appendix Table 1, Supplemental Digital
Content 1, http://links.lww.com/MLR/A786).15,16 Annual-
ized, 1 additional daily morphine equivalent approximately
equals an additional 5 mg of oxycodone each week. Among
chronic opioid users (6 or more fills), we used encrypted
unique prescriber identification to calculate the number of
unique opioid prescribers. We calculated population mea-
sures of opioid analgesic use including: proportion of the
population with any use (1 or more fill), proportion of the
population with chronic use, total number of opioid pills, and
morphine equivalents per user; among chronic users we
calculated number of unique opioid prescribers. Because of
high-profile abuse of oxycodone, we measured proportion of
all units dispensed as oxycodone products.9,17
Covariates
For each beneficiary in each study year we obtained
demographic characteristics from the Medicare Beneficiary
Summary File, including age, sex, race/ethnicity (catego-
rized as black, Hispanic, white, or other), and Part D
low-income subsidy (LIS) status (a poverty indicator). Year-
specific inpatient and outpatient claims were used to obtain
Charlson comorbidities, as well as diagnoses important in
this population: musculoskeletal disorders (using Social Se-
curity Administration range of diagnosis codes), depression
and serious mental illness (bipolar disorder, schizophrenia,
schizoaffective disorder, and other nonorganic psy-
choses).18–20 Appendix Table 2 (Supplemental Digital Con-
tent 2, http://links.lww.com/MLR/A787) lists diagnostic
codes. We determined individual Prescription Hierarchical
Clinical Condition (Rx-HCC) scores.21 Rx-HCC is the sys-
tem used to risk adjust Part D plan payments for health
status, and we constructed them using index year data.22 ZIP
code was used to assign each patient to a state and one of 306
Dartmouth Atlas of Healthcare Hospital Referral Regions
(HRRs).23
Analysis
We used descriptive statistics to quantify opioid an-
algesic fills and pills as well as morphine equivalents. To
compare national mean population use measures across
years, we estimated linear regression models that included
age, sex, LIS status, race/ethnicity, comorbidities, an in-
dicator variable for musculoskeletal disease, and year in-
dicators, using 2007 as our reference. Comorbidity counts
were used for year-to-year comparisons, rather than Rx-HCC
because Rx-HCC is recalibrated periodically and thus not
valid for longitudinal comparison. We used quantile re-
gression to obtain adjusted median values for opioid mea-
sures. To obtain 2011 adjusted HRR measures, the same
analytic approach was used but Rx-HCC was used in place of
comorbidity count. We prefer the Rx-HCC to morbidity
counts for within-year comparisons because it includes a
large number of diagnoses hierarchically and was designed
specifically to predict prescription spending, a correlate of
prescription use.21,22 As musculoskeletal diseases are in-
cluded broadly in the Rx-HCC, our indicator for these disease
was not included in calculation of these 2011 HRR-level
measures. In sensitivity analyses, we repeated measures
across years, without the indicator variable for musculo-
skeletal disease.
RESULTS
Primary Analyses
The study from 2007 to 2011 included 6.4 million
person-years; annual cohorts ranged from 1.21 million
(2007) to 1.37 million (2011) people, with substantial year-
to-year cohort overlap; on average each unique individual
was present in 3.3 of the 5 years studied, creating an 83% to
Medical Care Volume 52, Number 9, September 2014 Prescription Opioid Use Medicare Disabled
r 2014 Lippincott Williams Wilkins www.lww-medicalcare.com | 853](https://image.slidesharecdn.com/prescriptionopioiduseamongdisabledmedicare-161209134827/85/SSDI-Opioid-Use-2-320.jpg)
![84% cohort overlap between consecutive years. Demo-
graphic, economic status, health status, and eligibility cat-
egory did not change appreciably from year to year. In 2011,
mean age was 49.2; 49.9% were female; 20.2% were Black,
and 8.6% were Hispanic; 87.5% received Part D LIS, and
74.0% were eligible for Medicaid; 100% were eligible for
Medicare due to Disability Insurance. Mean Charlson co-
morbidity count was 1.64 (SD 1.85), mean Rx-HCC score was
1.10 (SD 0.61); overall, 65.5% had musculoskeletal disease,
7.1% had serious mental illness diagnoses; 25.2% had depres-
sion diagnosis. Demographics, comorbidity counts, and Rx-
HCC scores varied substantially across groups defined by opioid
use. Compared with nonusers, users with 6 fills had higher
proportions of females, more morbidities, more musculoskeletal
disease, and more depression. These differences were more
pronounced in the comparison of nonusers with chronic users,
particularly in the proportion with musculoskeletal disease.
Chronic users were more likely to be white compared with
nonusers and users with 6 fills. (Table 1) (Appendix Table 3,
Supplemental Digital Content 3, http://links.lww.com/MLR/
A788 shows characteristics by year).
Nearly all opioid use measures peaked in 2010, with
modest declines in 2011 (Table 2). The proportion of the
population with any opioid use was 43.9% in 2007, 44.7% in
2010, and 43.7% in 2011; chronic use rose from 21.4% in
2007 to 23.1% in 2011. Overall, median MED increased from
9.8 mg in 2007 to 11.0 mg in 2010 and the returned to 9.9mg
in 2011. Among patients with chronic use: median MED rose
from 32.9 mg in 2007 to 36.2 mg in 2010, mean from 77.1 to
81.3 mg; from 2010 to 2011, both measures decreased to near
2007 levels. Proportion of chronic users with MEDZ100 mg
and MEDZ200 mg was stable over this period at, essentially,
20% and 10%, respectively. Two measures continued to grow
through 2011: median annual pill count increased 30.7%,
from 239 in 2007 to 312 in 2011, suggesting, with relatively
stable MED, that higher numbers of lower-dose pills were
being dispensed. Oxycodone, the second most commonly
prescribed opioid (after hydrocodone), rose from 18.8% of all
pills dispensed in 2007 to 24.4% in 2011.
Sensitivity analyses repeating all adjusted annual
measures without the musculoskeletal disease indicator
variable revealed nearly identical values.
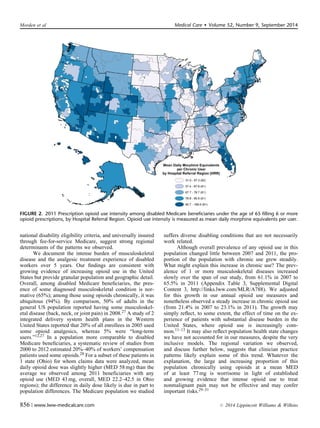
Adjusted prescription opioid use varied substantially
across the 306 HRRs in 2011 (Figs. 1 and 2 and Appendix
Table 4, Supplemental Digital Content 4, http://link-
s.lww.com/MLR/A789). The proportion of these beneficiaries
per HRR with any opioid fill ranged from 24.9% to 63.0%
(5th–95th percentile, 33.0%–58.6%); the proportion with
chronic use ranged from 9.6% to 42.4% (5th–95th percentile,
13.9%–36.6%). Among chronic users: MED varied broadly,
median from 19.1 to 84.6 mg (5th–95th percentile,
22.8–52.8), mean from 31.0 to 168.0 mg (5th–95th percentile,
44.5–124.5), whereas median number of opioid fills per
chronic user varied little, 10.6–15.6 (5th–95th percentile,
12.5–13.9); mean number of opioid prescribers ranged from
2.1 to 4.2. (5th–95th percentile, 2.4–3.7). Overall, the pro-
portion of pills dispensed as oxycodone ranged from 1.7% to
60.5% (5th–95th percentile, 4.0%–48.6%).
State-level patterns also emerged. When HRRs were
ranked on adjusted 2011 mean MED per chronic user, Florida
HRRs made up 8 of the top-10; all had values 135mg. When
ranked on proportion of the population with 6 or more fills, 4 of
the top-10 HRRs were in Tennessee. When HRRs were ranked
by oxycodone use, Newark, NJ was at the top (60.5%); 8 of the
TABLE 1. Medicare Beneficiaries Under the Age of 65, 2007–2011: Demographics and Select Characteristics Overall and by
Opioid Use Category
Opioid Users (%)
Overall (N) Opioid Nonusers (%) 6 Fills Z6 Fills
Person-years 2007–2011 6,375,633 54.3 22.2 23.5
2007 1,213,680 56.1 22.6 21.4
2008 1,231,506 54.9 22.5 22.7
2009 1,254,370 53.8 22.4 23.8
2010 1,308,389 53.3 22.1 24.6
2011 1,367,688 53.8 21.3 24.9
2011 population characteristics
Age [mean (SD)] 49.2 (10.6) 48.4 (11.1) 49 (10.7) 51 (8.9)
Female % 49.9 44.1 56.1 56.2
White % 67.7 64.7 64.7 74.7
Black % 20.2 21.4 22.5 16.9
Hispanic % 8.6 9.8 9.5 5.9
Low-income subsidy (% with any) 87.5 87.8 87.3 87.2
Medicare Medicaid dually eligible (%) 74 74.1 74.3 74.5
Rx-HCC [mean (SD)] 1.10 (0.61) 1.03 (0.58) 1.14 (0.62) 1.22 (0.62)
Charlson comorbidity count [mean (SD)] 1.64 (1.85) 1.2 (1.53) 1.93 (1.91) 2.36 (2.13)
Musculoskeletal Disease (%) 65.5 47 78.4 94.4
Serious mental illness diagnosis (%) 7.1 7.3 7.3 6.5
Depression diagnosis (%) 25.2 18 29.2 37.5
Rx-HCC indicates Rx Hierarchical Clinical Condition scores based on index year diagnoses on inpatient and outpatient claims. Charlson comorbidities from 1987 Journal of
Chronic Disease. Low-income subsidy is Medicare Part D low-income subsidy, an indicator or income r150% of poverty. Serious mental illness is bipolar disorder, schizophrenia,
schizoaffective disorder, and other nonorganic psychoses. All diagnoses occur in the year of study for each annual cohort. The annual cohorts include only patients enrolled in fee-
for-service Medicare Parts A, B, and D for the full calendar year. Note that the unadjusted percent using opiates and percent with six or more fills shown above differ from the
adjusted percent presented in Table 2.
Morden et al Medical Care Volume 52, Number 9, September 2014
854 | www.lww-medicalcare.com r 2014 Lippincott Williams Wilkins](https://image.slidesharecdn.com/prescriptionopioiduseamongdisabledmedicare-161209134827/85/SSDI-Opioid-Use-3-320.jpg)


This study examined prescription opioid use among disabled Medicare beneficiaries under age 65 from 2007 to 2011. The key findings were: 1. The proportion of beneficiaries using opioids chronically increased from 21.4% in 2007 to 23.1% in 2011, although other measures of intensity like daily morphine equivalent dose peaked in 2010 and declined slightly in 2011. 2. There was wide regional variation in opioid use measures across the US, for example the proportion of beneficiaries using opioids chronically ranged from 13.9% to 36.6% across regions in 2011. 3. Among chronic opioid users, the mean number of opioid prescribers per user was between 2.4-3.7 depending on the region,


