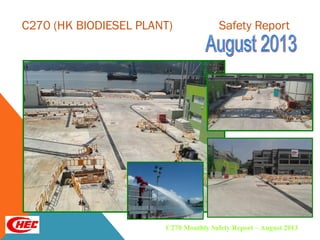
2. Safety :
Contribution from All
Level ( Top to Shop )
SAFETY STATISTICS
Jul 2013 Aug 2013
Accumulated Man-hour 772,884 812,094
Days worked from Commencement 630 661
Accumulated Man-day Lost 1446 1539
Cumulative Accident Frequency Rate 0.78 0.74
4. SAFETY INSPECTION / MEETING
Weekly Safety Meetings with Safety Representatives of Subcontractors
5. AREA NEED IMPROVEMENT
HOUSEKEEPING
– Site not kept tidy and clean
PROMPT RECTIFICATION
Improvement
– Construction waste cleared / site kept
tidy and clean
6. AREA NEED IMPROVEMENT
PROMPT RECTIFICATION
Improvement
– Floor hole repaired
HOUSEKEEPING
– Floor opening prone to tripping
7. AREA NEED IMPROVEMENT
PROMPT RECTIFICATION
Improvement
– Construction waste collection bin
cleared to accept newly cleared
waste
WASTE MANAGEMENT
– Construction waste collection bin
not cleared in time
8. SAFETY TRAINING
Site Specific Safety
Induction
Current Month
Accumulate
(Oct 2011 – Jul 2013)
No. of class 10 458
No. of Attendee 25 1908
INDUCTION
TRAINING
9. TOOL BOX TALK
TRAININGSAFETY TRAINING
Topic No. of attendee
Health Prevention of Heat Stroke 67
Safety Safe Use of Ladder 67
Safety Site Housekeeping 67
Health & Safety Safe Use of PPE 67
Current Month Total 268 nos.
Accumulated Total :6,992 nos.
10. SAFETY Promotion
8 nos. Very Hot Weather Warning
5 nos. Thunderstorm Warning
2 nos. Tropical Cyclone Warning
Safety News Sharing
13 nos. EC claim communications (HRD/subcontractors)
8 nos. Safety & Health Interface – other main contractors
9 nos. Safety & Health Advice to CHEC subcontractors
4 nos. Safety & Health Advice - internal
7 nos. Communication with CHEC Safety
Safety Circulation