Monthly banking sector update
•
0 likes•635 views

- The loan book decreased 2.0% month-over-month in October 2014, driven primarily by a 5.7% decline in public sector loans. Deposits also declined slightly by 0.3% month-over-month. - Public sector deposits decreased 3.3% month-over-month in October 2014, with the government segment declining 15.4%. Private sector deposits increased 1.0% month-over-month. - All three public sector loan segments declined in October 2014, pulling the overall loan book down 2.0% month-over-month. Private sector loans gained 0.3% month-over-month, with consumption and real estate increasing.

Recommended
Recommended
More Related Content
What's hot
What's hot (20)
Viewers also liked
Viewers also liked (20)
Similar to Monthly banking sector update
Similar to Monthly banking sector update (20)
More from QNB Group
More from QNB Group (20)
Recently uploaded
Recently uploaded (20)
Monthly banking sector update
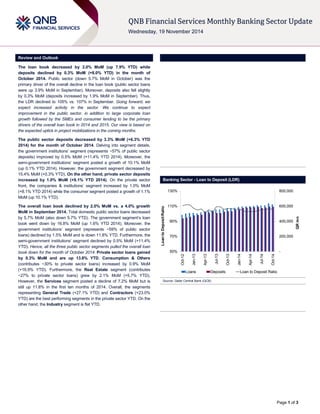
- 1. Page 1 of 3 Review and Outlook The loan book decreased by 2.0% MoM (up 7.9% YTD) while deposits declined by 0.3% MoM (+8.0% YTD) in the month of October 2014. Public sector (down 5.7% MoM in October) was the primary driver of the overall decline in the loan book (public sector loans were up 3.9% MoM in September). Moreover, deposits also fell slightly by 0.3% MoM (deposits increased by 1.9% MoM in September). Thus, the LDR declined to 105% vs. 107% in September. Going forward, we expect increased activity in the sector. We continue to expect improvement in the public sector, in addition to large corporate loan growth followed by the SMEs and consumer lending to be the primary drivers of the overall loan book in 2014 and 2015. Our view is based on the expected uptick in project mobilizations in the coming months. The public sector deposits decreased by 3.3% MoM (+6.3% YTD 2014) for the month of October 2014. Delving into segment details, the government institutions’ segment (represents ~57% of public sector deposits) improved by 0.5% MoM (+11.4% YTD 2014). Moreover, the semi-government institutions’ segment posted a growth of 10.1% MoM (up 0.1% YTD 2014). However, the government segment decreased by 15.4% MoM (+0.3% YTD). On the other hand, private sector deposits increased by 1.0% MoM (+9.1% YTD 2014). On the private sector front, the companies & institutions’ segment increased by 1.0% MoM (+8.1% YTD 2014) while the consumer segment posted a growth of 1.1% MoM (up 10.1% YTD). The overall loan book declined by 2.0% MoM vs. a 4.0% growth MoM in September 2014. Total domestic public sector loans decreased by 5.7% MoM (also down 5.7% YTD). The government segment’s loan book went down by 16.8% MoM (up 1.6% YTD 2014). Moreover, the government institutions’ segment (represents ~59% of public sector loans) declined by 1.5% MoM and is down 11.8% YTD. Furthermore, the semi-government institutions’ segment declined by 0.5% MoM (+11.4% YTD). Hence, all the three public sector segments pulled the overall loan book down for the month of October 2014. Private sector loans gained by 0.3% MoM and are up 13.8% YTD. Consumption & Others (contributes ~30% to private sector loans) increased by 0.9% MoM (+16.9% YTD). Furthermore, the Real Estate segment (contributes ~27% to private sector loans) grew by 2.1% MoM (+5.7% YTD). However, the Services segment posted a decline of 7.2% MoM but is still up 11.8% in the first ten months of 2014. Overall, the segments representing General Trade (+27.1% YTD) and Contractors (+23.0% YTD) are the best performing segments in the private sector YTD. On the other hand, the Industry segment is flat YTD. Banking Sector - Loan to Deposit (LDR) Source: Qatar Central Bank (QCB) - 200,000 400,000 600,000 800,00050% 70% 90% 110% 130% Oct-12Jan-13Apr-13Jul-13Oct-13Jan-14Apr-14Jul-14Oct-14QR mnLoan to Deposit Ratio LoansDepositsLoan to Deposit Ratio
- 2. Page 2 of 3 Facilities Total Loans T otal Deposits Source: QCB Source: QCB -3.0% 0.0% 3.0% 6.0% 9.0% - 200,000 400,000 600,000 800,000 Oct-12 Jan-13 Apr-13 Jul-13 Oct-13 Jan-14 Apr-14 Jul-14 Oct-14 Change MoM QR mn Public Sector Private Sector Outside Qatar Total Loan Growth MoM -20% -10% 0% 10% 20% - 100,000 200,000 300,000 400,000 500,000 600,000 Oct-12 Jan-13 Apr-13 Jul-13 Oct-13 Jan-14 Apr-14 Jul-14 Oct-14 Change MoM QR mn Public Sector Private Sector Non Resident Total Deposit Growth MoM
- 3. Disclaimer and Copyright Notice: This publication has been prepared by QNB Financial Services SPC (“QNBFS”) a wholly-owned subsidiary of QNB SAQ (“QNB”). QNBFS is regulated by the Qatar Financial Markets Authority and the Qatar Exchange QNB SAQ is regulated by the Qatar Central Bank. This publication expresses the views and opinions of QNBFS at a given time only. It is not an offer, promotion or recommendation to buy or sell securities or other investments, nor is it intended to constitute legal, tax, accounting, or financial advice. QNBFS accepts no liability whatsoever for any direct or indirect losses arising from use of this report. Any investment decision should depend on the individual circumstances of the investor and be based on specifically engaged investment advice. We therefore strongly advise potential investors to seek independent professional advice before making any investment decision. Although the information in this report has been obtained from sources that QNBFS believes to be reliable, we have not independently verified such information and it may not be accurate or complete. QNBFS does not make any representations or warranties as to the accuracy and completeness of the information it may contain, and declines any liability in that respect. For reports dealing with Technical Analysis, expressed opinions and/or recommendations may be different or contrary to the opinions/recommendations of QNBFS Fundamental Research as a result of depending solely on the historical technical data (price and volume). QNBFS reserves the right to amend the views and opinions expressed in this publication at any time. It may also express viewpoints or make investment decisions that differ significantly from, or even contradict, the views and opinions included in this report. This report may not be reproduced in whole or in part without permission from QNBFS COPYRIGHT: No part of this document may be reproduced without the explicit written permission of QNBFS. Page 3 of 3