Vip Call US 📞 7738631006 ✅Call Girls In Sakinaka ( Mumbai )
QNBFS monthly banking sector update
1. Page 1 of 2
Review and Outlook
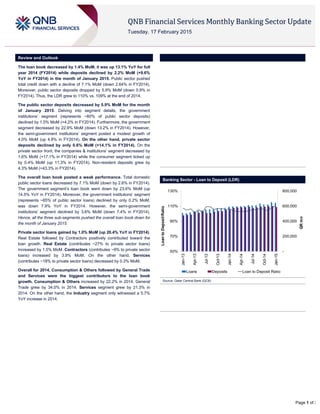
The loan book decreased by 1.4% MoM, it was up 13.1% YoY for full
year 2014 (FY2014) while deposits declined by 2.2% MoM (+9.6%
YoY in FY2014) in the month of January 2015. Public sector pushed
total credit down with a decline of 7.1% MoM (down 2.64% in FY2014).
Moreover, public sector deposits dropped by 5.9% MoM (down 0.9% in
FY2014). Thus, the LDR grew to 110% vs. 109% at the end of 2014.
The public sector deposits decreased by 5.9% MoM for the month
of January 2015. Delving into segment details, the government
institutions’ segment (represents ~60% of public sector deposits)
declined by 1.0% MoM (+4.2% in FY2014). Furthermore, the government
segment decreased by 22.9% MoM (down 13.2% in FY2014). However,
the semi-government institutions’ segment posted a modest growth of
4.0% MoM (up 4.8% in FY2014). On the other hand, private sector
deposits declined by only 0.6% MoM (+14.1% in FY2014). On the
private sector front, the companies & institutions’ segment decreased by
1.6% MoM (+17.1% in FY2014) while the consumer segment ticked up
by 0.4% MoM (up 11.3% in FY2014). Non-resident deposits grew by
4.3% MoM (+43.3% in FY2014).
The overall loan book posted a weak performance. Total domestic
public sector loans decreased by 7.1% MoM (down by 2.6% in FY2014).
The government segment’s loan book went down by 23.6% MoM (up
14.5% YoY in FY2014). Moreover, the government institutions’ segment
(represents ~65% of public sector loans) declined by only 0.2% MoM,
was down 7.9% YoY in FY2014. However, the semi-government
institutions’ segment declined by 3.6% MoM (down 7.4% in FY2014).
Hence, all the three sub-segments pushed the overall loan book down for
the month of January 2015.
Private sector loans gained by 1.0% MoM (up 20.4% YoY in FY2014).
Real Estate followed by Contractors positively contributed toward the
loan growth. Real Estate (contributes ~27% to private sector loans)
increased by 1.5% MoM. Contractors (contributes ~9% to private sector
loans) increased by 3.9% MoM. On the other hand, Services
(contributes ~18% to private sector loans) decreased by 0.3% MoM.
Overall for 2014, Consumption & Others followed by General Trade
and Services were the biggest contributors to the loan book
growth. Consumption & Others increased by 22.2% in 2014. General
Trade grew by 34.0% in 2014. Services segment grew by 21.3% in
2014. On the other hand, the Industry segment only witnessed a 5.7%
YoY increase in 2014.
Banking Sector - Loan to Deposit (LDR)
-
200,000
400,000
600,000
800,000
50%
70%
90%
110%
130%
Jan-13
Apr-13
Jul-13
Oct-13
Jan-14
Apr-14
Jul-14
Oct-14
Jan-15
QRmn
LoantoDepositRatio
Loans Deposits Loan to Deposit Ratio
Source: Qatar Central Bank (QCB)
2. QNB Financial Services SPC
Contact Center: (+974) 4476 6666
PO Box 24025
Doha, Qatar
Disclaimer and Copyright Notice: This publication has been prepared by QNB Financial Services SPC (“QNBFS”) a wholly-owned subsidiary of QNB SAQ (“QNB”). QNBFS is regulated by the
Qatar Financial Markets Authority and the Qatar Exchange QNB SAQ is regulated by the Qatar Central Bank. This publication expresses the views and opinions of QNBFS at a given time only.
It is not an offer, promotion or recommendation to buy or sell securities or other investments, nor is it intended to constitute legal, tax, accounting, or financial advice. QNBFS accepts no liability
whatsoever for any direct or indirect losses arising from use of this report. Any investment decision should depend on the individual circumstances of the investor and be based on specifically
engaged investment advice. We therefore strongly advise potential investors to seek independent professional advice before making any investment decision. Although the information in this
report has been obtained from sources that QNBFS believes to be reliable, we have not independently verified such information and it may not be accurate or complete. QNBFS does not make
any representations or warranties as to the accuracy and completeness of the information it may contain, and declines any liability in that respect. For reports dealing with Technical Analysis,
expressed opinions and/or recommendations may be different or contrary to the opinions/recommendations of QNBFS Fundamental Research as a result of depending solely on the historical
technical data (price and volume). QNBFS reserves the right to amend the views and opinions expressed in this publication at any time. It may also express viewpoints or make investment
decisions that differ significantly from, or even contradict, the views and opinions included in this report. This report may not be reproduced in whole or in part without permission from QNBFS
COPYRIGHT: No part of this document may be reproduced without the explicit written permission of QNBFS.
Page 2 of 2
Loans & Deposits
Total Loans Total Deposits
-3.0%
0.0%
3.0%
6.0%
9.0%
-
200,000
400,000
600,000
800,000
Jan-13
Apr-13
Jul-13
Oct-13
Jan-14
Apr-14
Jul-14
Oct-14
Jan-15
ChangeMoM
QRmn
Public Sector Private Sector Outside Qatar Total Loan Growth MoM
Source: QCB
-20%
-10%
0%
10%
20%
-
100,000
200,000
300,000
400,000
500,000
600,000
Jan-13
Apr-13
Jul-13
Oct-13
Jan-14
Apr-14
Jul-14
Oct-14
Jan-15
ChangeMoM
QRmn
Public Sector Private Sector Non Resident Total Deposit Growth MoM
Source: QCB