Downloaded 19 times


![Connection
Tracking
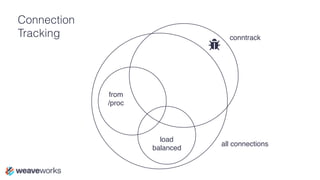
/home/weave # conntrack -E
[DESTROY] tcp 6 src=172.17.0.10 dst=10.128.0.1 sport=41066 dport=80 src=172.17.0.1 dst=172.17.0.10
[DESTROY] tcp 6 src=192.168.99.100 dst=192.168.99.100 sport=36236 dport=32778 src=172.17.0.8 dst=1
[DESTROY] tcp 6 src=172.17.0.10 dst=10.128.0.1 sport=41068 dport=80 src=172.17.0.1 dst=172.17.0.10
[DESTROY] tcp 6 src=192.168.99.100 dst=192.168.99.100 sport=52996 dport=32776 src=172.17.0.6 dst=1
[DESTROY] tcp 6 src=172.17.0.10 dst=10.128.0.1 sport=41070 dport=80 src=172.17.0.1 dst=172.17.0.10
[DESTROY] tcp 6 src=192.168.99.100 dst=192.168.99.100 sport=52998 dport=32776 src=172.17.0.6 dst=1
[DESTROY] tcp 6 src=172.17.0.10 dst=10.128.0.1 sport=41072 dport=80 src=172.17.0.1 dst=172.17.0.10
[DESTROY] tcp 6 src=192.168.99.100 dst=192.168.99.100 sport=57975 dport=32777 src=172.17.0.7 dst=1
[DESTROY] tcp 6 src=172.17.0.10 dst=10.128.0.1 sport=41074 dport=80 src=172.17.0.1 dst=172.17.0.10
/home/weave # cat /proc/net/tcp
sl local_address rem_address st tx_queue rx_queue tr tm->when retrnsmt uid timeout inode
0: 00000000:0016 00000000:0000 0A 00000000:00000000 00:00000000 00000000 0 0 16810 1 ffff
1: 0100007F:EB74 0100007F:0FC8 06 00000000:00000000 03:0000016D 00000000 0 0 0 3 ffff8800
2: 0100007F:EB69 0100007F:0FC8 01 00000000:00000000 00:00000000 00000000 0 0 307011 1 fff
3: 0100007F:EB7B 0100007F:0FC8 06 00000000:00000000 03:00000D27 00000000 0 0 0 3 ffff8800
4: 0100007F:EB7C 0100007F:0FC8 06 00000000:00000000 03:0000110E 00000000 0 0 0 3 ffff8800
5: 0100007F:EB67 0100007F:0FC8 01 00000000:00000000 00:00000000 00000000 0 0 306868 1 fff
6: 0100007F:EB76 0100007F:0FC8 06 00000000:00000000 03:00000556 00000000 0 0 0 3 ffff8800
7: 0100007F:EB7F 0100007F:0FC8 06 00000000:00000000 03:000014F7 00000000 0 0 0 3 ffff8800](https://image.slidesharecdn.com/monitoringmicroservices-160512093858/85/Monitoring-Microservices-21-320.jpg)

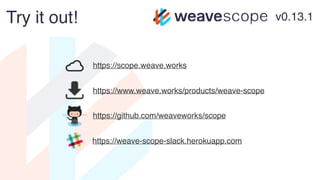

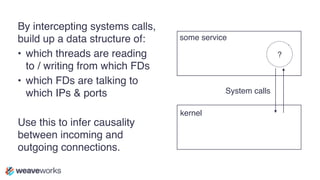


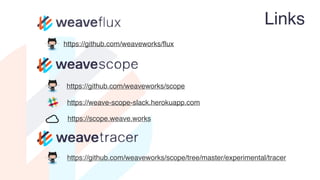


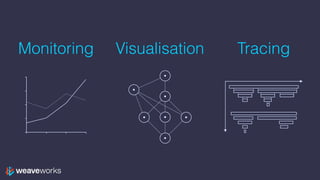
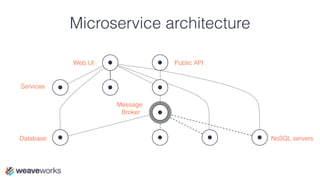
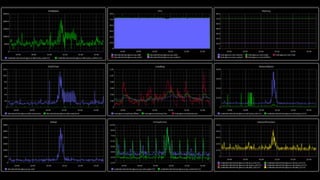
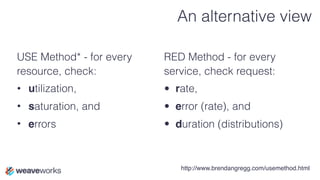
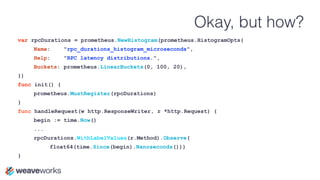
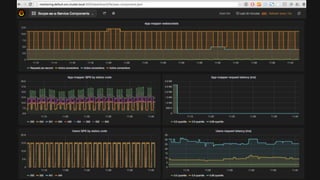
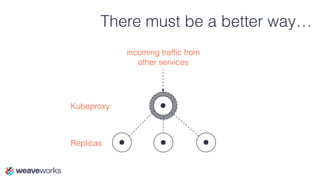
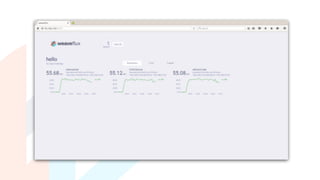
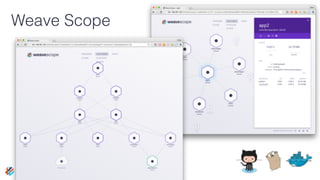
The document provides details about a workshop and conference held from May 9-11, 2016, in Stockholm, focusing on the monitoring of microservices. It discusses methodologies for assessing system performance and offers resources such as GitHub links for attendees to explore tools like Weave Scope and Flux. The presentation includes elements of visualisation and tracing within a microservice architecture, emphasizing the need for effective monitoring without application modifications.


![20260201 [FOSDEM] gomodjail - library sandboxing for Go modules.pdf](https://cdn.slidesharecdn.com/ss_thumbnails/20260201fosdemgomodjail-librarysandboxingforgomodules-260201225659-76609ec4-thumbnail.jpg?width=640&height=640&fit=bounds)


