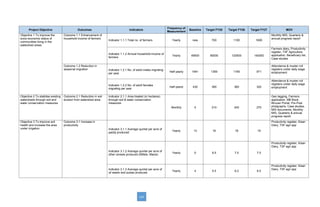
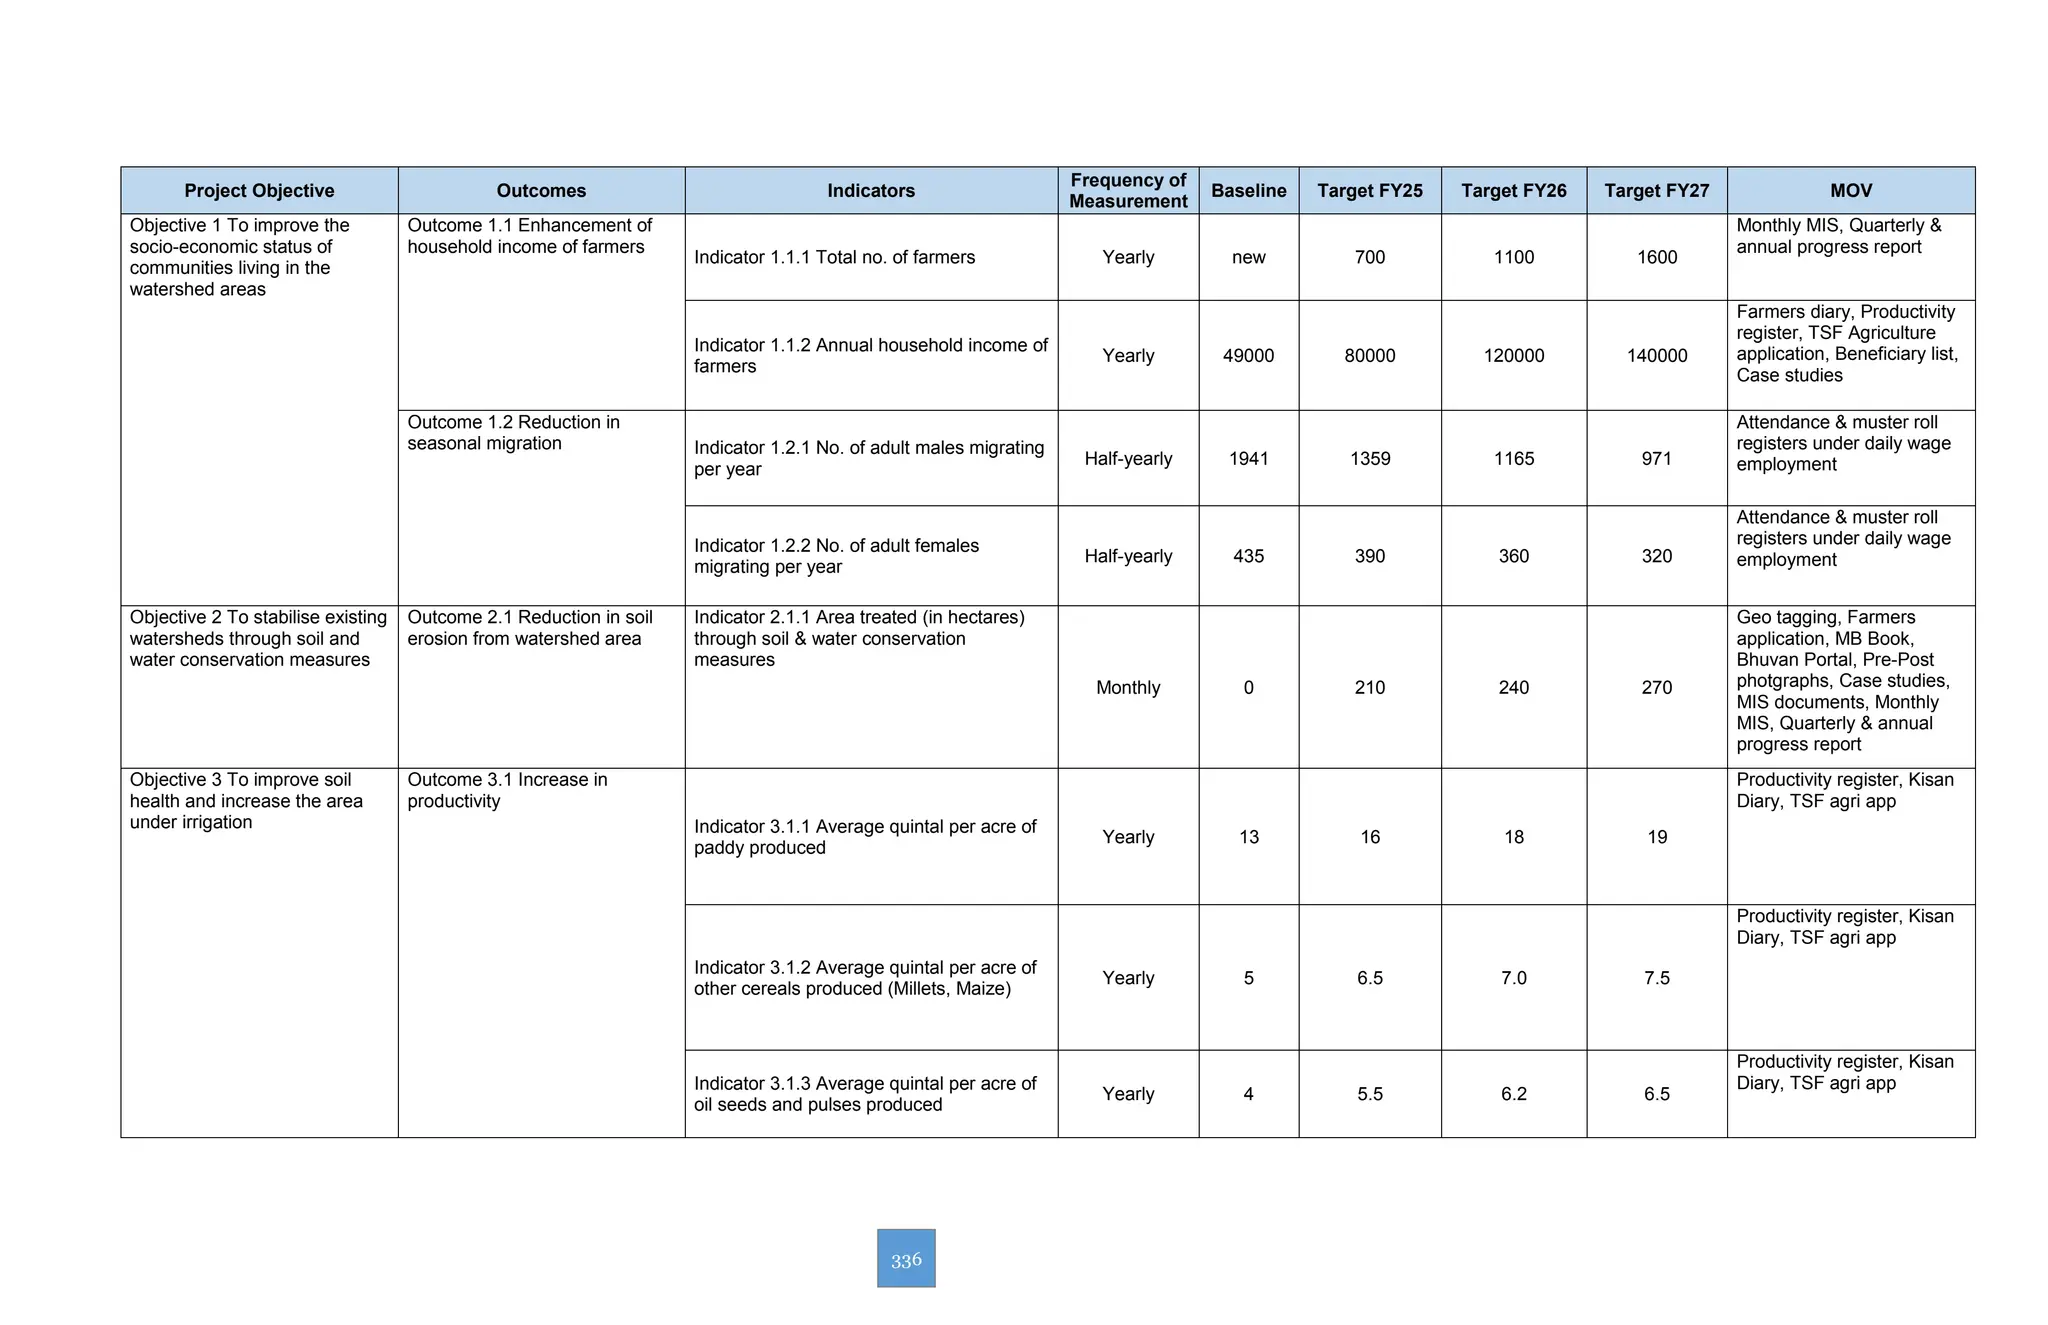
336
Project Objective Outcomes Indicators
Frequency of
Measurement
Baseline Target FY25 Target FY26 Target FY27 MOV
Objective 1 To improve the
socio-economic status of
communities living in the
watershed areas
Outcome 1.1 Enhancement of
household income of farmers
Indicator 1.1.1 Total no. of farmers Yearly new 700 1100 1600
Monthly MIS, Quarterly &
annual progress report
Indicator 1.1.2 Annual household income of
farmers
Yearly 49000 80000 120000 140000
Farmers diary, Productivity
register, TSF Agriculture
application, Beneficiary list,
Case studies
Outcome 1.2 Reduction in
seasonal migration Indicator 1.2.1 No. of adult males migrating
per year
Half-yearly 1941 1359 1165 971
Attendance & muster roll
registers under daily wage
employment
Indicator 1.2.2 No. of adult females
migrating per year
Half-yearly 435 390 360 320
Attendance & muster roll
registers under daily wage
employment
Objective 2 To stabilise existing
watersheds through soil and
water conservation measures
Outcome 2.1 Reduction in soil
erosion from watershed area
Indicator 2.1.1 Area treated (in hectares)
through soil & water conservation
measures
Monthly 0 210 240 270
Geo tagging, Farmers
application, MB Book,
Bhuvan Portal, Pre-Post
photgraphs, Case studies,
MIS documents, Monthly
MIS, Quarterly & annual
progress report
Objective 3 To improve soil
health and increase the area
under irrigation
Outcome 3.1 Increase in
productivity
Indicator 3.1.1 Average quintal per acre of
paddy produced
Yearly 13 16 18 19
Productivity register, Kisan
Diary, TSF agri app
Indicator 3.1.2 Average quintal per acre of
other cereals produced (Millets, Maize)
Yearly 5 6.5 7.0 7.5
Productivity register, Kisan
Diary, TSF agri app
Indicator 3.1.3 Average quintal per acre of
oil seeds and pulses produced
Yearly 4 5.5 6.2 6.5
Productivity register, Kisan
Diary, TSF agri app
337
Indicator 3.1.4 Average quintal per acre of
vegetables produced
Yearly 35 39 44 50
Productivity register, Kisan
Diary, TSF agri app
Outcome 3.2 Increase in
cropping intensity
Indicator 3.2.1 Cropping intensity Yearly 110% 120% 128% 135%
Additional irrigation area
covered details, second and
third crops area under
cultivations, TSF Agri app
Objective 4 To build and
strengthen community
institutions
Outcome 4.1 Development of
strong and functional
community-based organisations
related to land and agriculture
Indicator 4.1.1 No. of village watershed
committees
Quarterly 7 7 7 7
VWC formation and
meeting registers
Indicator 4.1.2 No. of farmer organisations Quarterly 0 40 70 92
WUG formation and
meeting registers
Indicator 4.1.3 No. of women-based SHGs
involved in group enterprises
Quarterly 0 19 25 32
Micro enterprise register
and SHG meeting registers
Indicator 4.1.4 No. of VWCs who have
accessed funds from WDF
Half-yearly 0 7 7 7
VWC formation and
meeting registers, VWC
WDF Bank passbook,
Ledger book
Objective 5 To augment
surface and groundwater
storage
Outcome 5.1 Increase in
groundwater level in project area
Indicator 5.1.1 Groundwater level (in metre) Quarterly 6m 5.5 4.5 3.5
Observation well register,
Geo tagging photographs of
different season
Outcome 5.2 Increase in surface
water storage capacity
Indicator 5.2.1 Water storage capacity (in
mcft)
Monthly 26.14 39.99 53.41 66.47
MB book, Designs, Geo
tagged data, List of WHS,
Photographs, Monthly,
Quarterly & Annual
progress reports

Monitoring framework for an environmental project

  • 1.
    336 Project Objective OutcomesIndicators Frequency of Measurement Baseline Target FY25 Target FY26 Target FY27 MOV Objective 1 To improve the socio-economic status of communities living in the watershed areas Outcome 1.1 Enhancement of household income of farmers Indicator 1.1.1 Total no. of farmers Yearly new 700 1100 1600 Monthly MIS, Quarterly & annual progress report Indicator 1.1.2 Annual household income of farmers Yearly 49000 80000 120000 140000 Farmers diary, Productivity register, TSF Agriculture application, Beneficiary list, Case studies Outcome 1.2 Reduction in seasonal migration Indicator 1.2.1 No. of adult males migrating per year Half-yearly 1941 1359 1165 971 Attendance & muster roll registers under daily wage employment Indicator 1.2.2 No. of adult females migrating per year Half-yearly 435 390 360 320 Attendance & muster roll registers under daily wage employment Objective 2 To stabilise existing watersheds through soil and water conservation measures Outcome 2.1 Reduction in soil erosion from watershed area Indicator 2.1.1 Area treated (in hectares) through soil & water conservation measures Monthly 0 210 240 270 Geo tagging, Farmers application, MB Book, Bhuvan Portal, Pre-Post photgraphs, Case studies, MIS documents, Monthly MIS, Quarterly & annual progress report Objective 3 To improve soil health and increase the area under irrigation Outcome 3.1 Increase in productivity Indicator 3.1.1 Average quintal per acre of paddy produced Yearly 13 16 18 19 Productivity register, Kisan Diary, TSF agri app Indicator 3.1.2 Average quintal per acre of other cereals produced (Millets, Maize) Yearly 5 6.5 7.0 7.5 Productivity register, Kisan Diary, TSF agri app Indicator 3.1.3 Average quintal per acre of oil seeds and pulses produced Yearly 4 5.5 6.2 6.5 Productivity register, Kisan Diary, TSF agri app
  • 2.
    337 Indicator 3.1.4 Averagequintal per acre of vegetables produced Yearly 35 39 44 50 Productivity register, Kisan Diary, TSF agri app Outcome 3.2 Increase in cropping intensity Indicator 3.2.1 Cropping intensity Yearly 110% 120% 128% 135% Additional irrigation area covered details, second and third crops area under cultivations, TSF Agri app Objective 4 To build and strengthen community institutions Outcome 4.1 Development of strong and functional community-based organisations related to land and agriculture Indicator 4.1.1 No. of village watershed committees Quarterly 7 7 7 7 VWC formation and meeting registers Indicator 4.1.2 No. of farmer organisations Quarterly 0 40 70 92 WUG formation and meeting registers Indicator 4.1.3 No. of women-based SHGs involved in group enterprises Quarterly 0 19 25 32 Micro enterprise register and SHG meeting registers Indicator 4.1.4 No. of VWCs who have accessed funds from WDF Half-yearly 0 7 7 7 VWC formation and meeting registers, VWC WDF Bank passbook, Ledger book Objective 5 To augment surface and groundwater storage Outcome 5.1 Increase in groundwater level in project area Indicator 5.1.1 Groundwater level (in metre) Quarterly 6m 5.5 4.5 3.5 Observation well register, Geo tagging photographs of different season Outcome 5.2 Increase in surface water storage capacity Indicator 5.2.1 Water storage capacity (in mcft) Monthly 26.14 39.99 53.41 66.47 MB book, Designs, Geo tagged data, List of WHS, Photographs, Monthly, Quarterly & Annual progress reports